0884
Periods of discernible cognition contribute to dynamic functional connectivity during rest1Section on Functional Imaging Methods, National Institute of Mental Health, Bethesda, MD, United States, 2Basque Center on Cognition, Brain and Language, San Sebastian, Spain, 3Machine Learning Team, National Institute of Mental Health, Bethesda, MD, United States, 4FMRI Core Facility, National Institute of Mental Health, Bethesda, MD, United States
Synopsis
The etiology of time-varying functional connectivity (dFC) during rest is unclear. Those who hypothesize it to be neuronally relevant explore the phenomena in the context of consciousness, development and psychopathology. Yet, others have raised valid concerns regarding methodology or its significance beyond fluctuations in arousal and sleep. Here, we demonstrate how decodable covert on-going cognition contributes to dFC estimates during awake rest, suggesting that several meaningful FC configurations may be observable during rest. We also demonstrate how FC states—a common model for dFC—robustly capture periods of distinct cognition only when externally imposed, but not during rest.
Introduction
Demonstrating the cognitive relevance of rest dFC is challenging given its unconstrained nature and scarcity of methods to blindly infer its cognitive correlates. Yet, resting subjects engage in a succession of self-paced cognitive processes (1). Resting dFC could be a manifestation of this flow of covert cognition (2), even if other factors contribute. Here we test this hypothesis. In parallel, we evaluate how well FC-states (3, 4) track internally-driven on-going cognition.
For this, we extend the FC-states framework. By combining hemodynamic deconvolution (5) and activity-based reverse-inference (6), we infer the cognitive correlates of FC-states. Then, with manifold learning we uncover how FC-states relate to distinct cognitive periods. Comparative analyses across task and rest are important since substantial differences in externally-driven versus self-paced cognition may modulate the ability of FC-states to capture cognitively relevant information.
Methods
Methods were tested on two datasets: 1) multi-task data (20subjects) acquired as subjects engage in four different tasks (math, 2-back, visual-attention & rest) in 3-mins periods (7); 2) 15-mins rest scans from HCP (20 low-motion subjects;(8)).
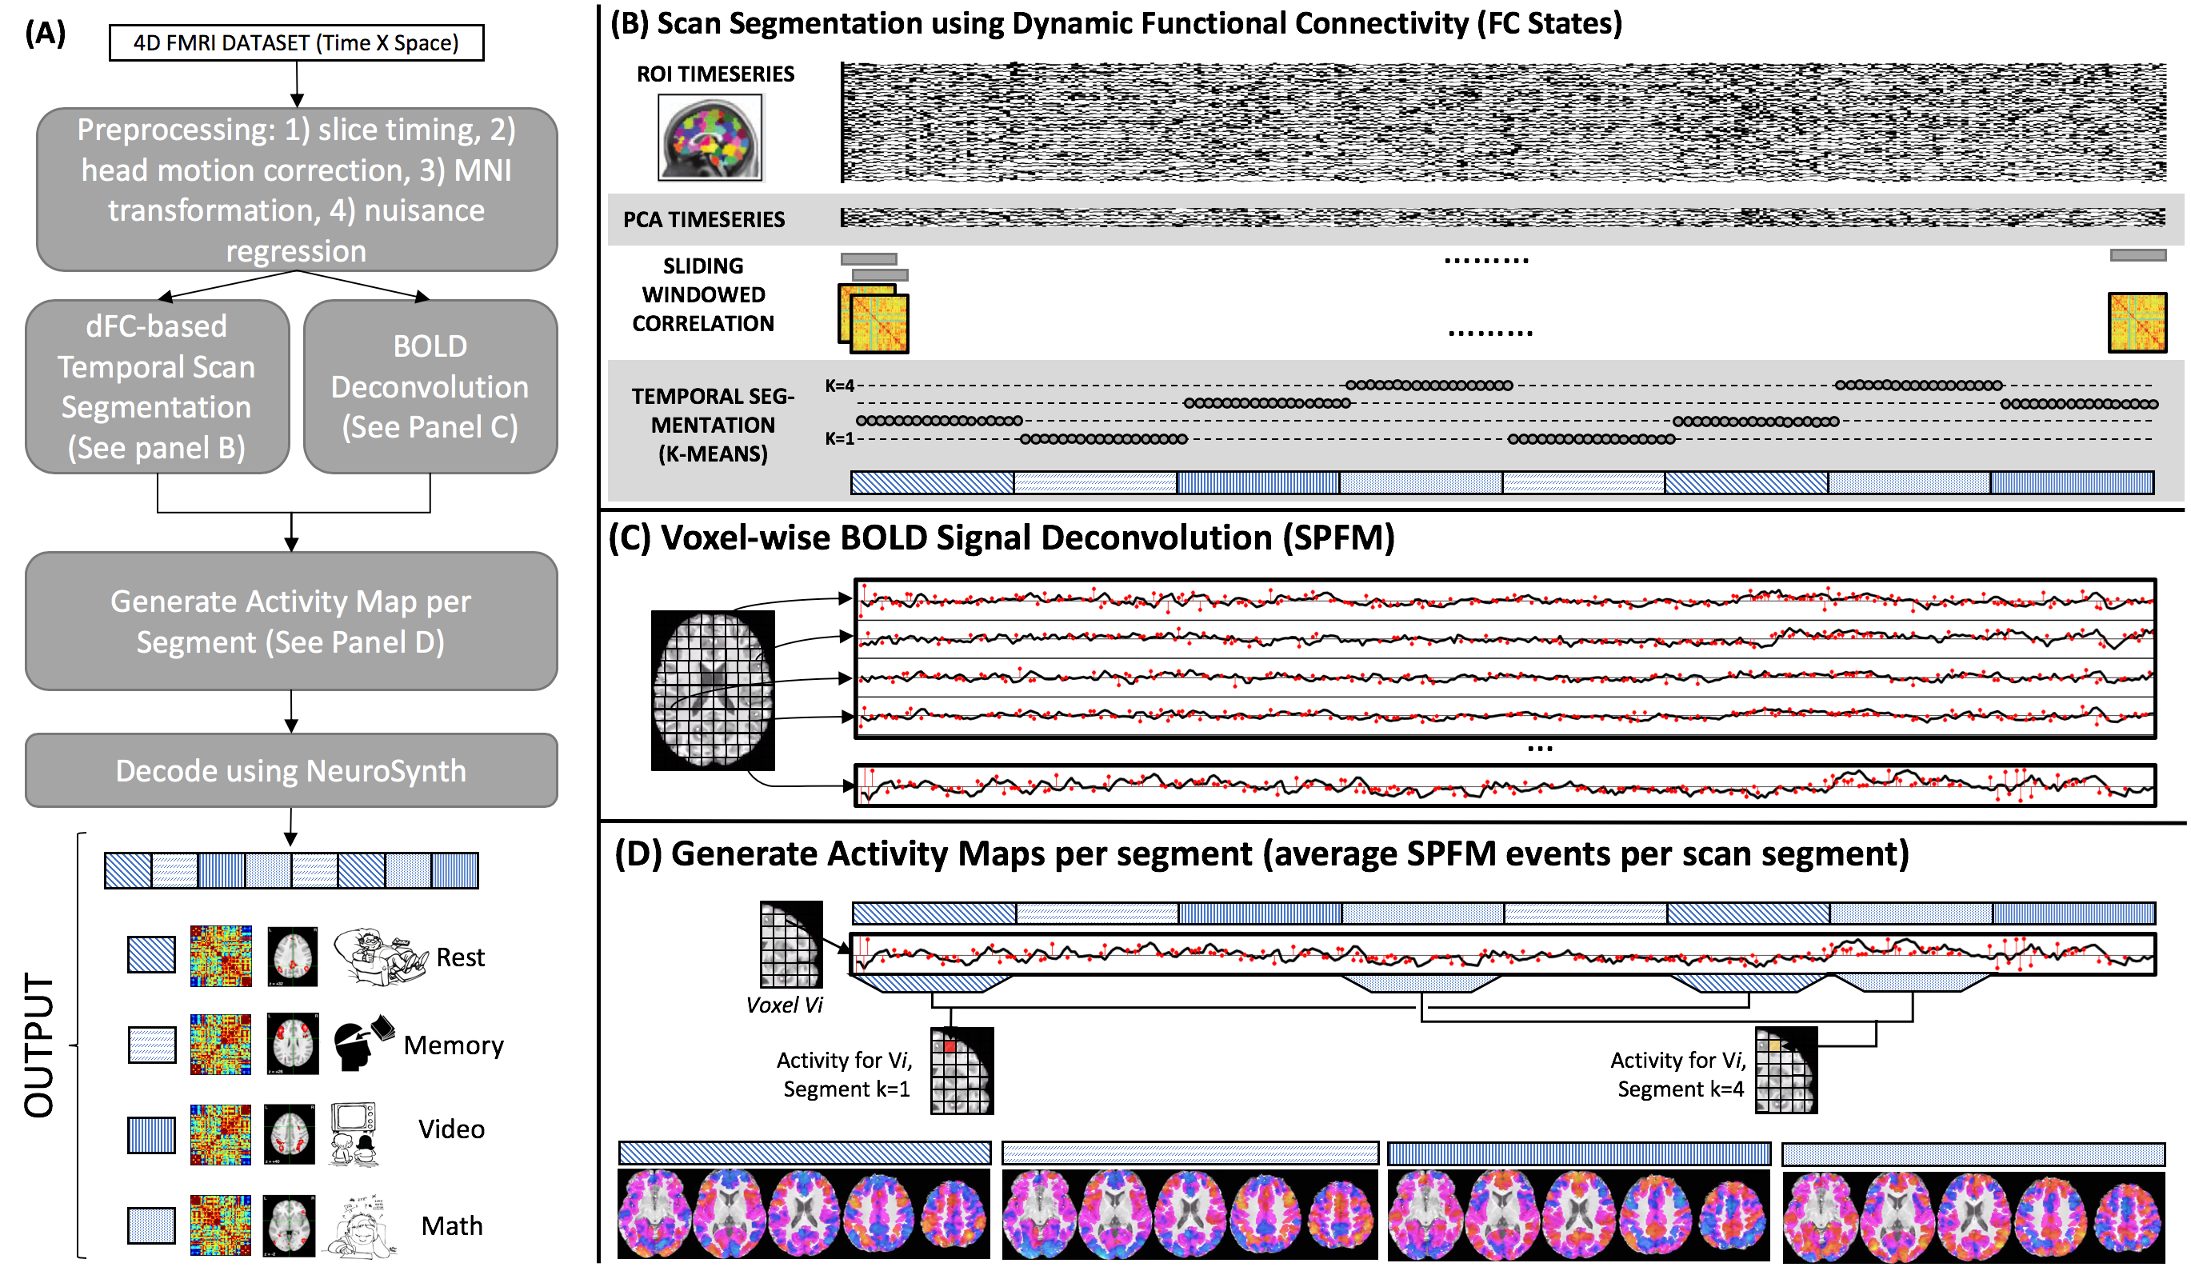
Following pre-processing (Fig.1.A), FC-states were estimated via (Fig.1.B): timeseries extraction using Craddock 200-ROIs Atlas (9), PCA dimensionality reduction, sliding window correlation (win. duration/step=30s/1.5s), Fisher’s transformation, and k-means. Each resulting cluster is an FC-state described by a FC matrix and timeline.
Windowed FC-estimates (snapshots) were also brought to 3D-space via Laplacian Eigenmaps (10), where each snapshot becomes a 3D point. Louvain community detection (11) was applied to snapshots’ adjacency matrices in 3D space to estimate the number of FC-states.
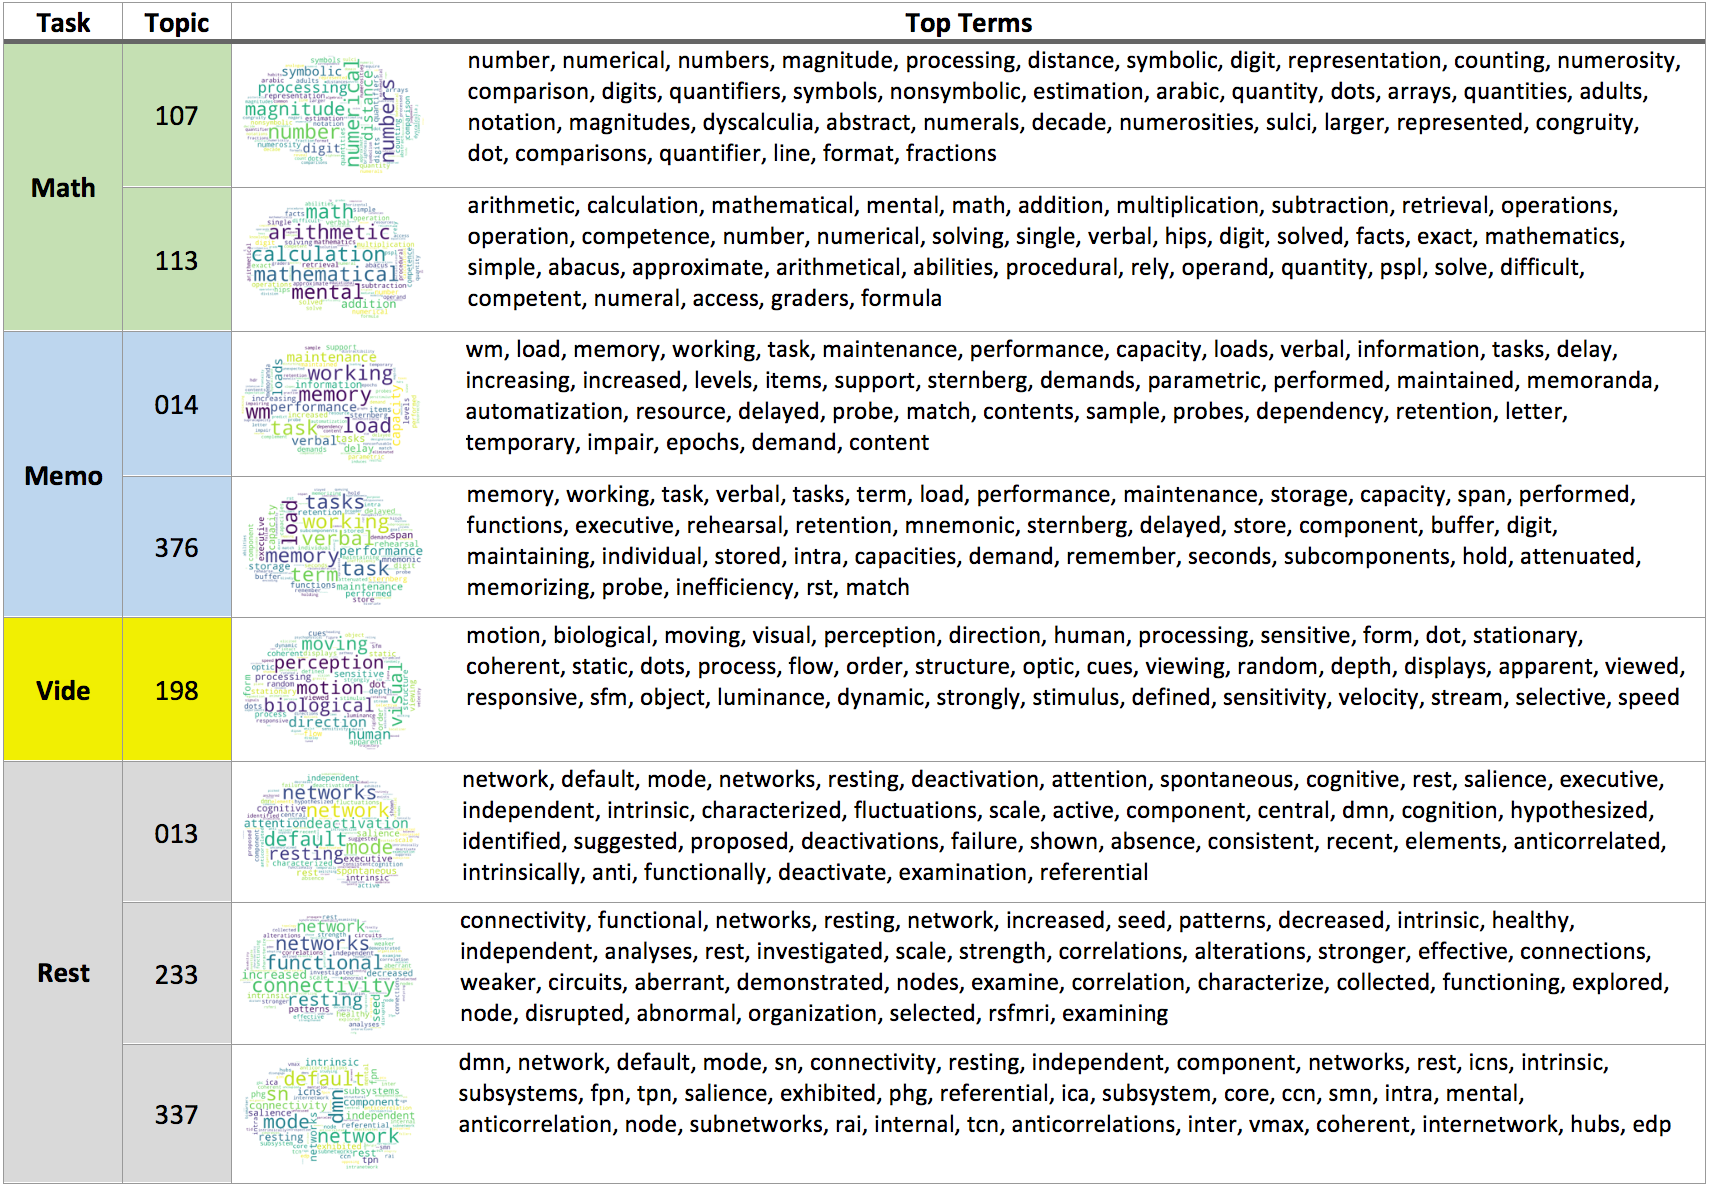
Cognitive correlates for FC-states were inferred next. First, SPFM (5) generated traces of activity-inducing events leading to canonical hemodynamic responses (Fig.1.C). Then, “activity” maps per FC-state were generated averaging events per state (Fig.1.D). Finally, “activity” maps were inputted to Neurosynth (6), which outputs a ranked list of topics (12) and their degree of association with input maps. Fig. 2 shows topics paired to each task that were used to evaluate the correctness of inferences with Rank Accuracy (13).
Results
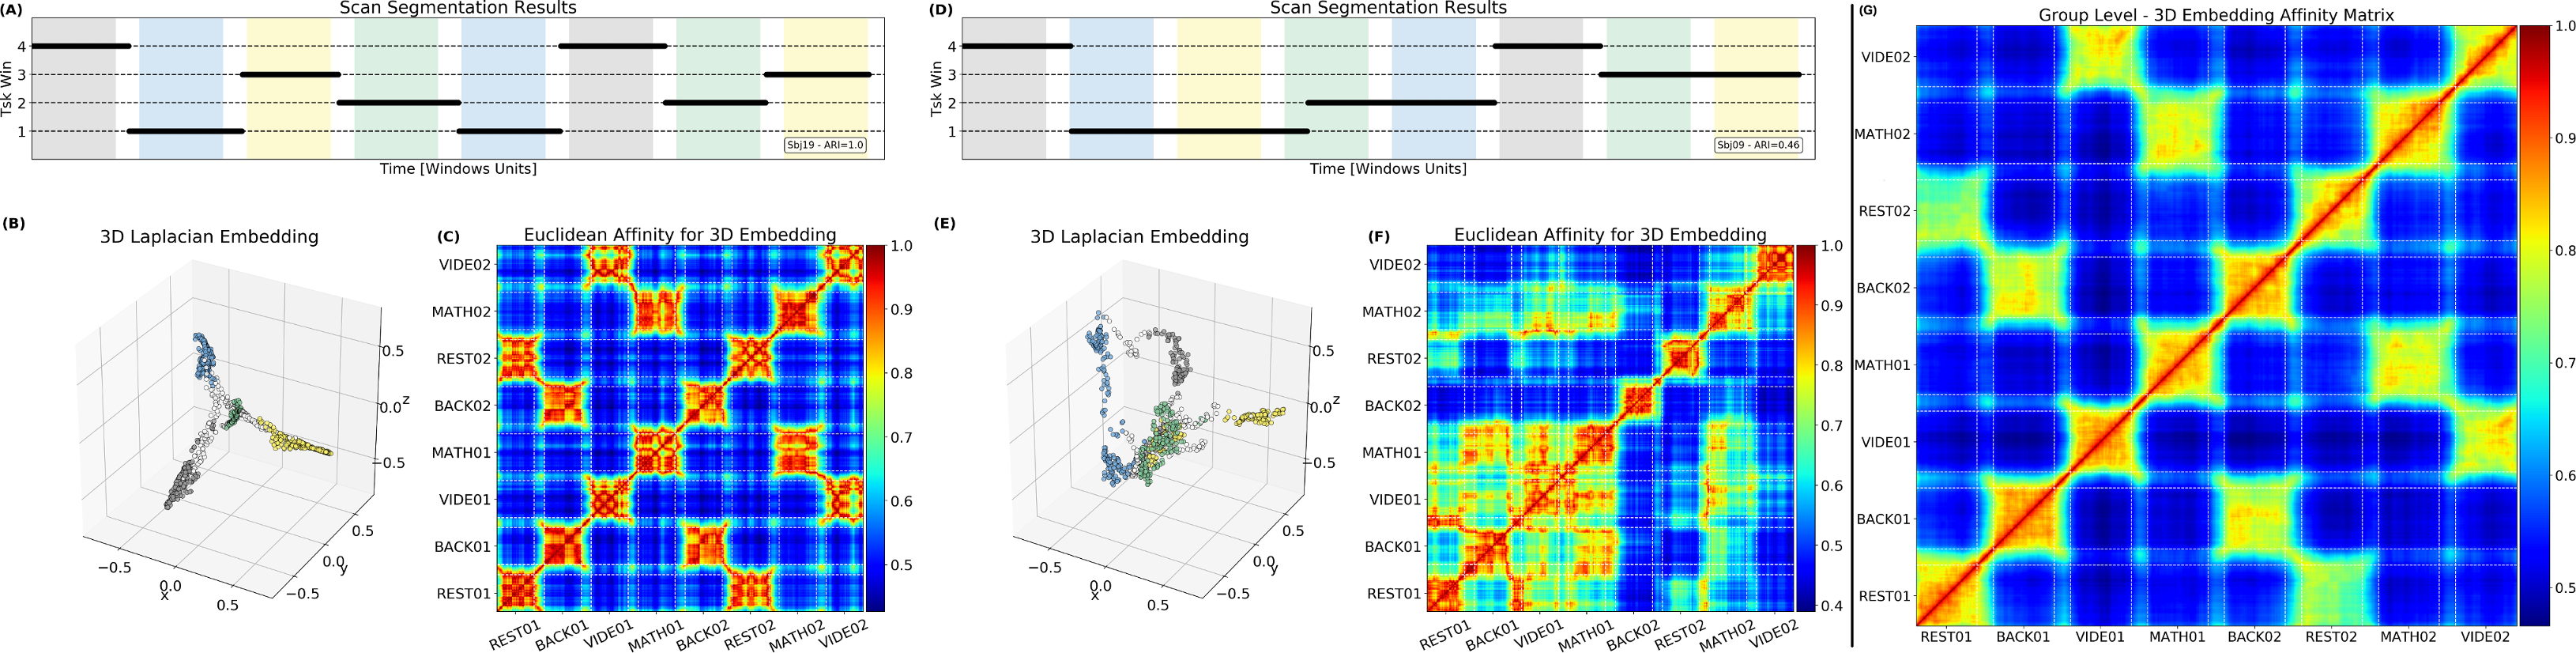
The estimated number of FC-states was 4 in 17 multi-task subjects. For rest, estimates varied between 3 and 4. Agreement between tasks and FC-states timing was quantified with Adjusted Rand Index (ARI;(14)). On average, FC-states faithfully recovered task timing (ARI=0.89±0.18). Fig.3.A shows a dFC-Timeline with perfect agreement (ARI=1) between FC-states and tasks. Fig.3.D shows a case of poor agreement (ARI=0.46) with FC-states extending across different task periods. Fig.3.B&E show embeddings for these subjects. When ARI>0.8, task-homogeneous snapshots cluster around “spokes”—one per task—that extend away from the center, while transition-snapshots (those spanning across tasks) form links that travel through the center of space. This motif dissolves for low ARI subjects (Fig.3.D-F). Similar results can be seen in terms of individual-subject and group-level affinity matrices (Fig.3.C&F).
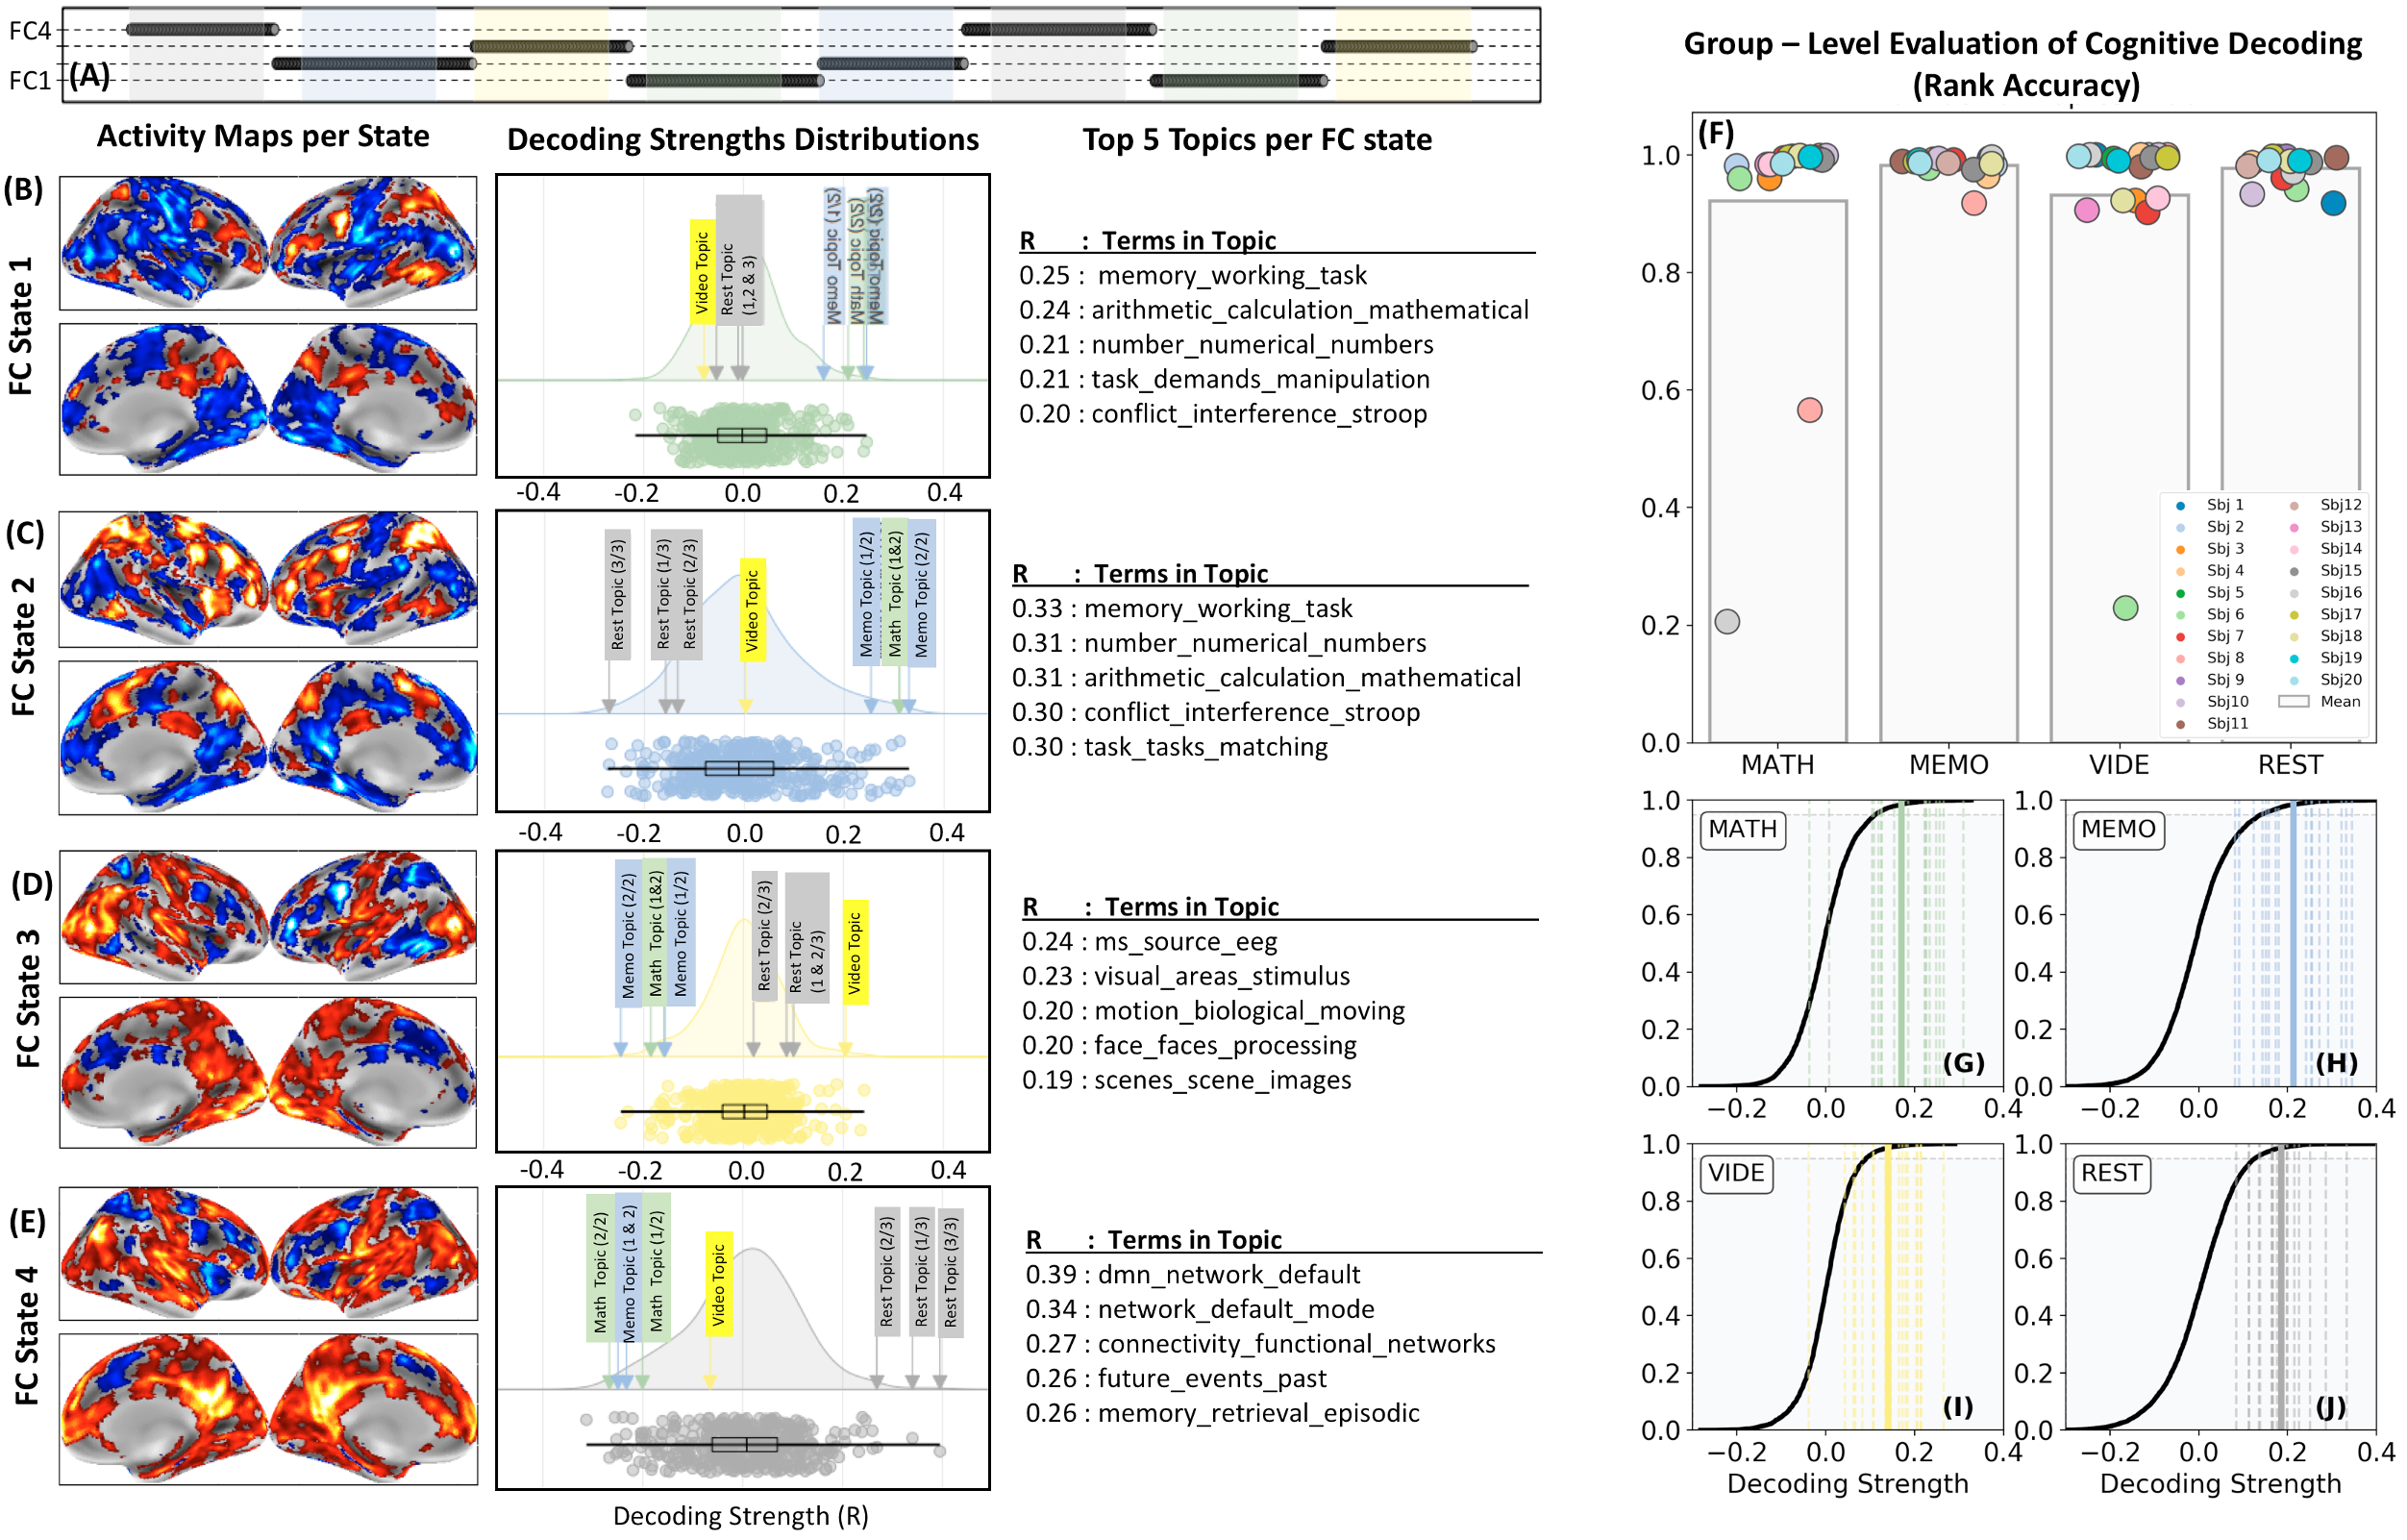
Fig.4.A-E show individual decoding results for another subject with FC-states following task timing (Fig.4.A). More specifically, FC-state1 spanned periods of MATH and FC-state2 periods of 2-BACK task. Their activity maps (Fig.4.B-C) show clusters in dorsolateral pre-frontal cortex and parietal regions, consistent with the nature of the tasks. FC-state3, which overlaps with the visual-attention task, has activity around MT/V5 and visual regions in ventral temporo-occipital cortex (Fig.4.D). Finally, FC-state4—which spans rest periods—shows activity in default mode network (Fig.4.E). Regarding decoding, top topics for FC-states1&2 are those with terms such as “memory”, “working”, “arithmetic”, “calculation” and “numbers”. FC-state3 top topics include the terms “visual”, “motion”, “biological”, “moving” and “scenes”. Finally, FC-state4 is associated with “dmn” and “default_mode”. Decoding was successful across subjects (Fig.4F-J).
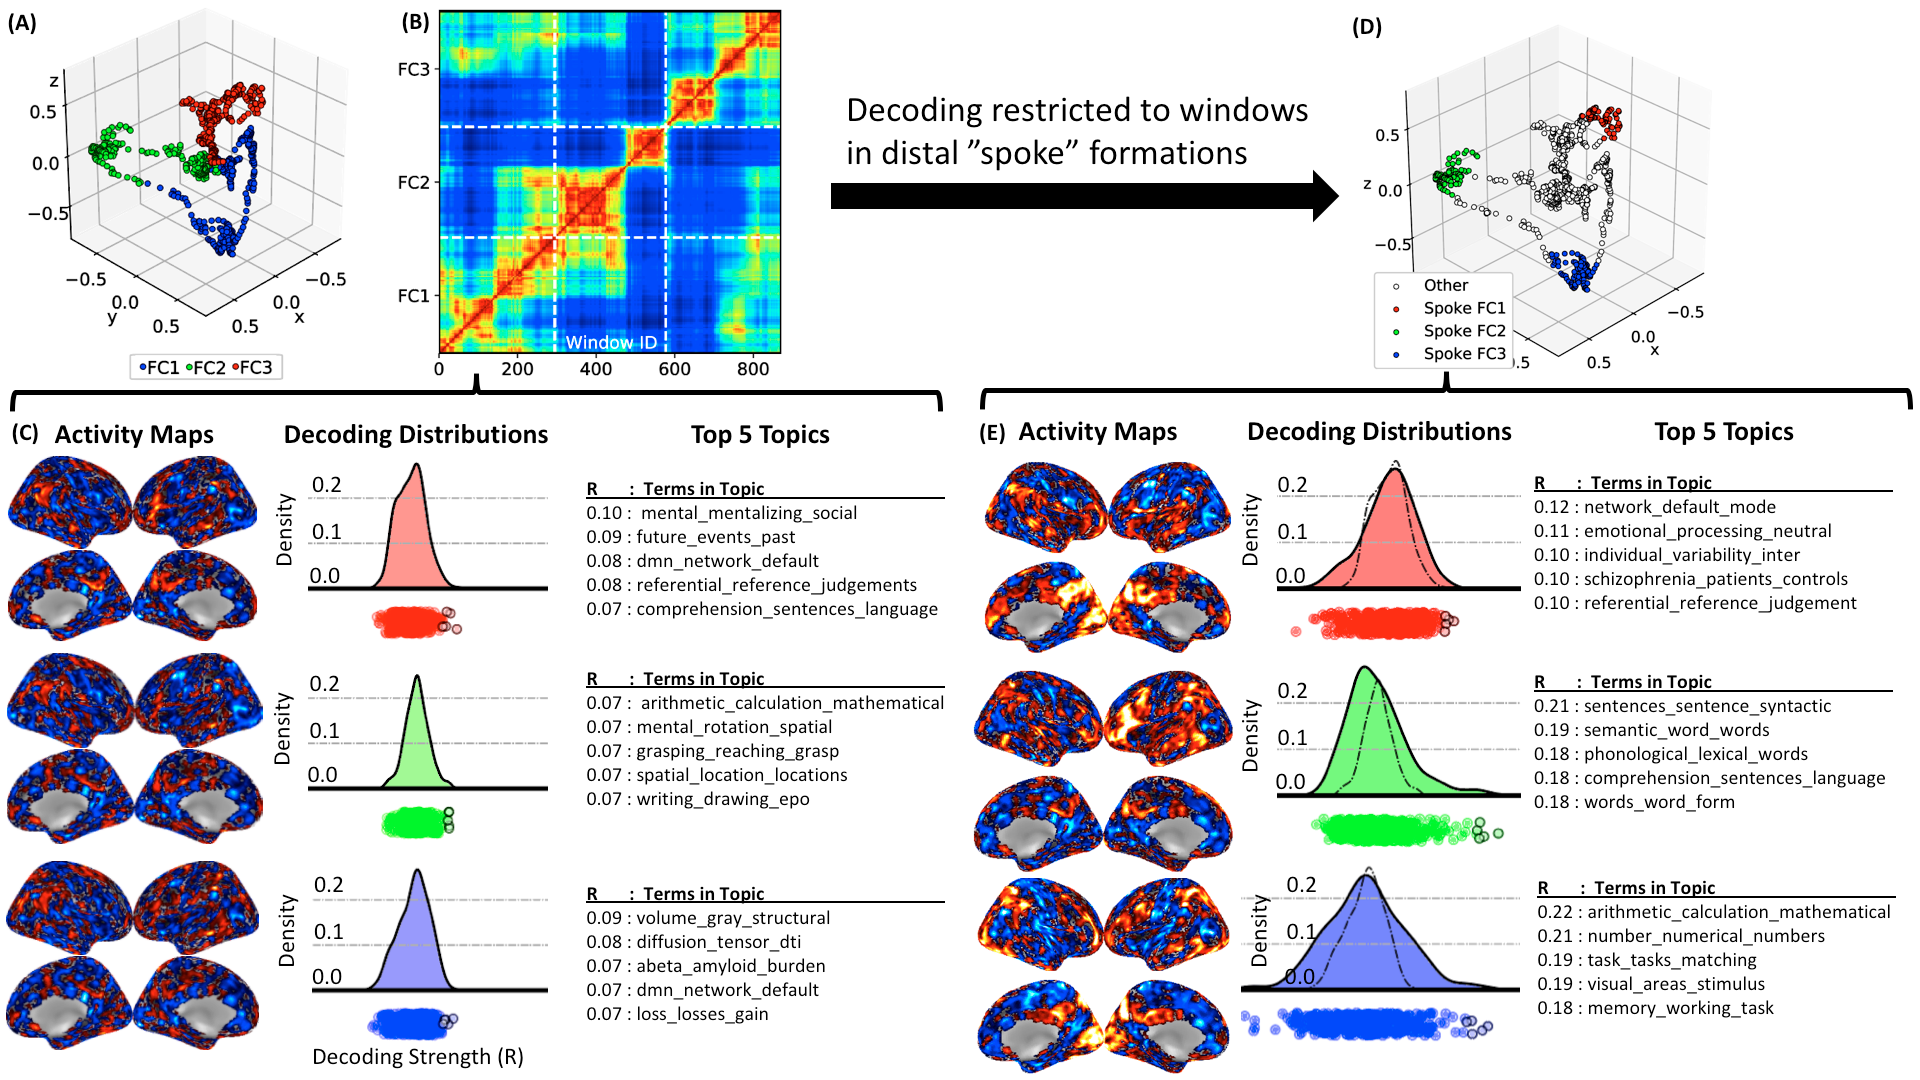
Fig 5 shows results for one representative HCP rest scan. Embeddings demonstrate the presence of spokes similar to those in the multi-task dataset, although they are less prominent (A&B). When decoding using data-driven FC states (C), decoding strength distributions are narrow and have no clear positive outliers (topics clearly associated). This is due to the contribution of windows crossing the center of the embeddings. When decoding is restricted to snapshots on the distal end of spokes (D) distributions widen and clear positive outliers appear. Outliers are associated with topics that describe cognitive processes previously reported as common among resting subjects (1).
Discussion & Conclusions
Results confirm that FC-states can accurately capture periods of distinct cognition driven by tasks; and the proposed extension to the FC-states framework permits inferring cognitive processes associated with task FC-states. We also show that, although periods of distinct cognition occur during pure rest, FC-state modeling doesn’t capture distinct states as often as in task data. Overall, our work suggests that ongoing cognition contributes to the modulation of resting dFC, and therefore more than one FC configuration occurs during rest. They also suggest that FC-states interpretation in relation to on-going cognition during rest is observable and merits continued study.Acknowledgements
This research was possible thanks to the support of the National Institute of Mental Health Intramural Research Program. Portions of this study used the high-performance computational capabilities of the Biowulf Linux cluster at the National Institutes of Health, Bethesda, MD (biowulf.nih.gov). This study is part of NIH clinical protocol number NCT00001360 and protocol ID 93-M-0170.
The Spanish Ministry of Economy and Competitiveness through Juan de la Cierva Fellowship (IJCI-2014-20821) and the “Severo Ochoa” Programme for Centres/Units of Excellence in R&D (SEV-2015-490).
Resting-state data were provided by the Human Connectome Project, WU-Minn Consortium (Principal Investigators: David Van Essen and Kamil Ugurbil; 1U54MH091657) funded by the 16 NIH Institutes and Centers that support the NIH Blueprint for Neuroscience Research; and by the McDonnell Center for Systems Neuroscience at Washington University.
References
1. Delamillieure P, et al.(2010) The resting state questionnaire: An introspective questionnaire for evaluation of inner experience during the conscious resting state. Brain Res Bull81(6):565-573.
2. Barttfeld P, et al.(2015) Signature of consciousness in the dynamics of resting-state brain activity. Proc Natl Acad Sci U S A112(3):887-892.
3. Allen EA, et al.(2014) Tracking whole-brain connectivity dynamics in the resting state. Cereb Cortex24(3):663-676.
4. Keilholz S, Caballero-Gaudes C, Bandettini P, Deco G, & Calhoun V (2017) Time-Resolved Resting-State Functional Magnetic Resonance Imaging Analysis: Current Status, Challenges, and New Directions. Brain Connect7(8):465-481.
5. Caballero Gaudes C, Petridou N, Francis ST, Dryden IL, & Gowland PA (2013) Paradigm free mapping with sparse regression automatically detects single-trial functional magnetic resonance imaging blood oxygenation level dependent responses. Hum Brain Mapp34(3):501-518.
6. Yarkoni T, Poldrack RA, Nichols TE, Van Essen DC, & Wager TD (2011) Large-scale automated synthesis of human functional neuroimaging data. Nat Methods8(8):665-670.
7. Gonzalez-Castillo J, et al.(2015) Tracking ongoing cognition in individuals using brief, whole-brain functional connectivity patterns. Proc Natl Acad Sci U S A112(28):8762-8767.
8. Van Essen DC, et al.(2013) The WU-Minn Human Connectome Project: an overview. Neuroimage80:62-79.
9. Craddock RC, James GA, Holtzheimer PE, 3rd, Hu XP, & Mayberg HS (2012) A whole brain fMRI atlas generated via spatially constrained spectral clustering. Hum Brain Mapp33(8):1914-1928.
10. Belkin M & Niyogi P (2003) Laplacian Eigenmaps for Dimensionality Reduction and Data Representation. 15(6):1373-1396.
11. Blondel VD, Guillaume JL, Lambiotte R, & Lefebvre E (2008) Fast unfolding of communities in large networks. Journal of Statistical Mechanics-Theory and Experiment10:P10008.
12. Poldrack RA, et al.(2012) Discovering relations between mind, brain, and mental disorders using topic mapping. PLoS Comput Biol8(10):e1002707.
13. Pereira F, et al.(2018) Toward a universal decoder of linguistic meaning from brain activation. Nat Commun9(1):963.
14. Hubert L & Arabie PJJoC (1985) Comparing partitions. 2(1):193-218.
Figures