0881
Predicting memory impairment using resting-state brain connectomes in older adults1Functional MRI Laboratory, University of Michigan, Ann Arbor, MI, United States, 2Psychiatry, University of Michigan, Ann Arbor, MI, United States
Synopsis
Resting-state connectome modelling is applied to a population of older adults, including controls, subjects with amnestic MCI, and subjects with AD. Significant prediction of subjects' composite memory scores is achieved.
Introduction
Brain network connectivity derived from resting-state fMRI has the potential to characterize normal and pathological aging. Multivariate classification is an important alternative to univariate techniques in studying the brain’s functional connectivity. A recently introduced multivariate technqiue, connectome predictive modelling (CPM1), generates a “brain score” computed from summing the significant correlations during a task or resting stating acquisition, then fits a linear model to relate that brain score to cognitive measures of interest. CPM has shown promise in relating single and multiple modality imaging-derived measures to clinical/behavioral observations in patient populations1,2,3.
The clinical phenotype of amnestic mild cognitive impairment (aMCI) conveys significant risk of conversion to dementia of the Alzheimer’s type (DAT), with resting-state functional connectivity appearing to change as a function of clinical biomarker status4. Recent work5 has applied CPM to resting-state data from the ADNI network and demonstrated a strong correlation between the resting-state connectivity and the subjects’ scores on the Alzheimer’s Disease Assessment Scale, demonstrating the utility of this approach in the AD population. However, this study was relatively underpowered, with a heterogenous population, and used data coming from a multitude of sites.
In this study, we applied CPM on resting-state data from 76 older adult subjects from one site, comprised of healthy controls, subjects with amnestic MCI (aMCI), and subjects with Alzheimer’s Disease; calculating the prediction of a composite measure of memory.
Methods
Subjects: 76 older adults enrolled in this study (age=69.2±7.4; 21F/55M) . Diagnosis was based on consensus conference that included neurologists, neuropsychologists, nurses, and other study team members following criteria used by the National Alzheimer’s Coordinating Center. This resulted in diagnoses of cognitively intact (n=28), aMCI (n=29), and DAT (n=19). For the purposes of this study, we calculated a composite memory score that was the mean z-score of the delayed recall for the Craft Stories, the Hopkins Verbal Learning Test – Revised, and the Benson Figure.
MRI Acquisition: MRI scans were collected on a 3T MR750 GE scanner. Resting-state scans were acquired using an multiband EPI sequence (MB factor=3, 240 FOV, 74x74 matrix, 3 mm slices, 45 slices, TR=0.9s, 512 timepoints). T1 MPRAGE anatomical scans were acquired,with 1mm isotropic resolution, for use in normalization.
Preprocessing: The resting-state data underwent physiological noise removal (cardiac and respiration) using RETROICOR6, slice timing correction using SPM8, and image registration using FSL (http://www.fmrib.ox.ac.uk/fsl/). The anatomical image was segmented and normalized into MNI space using VBM8. The normalization matrix was then applied to the resting-state data. The normalized resting-state data were then band-passed filtered (0.01 to 0.10 Hz) to limit the analysis to resting-state frequencies of interest9.
Data analysis: The resting-state data was parcellated into 264 regions of interest (ROIs) using the Power atlas10, with eight additional subcortical ROIs selected from the L/R amygdala and hippocampus region. Pearson product-moment correlation coefficients were calculated between average time courses in these 272 spherical ROIs. These correlation matrices were then transformed to z-scores using a Fisher r-to-z transformation.
CPM analysis was then applied following the protocol prescribed in Shen2. Briefly, A leave-one-out framework was used, in which one subject is left out for testing, while the rest are used for training data. The training data connectivity matrices are then correlated with the behavioral measure (memory, in this case), thresholding is done at significance<0.01 to select features, with the original connectivity values at those locations summed to give an overall brain score (done separately for positive and negative correlations). Then, a predictive model is fit, assuming a linear relationship between the brain score and the behavioral score. The fit linear model is then applied to the test data to generate the predicted memory score for that subject. The process is repeated over all subjects. Goodness of fit was measured as the correlation between the predicted and actual memory scores.
Results
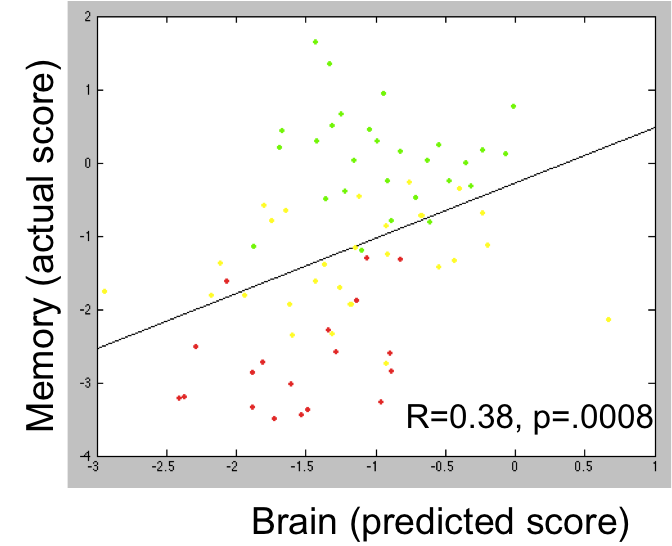
Using the CPM analysis, there was a significant positive relationship (R=0.38, p=.0008) between the predicted and actual memory score for the positive correlations (thus, increased correlations meant increased memory scores) (Figure 1). Memory scores were the highest for the healthy controls, lowest for the DAT subjects, with the scores for the aMCI subjects falling in between.
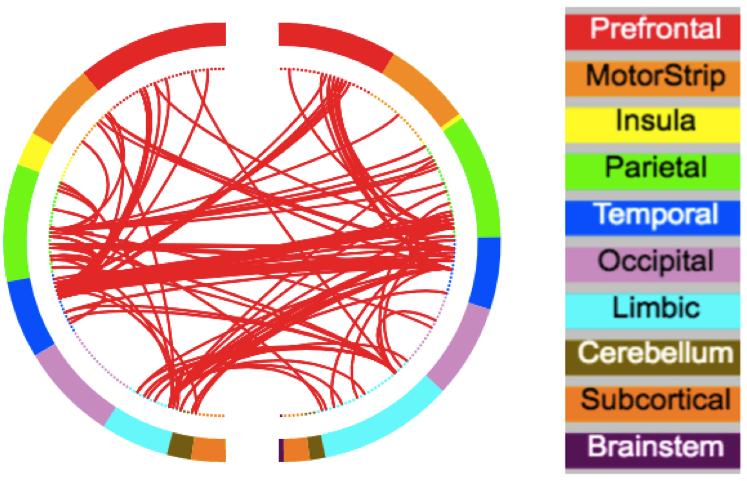
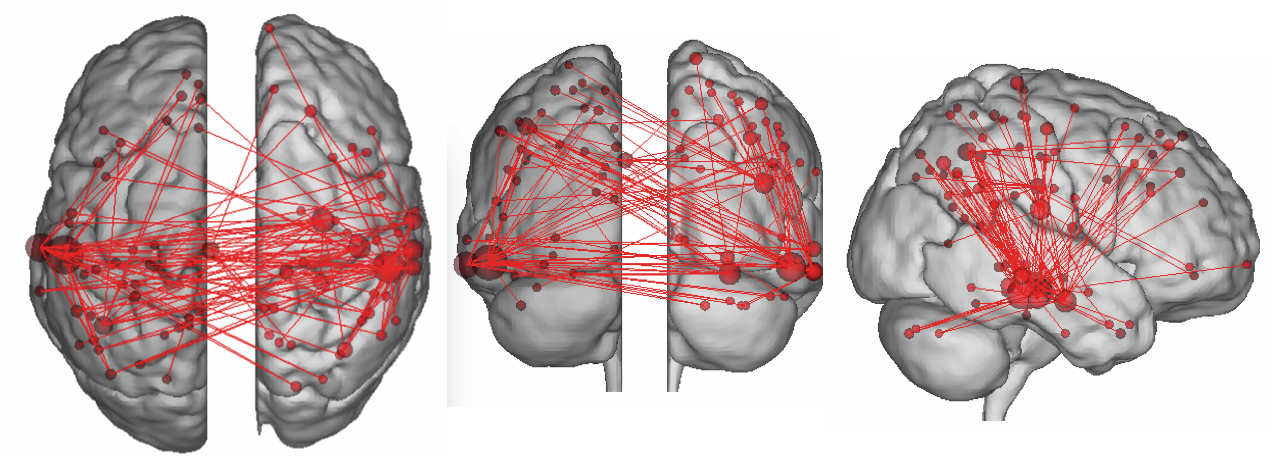
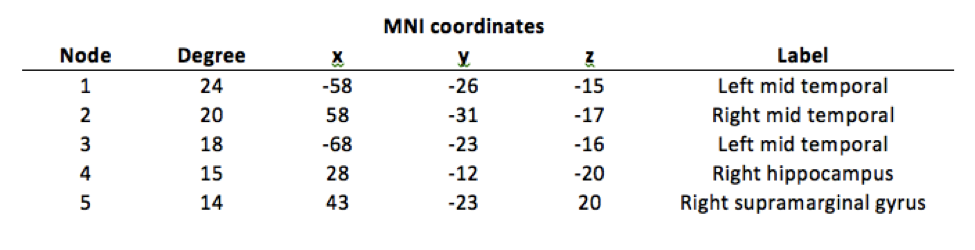
The nodes having the highest degree of connection were found to be in the temporal lobes, hippocampus, and supramarginal gyrus. (Figures 2,3; Table 1), which have all been implicated in the memory process and Alzheimer's Disease.
Discussion
This study establishes connectome predictive modelling can be used to predict memory integrity using resting-state scans in older subjects, with the model fit results showing that decreased connectivity is found with worsening memory and clinical diagnoses.Acknowledgements
No acknowledgement found.References
1. Finn ES, Shen X, Scheinost D, Rosenberg MD, Huang J, Chun MM, Papademetris X, Constable RT. Functional connectome fingerprinting: identifying individuals using patterns of brain connectivity. Nature neuroscience. 2015,18:1664.
2. Shen X, Finn ES, Scheinost D, Rosenberg MD, Chun MM, Papademetris X, Constable RT. Using connectome-based predictive modeling to predict individual behavior from brain connectivity. nature protocols. 2017, 12:506.
3. Lake EM, Finn ES, Noble SM, Vanderwal T, Shen X, Rosenberg MD, Spann MN, Chun MM, Scheinost D, Constable RT. The functional brain organization of an individual predicts measures of social abilities in autism spectrum disorder. bioRxiv. 2018, 290320.
4. Schwarz AJ, Yu P, Miller BB, Shcherbinin S, Dickson J, Navitsky M, Joshi AD, Devous MD, Sr., Mintun MS. Regional profiles of the candidate tau PET ligand 18F-AV-1451 recapitulate key features of Braak histopathological stages. Brain. 2016, 1539.
5. Lin Q, Rosenberg MD, Yoo K, Hsu TW, O'Connell TP, Chun MM. Resting-State Functional Connectivity Predicts Cognitive Impairment Related to Alzheimer's Disease. Frontiers in aging neuroscience. 2018, 10:94.
6. Glover GH, Li TQ, Ress D. Image‐based method for retrospective correction of physiological motion effects in fMRI: RETROICOR. Magnetic Resonance in Medicine. 2000, 44:162.
7. Power JD, Mitra A, Laumann TO, Snyder AZ, Schlaggar BL, Petersen SE. Methods to detect, characterize, and remove motion artifact in resting state fMRI. Neuroimage. 2014, 84:320.
8. Satterthwaite TD, Wolf DH, Loughead J,Ruparel K, Elliott MA, Hakonarson H, Gur RC,Gur RE. Impact of in‐scanner head motion on multiple measures of functional connectivity: Relevance for studies of neurodevelopment in youth. NeuroImage, 2012, 60:623.
9. Cordes D, Haughton VM, Arfanakis K, Wendt GJ, Turski PA, Moritz CH, Quigley MA, Meyerand ME. Mapping functionally related regions of brain with functional connectivity MR imaging. Am J Neuroradiol. 2000, 21:1636.
10. Power JD, Cohen AL, Nelson SM, Wig GS, Barnes KA, Church JA, Vogel AC, Laumann TO, Miezin FM, Schlaggar BL, Petersen SE. Functional network organization of the human brain. Neuron. 2011, 72:665.
Figures