0877
Machine Learning-based Analysis of Rectal Cancer MRI Radiomics for Prediction of Metachronous Liver Metastasis1Department of Radiology, Cancer Hospital, Chinese Academy of Medical Sciences and Peking Union Medical college, Beijing, China, 2Huiying Medical Technology Co., Ltd, Beijing, China
Synopsis
Early detecting patients at high risk of metachronous liver metastasis (MLM) in rectal cancer would provide the opportunity for improving prognosis and survival. In this study, we attempted to construct a non-invasive and convenient model based on rectal cancer T2WI and venous phase (VP) MR radiomics to predict MLM using support vector machine (SVM) and logistic regression (LR) algorithms. The results showed that the Modeloptimal using the LR algorithm had high potential for MLM prediction than other models. And except for ModelVP, the LR algorithm was not superior to the SVM algorithm for model construction.
Introduction/Purpose
Metachronous liver metastasis (MLM) severely influence prognosis in patients with rectal cancer. Effective biomarkers for early prediction of MLM are lacking. Therefore, we attempted to build MRI-based radiomics models using different machine-learning algorithms and imaging sequences to predict MLM in patients with rectal cancer at baseline treatment.
Methods
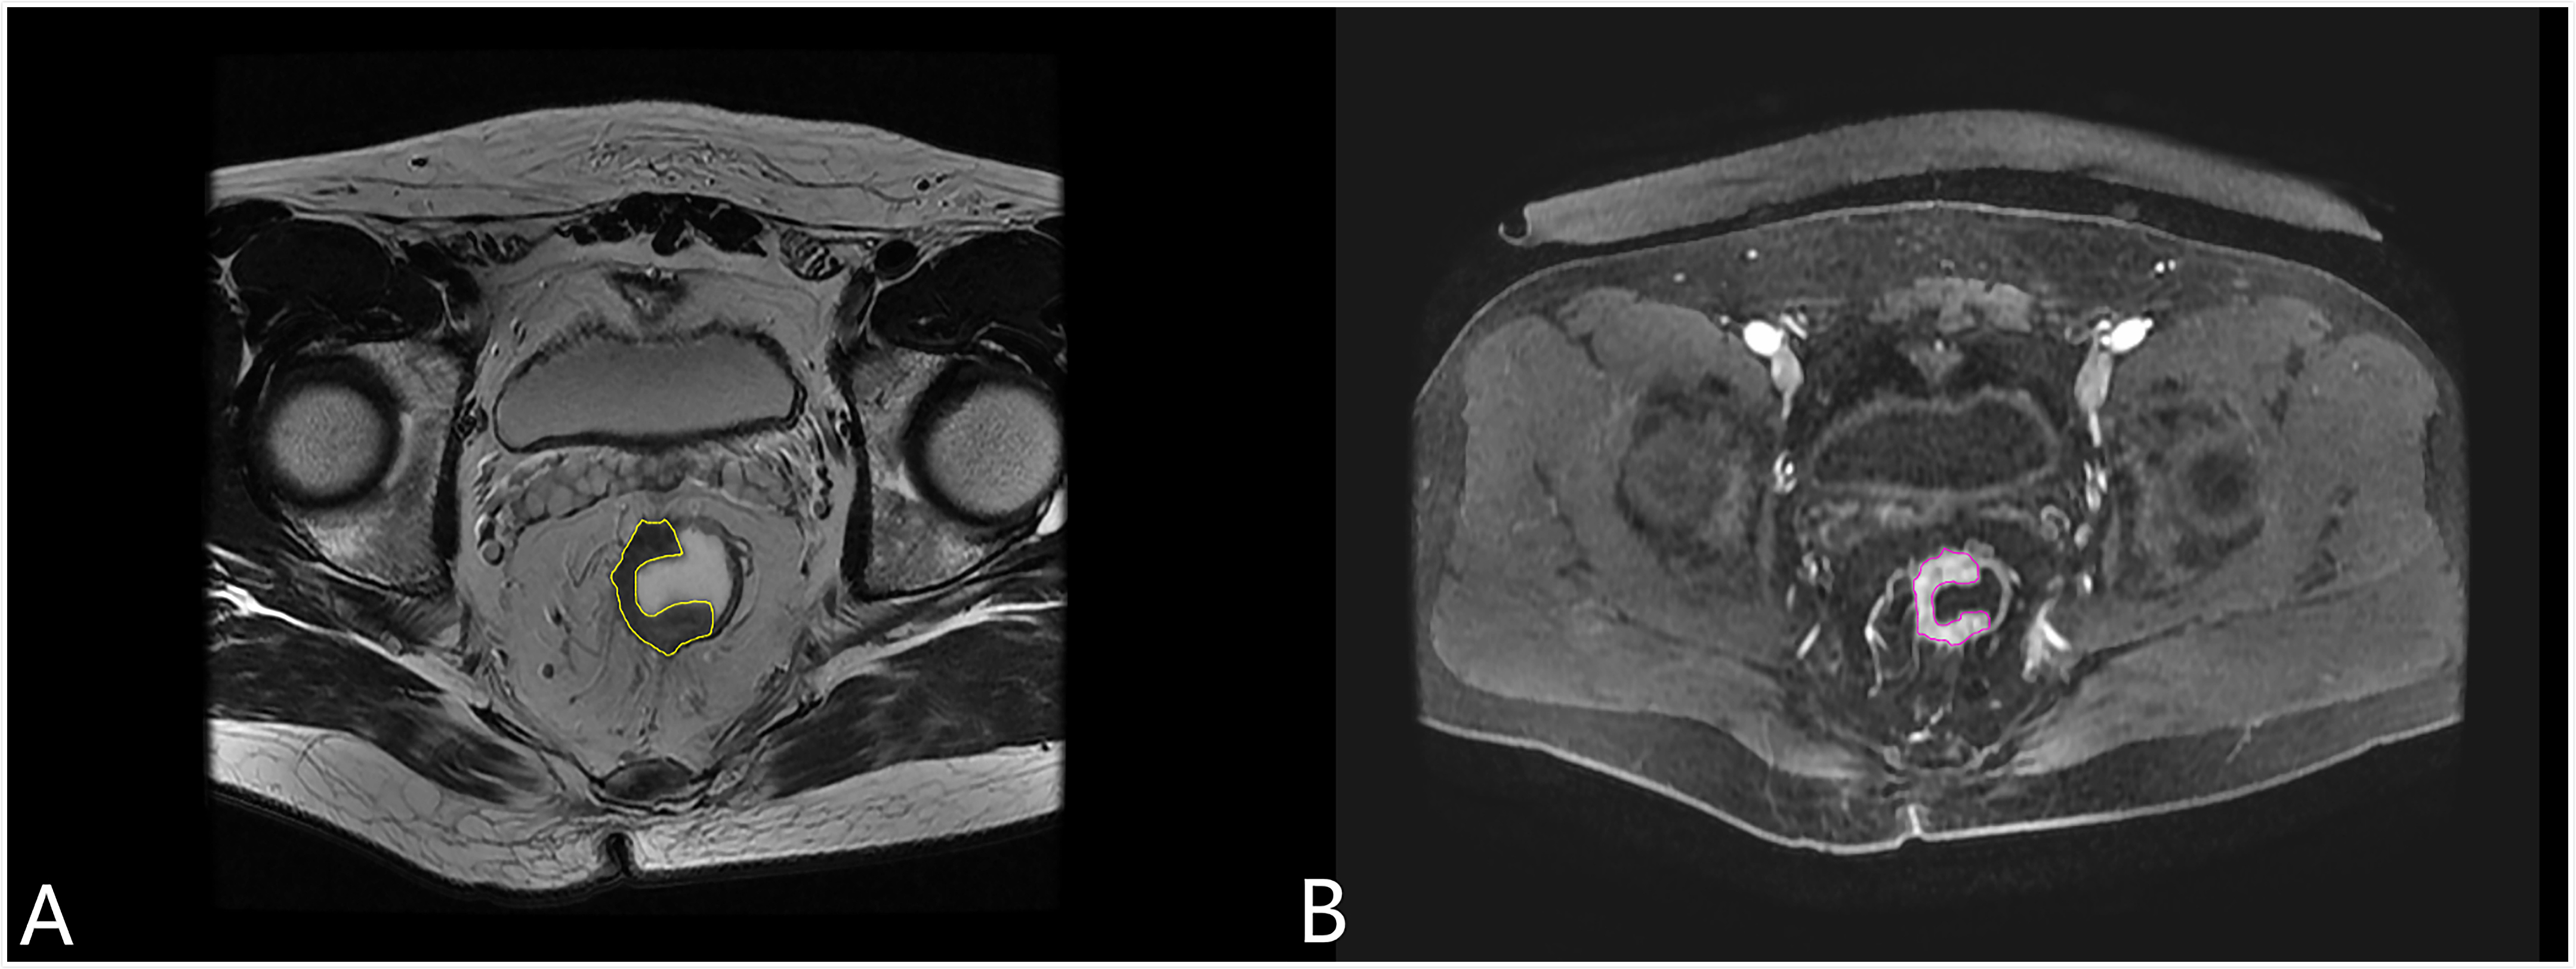
This study retrospectively analyzed 108 patients with rectal cancer (54 patients in MLM group and 54 patients in non-metastases group). Statistical analyses of clinical characteristics were performed using SPSS software with t-test or the chi-square test. A P-value less than 0.05 was considered to denote a significant difference. The consistency checks, feature selection, model development, statistical computations were performed and the graphics were prepared using the Anaconda3 platform with Python Scikit-Learn and Matplotlib packages. Volumes of interest (VOIs) were drawn manually to cover the whole rectal tumor on each consecutive slice (Figure 1). Radiomic features were extracted from VOIs of T2WI and venous phase (VP, acquired 60 s after contrast agent administration) images. The interclass correlation coefficient (ICC) was used to compare the consistency between the two radiologists with 30 randomly selected samples. Feature selection were performed in the radiomic feature sets extracted from images of T2WI and VP sequence respectively, and the combining feature set with 2058 radiomic features incorporating two sequences with the least absolute shrinkage and selection operator regression (LASSO) method. Five-fold cross-validation and two machine learning algorithms (support vector machine, SVM; logistic regression, LR) were utilized for predictive model constructing. The diagnostic performance of the models was evaluated by ROC curves with indicators of accuracy, sensitivity, specificity and area under the curve (AUC), and compared by DeLong test. One hundred-round five-fold cross-validations followed for verification of the stability and reproducibility of the predicted results.Results
There were no significant differences between the MLM group and non-metastasis group in baseline clinical characteristics (all P>0.05), including age, sex, T stage, N stage, CEA and CA199. A total of 1029 radiomic features were automatically extracted from VOIs from the T2WI and VP images of each patient. The ICCs between the two radiologists regarding the T2WI sequence ranged from 0.984 to 0.999, and from 0.931 to 0.999 for the VP sequence. Five, 8, and 22 optimal features were selected from 1029 T2WI features, 1029 VP features, and 2058 combined features, respectively (Figure 2). Four groups of models were constructed with the SVM and LR algorithms using (1) the 5 optimal T2WI features (ModelT2), (2) the 8 optimal VP features (ModelVP), (3) the combined 13 optimal features (Modelcombined), and the 22 optimal features selected from 2058 features (Modeloptimal). In ModelVP, the LR algorithm with an AUC of 0.74 (95% CI: 0.57–0.75) showed significantly better performance than the SVM algorithm (AUC: 0.68, 95% CI: 0.56–0.72) in predicting MLM (P=0.0303) (Figure 3). Comparing the prediction performance among the four groups of models using the LR algorithm, the Modeloptimal using the LR algorithm showed the best prediction performance (P=0.0019, 0.0028 and 0.0081, Delong test) with accuracy, sensitivity, specificity, and AUC of 0.80, 0.83, 0.76, and 0.87, respectively (Figure 4 and Figure 5). The ROC curves between the 1-round cross-validation and the 100-round cross-validation were highly coincident in the LR and SVM algorithms of the four groups of models.Discussion
Radiomics has the ability to capture intra-tumoral heterogeneity [1]. In this study, we constructed stable and effective non-invasive radiomics models for the early prediction of rectal cancer MLM. In our study, five-fold cross-validation was utilized for model building and 100-round cross-validation was applied to verify the stability and reproducibility of the results. The LR and SVM algorithms both achieved good performance. Compared with plain sequence, the enhanced sequence may extract more available features, and combining sequences may construct more valuable and effective model. They were in accordance with that knowledge [2, 3]. From the point of methodology and sequences, the predictive performance of Modeloptimal for MLM using the LR algorithm was superior to that of the other models in this study. Therefore, for patients with rectal cancer, a multi-modality radiomics predictive model may contribute to early prediction of MLM and help to guild follow-up examination.Conclusion
Radiomics models based on baseline rectal MRI has high potential for MLM prediction, especially the Modeloptimal using the LR algorithm. Moreover, except for ModelVP, the LR algorithm was not superior to the SVM algorithm for model construction.Acknowledgements
This work was supported by Chinese Academy of Medical Sciences Innovation Fund for Medical Sciences [2016-I2M-1-001]; Peking Union Medical College Youth Fund [2017320010]; Chinese Academy of Medical Sciences Research Fund [ZZ2016B01].References
[1] Gillies RJ, Kinahan PE, Hricak H. Radiomics: Images Are More than Pictures, They Are Data. RADIOLOGY 2016;278:563-577.
[2] Zhang Z, Yang J, Ho A, et al. A predictive model for distinguishing radiation necrosis from tumour progression after gamma knife radiosurgery based on radiomic features from MR images. EUR RADIOL 2018;28:2255-2263.
[3] Xi YB, Guo F, Xu ZL, et al. Radiomics signature: A potential biomarker for the prediction of MGMT promoter methylation in glioblastoma. J MAGN RESON IMAGING 2018;47:1380-1387.
Figures