0876
Differentiation Idiopathic Granulomatous Mastitis and Breast Carcinoma: Value of Whole-Lesion Histogram and Texture Analysis Using Quantitative ADC Map1Radiology, Longhua Hospital, Shanghai University of Traditional Chinese Medicine, Shanghai, China, 2Radiology, Fudan University Shanghai Cancer Center, Shanghai, China, 3MR Application Development, Siemens Shenzhen Magnetic Resonance, Shenzhen, China, 4MR Application Predevelopment, Siemens Healthcare, Erlangen, Germany
Synopsis
Recently, DWI has been increasingly used in distinguishing benign inflammation lesions and breast cancers. A total of 15 patients with invasive ductal carcinoma (IDC) and 10 patients with idiopathic granulomatous mastitis (IGM) were retrospectively evaluated. We extracted the whole-lesion histogram and textural features from the ADC map. Univariate and multivariate logistic regression analysis was performed. The area under the curve (AUC) at the best cut-off point was assessed. Using the three significant features (difference entropy, difference variance and entropy of ADC), we obtained an AUC of 0.953 (95% CI: 0.787, 0.998) for the differentiation between IGM group from tumor group.
Introduction
Idiopathic granulomatous mastitis (IGM) is a rare, benign inflammatory breast disease which can mimic breast cancer, both clinically and radiologically [1]. There is no specific feature on mammography, ultrasound, and DCE-MRI. DWI may assist in the differential diagnosis. There were several studies about the difference in ADC values of mastitis and invasive cancers [2-5]. However, their results were inconsistent to each other. To our knowledge, no study has performed the texture analysis on DWI for the differentiation of IGM and breast cancer. The purpose of our study was to determine the feasibility of whole-lesion histogram and texture analysis for differentiating IGM from breast cancer using quantitative ADC map.Methods
This retrospective study included 15 patients with pathologically-confirmed invasive ductal carcinoma (IDC) and 10 patients with pathologically-confirmed IGM. All MRI examinations were performed on a 1.5T scanner (MAGNETOM Avanto, Siemens Healthcare, Erlangen, Germany). The single-shot echo-planar imaging (EPI) DWI sequence was executed using the following parameters: TR/TE = 9000/83 ms; field of view = 340 x 208 mm2; matrix = 192 x 103; fat saturation mode: short time inversion recovery (STIR); TI = 180ms; slice thickness = 4 mm; b-value = 50, 500, and 800 s/mm2 with number of averages = 2; parallel acquisition (GRAPPA) with acceleration factor of 2; and acquisition time = 3:06 min. The segmentation of whole-lesion on the ADC images was conducted by the radiologist on the prototype MR Multiparametric Analysis software (Siemens Healthcare, Erlangen, Germany). A total of 11 histogram and textural features, including mean, standard deviation, median, percentiles (5th, 95th), skewness, excess kurtosis, difference entropy, difference variance, contrast, and entropy were extracted to characterize the segmented lesion regions. With the univariate analyses, the significant feature selection was performed by the Student’s t-test when normally distributed or Mann-Whitney U test when not normally distributed. In addition, the multivariate logistic regression analysis was performed, and the area under the curve (AUC) at the best cut-off point, sensitivity and specificity were assessed. All analyses were performed using SPSS (version 22; IBM, Armonk, NY, USA). A p value less than 0.05 was considered a statistically significant difference.Results
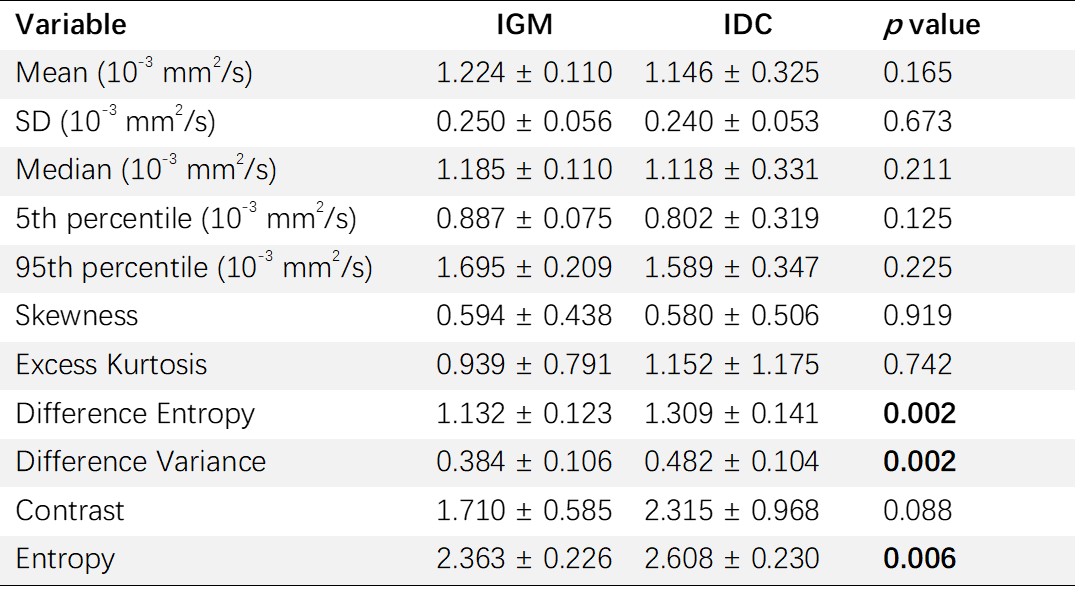
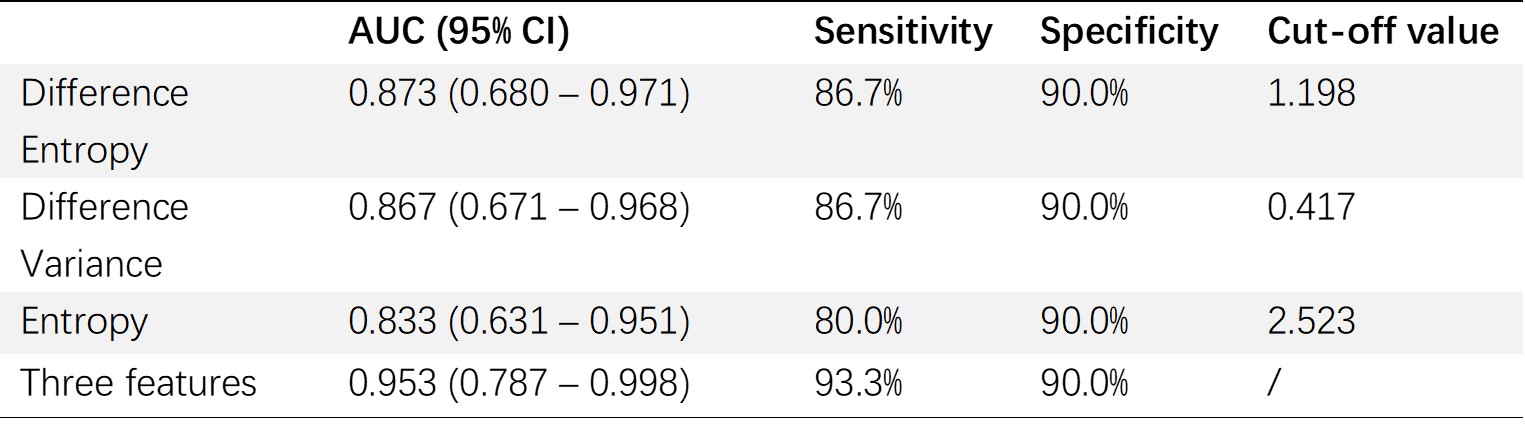
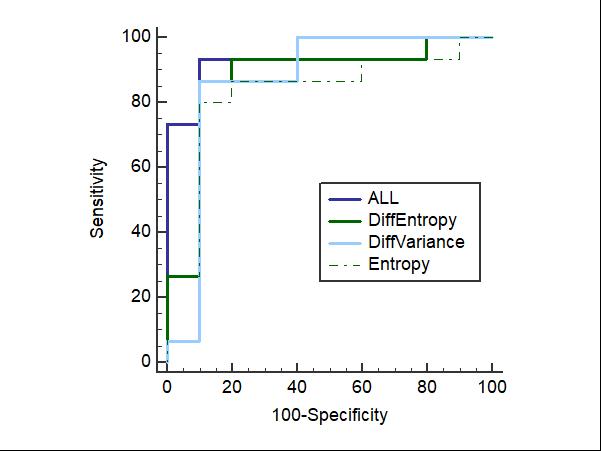
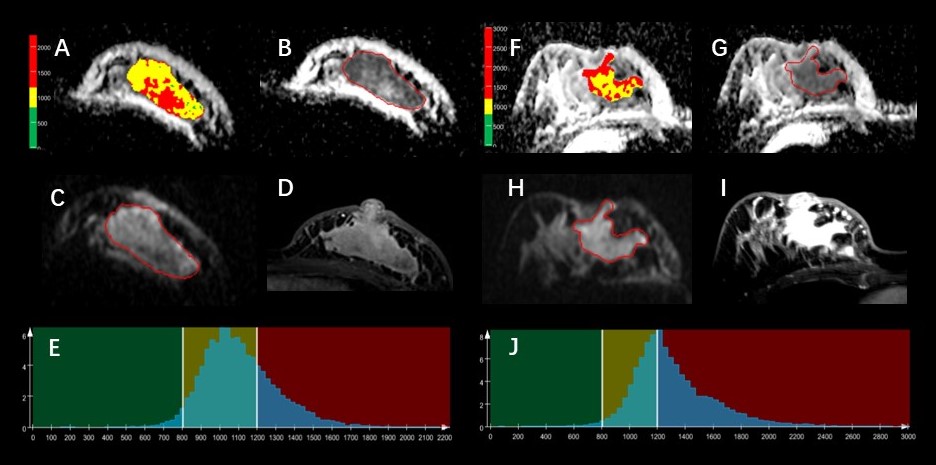
The univariate analysis of histogram and textural parameters for differentiating IGM from IDC is present in Table 1. The results of AUC are shown in Table 2 and Figure 1. The difference entropy, difference variance and entropy of ADC were significantly lower in IGM group than those in IDC group (p = 0.002, 0.002, 0.006, respectively). In multivariate analysis, the difference entropy, difference variance and entropy of ADC between IGM and IDC showed significant difference (p = 0.020, 0.034, 0.047, respectively). During ROC curves analysis, the difference entropy generated the highest AUC of 0.873 (95% CI: 0.680, 0.971), sensitivity of 86.7%, specificity of 90.0% with a cut-off of 1.198 for differentiating IGM and IDC. Using the three significant features, we obtained AUC of 0.953 (95% CI: 0.787, 0.998) with the sensitivity of 93.3% and specificity of 90.0% for the differentiation between two groups. Figure 2 shows ADC map overlaid with color maps of ADC values, ADC map, DWI with b 800 sec/mm2, the 1st phase of DCE-MRI and histogram of whole-lesion ADC map for IGM and IDC.Discussion and Conclusion
In our study, the difference entropy of ADC, which measures the image heterogeneity, generated the highest AUC of 0.873 (95% CI: 0.680, 0.971). A possible explanation is that the difference entropy of ADC could reflect the greater heterogeneity of breast cancer than that of inflammatory granuloma. The whole-lesion histogram and texture analysis based on the quantitative ADC map may facilitate distinguishing IGM from breast cancer.Acknowledgements
No.References
1. Milward TM, Gough MH. Granulomatous lesions in the breast presenting as carcinoma. Surg Gynecol Obstet. 1970; 130:478–482.
2. Durur-Subasi I, Durur-Karakaya A, Karaman A, et al. Is the necrosis/wall ADC ratio useful for the differentiation of benign and malignant breast lesions? Br J Radiol. 2017; 90:1073.
3. Aslan H,Pourbagher A,Colakoglu T, et al. Idiopathic granulomatous mastitis: magnetic resonance imaging findings with diffusion MRI. Acta Radiol. 2016; 57:796-801
4. Wang L, Wang D, Fei X, et al. A rim-enhanced mass with central cystic changes on MR imaging: how to distinguish breast cancer from inflammatory breast diseases? PLos One. 2014; 9 (3): e90355.
5. Kanao S,Kataoka M,Iima M, et al. Differentiating benign and malignant inflammatory breast lesions: Value of T2 weighted and diffusion weighted MR images. Magn Reson Imaging. 2018; 50:38-44.
Figures