0875
On the prospects of deep learning for automated lung segmentation for functional lung MRI1Division of Pediatric Respiratory Medicine, Department of Pediatrics, Inselspital, Bern University Hospital, University of Bern, Bern, Switzerland, 2Division of Radiological Physics, Department of Radiology, University Hospital Basel, Basel, Switzerland, Basel, Switzerland, 3Department of Biomedical Engineering, University Basel, Basel, Switzerland, Basel, Switzerland, 4Department of Radiology, Inselspital, Bern University Hospital, University of Bern, Bern, Switzerland
Synopsis
Deep learning algorithms have shown promise for precise organ segmentation. In this work, we investigate the prospects of deep learning for automated lung segmentation to assess impaired ventilation and perfusion measures using functional lung MRI.
INTRODUCTION
Specialized
proton based MR techniques for functional lung imaging, such as Fourier decomposition1, PREFUL2 and Matrix Pencil (MP)3, have
recently shown promise to evaluate
local ventilation and perfusion deficits in patients with lung disease.4-7 The assessment of
local pulmonary functional defects, for instance relative impaired ventilation
and perfusion (RFV,
RQ), requires segmentation
of the lung tissue. Currently this is based on time-consuming semi-automatic,
e.g. region-growing, methods hampering a translation to clinical routine.
Recently, deep learning (DL) algorithms have shown compelling results for
automatic organ segmentation. We have previously shown that in a cohort of
children with cystic fibrosis (CF) a deep learning algorithm8 was able to segment accurately and consistently
the lung in 85% of cases, reaching a dice correlation coefficient of 93% when compared
to human manual segmentations.9 The purpose of this work is thus to
investigate the prospects of DL methods to assess relative impaired ventilation
and perfusion volume, as derived from MP-MRI.METHODS
MR Data
This study included preliminary data from 9 children with CF and 5 healthy children and was approved by our ethics committee. Functional imaging with MP-MRI, consisted of time-resolved 2D coronal acquisitions using ultra-fast steady state free precession during 50 seconds of free breathing.1,3 To cover the whole lung, MP-MRI was acquired at 8-to-10 slice planes. Total scan time was about 8 minutes. After specific deformable image registration10 a Matrix-Pencil algorithm computes perfusion- and ventilation-weighted maps of the lung. The pulmonary tissue is segmented on the base images. RFV and RQ are defined as ventilation and perfusion signal lower than 25% of the lung median values. Illustrative MP ventilation and perfusion maps and the resulting defect masks are representatively shown in Figure 1.
Lung segmentations
The lung in every slice (n=103) was segmented by two human observers (H1 and H2) and by a recurrent neural network (DL) (11). The neural network8 was previously trained in a CF cohort.9 The subjects presented in this very abstract were not included in the training and represents a validation cohort for the algorithm.
Data Analysis
We calculated the whole lung RFV and RQ in every subject using the segmentations of the three different observers (DL, H1 and H2). Percentage of differences for RFV, RQ between observers was calculated as (xObserver2-xObserver1)*100)/xObserver1. Agreement between observers was assessed graphically by the Bland-Altman method and analytically by calculating intra-class correlation (ICC) coefficients. With Bland-Altman method, we calculated the upper and lower limits of agreement between observers (mean difference ± 1.96 SD of differences between observers). ICC estimates and their 95% confident intervals were calculated using Stata™ (StataCorp. 2015, Release 14. College Station, TX: StataCorp LP) based on a mean-rating (k = 3), absolute-agreement, 2-way mixed-effects model.
RESULTS
The deep
learning algorithm took less than 2s to segment a slice, and all the slices were consistently
segmented. Human segmentation took
about 3-5 min per slice. Figure 2 shows representative segmentations of the base
images.
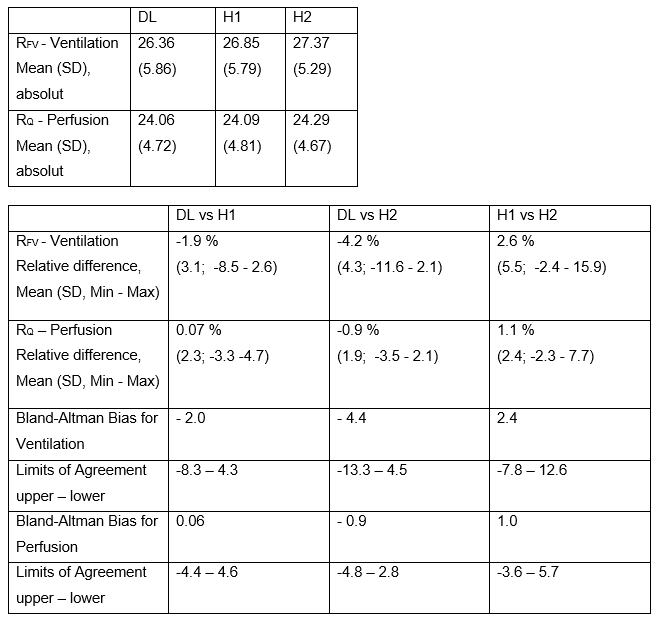
Mean
RFV and RQ results
for the three observers are shown in Table 1. The ICC for RFV and RQ between
the three observers was excellent (ventilation 0.947 to 0.988; perfusion: 0.989
to 0.995). Bland-Altman plots showing RFV
and RQ for the different segmentations are presented in
Figure 3. Segmentations from the DL algorithm resulted on average in lower RFV and
RQ
values (RFV: -3.1%;
SD= 3.9%, max= -11.6% and RQ: -0.4%
SD= 2.1, max= 4.7%) as compared to human observers. Compared with H1, segmentations
of H2 resulted in 2.6% and 1.1% higher RFV and RQ (SD=5.5%,
max=15.9% and SD=2.4%, max=7.7%).DISCUSSION AND CONCLUSIONS
The inter-reader variability of RFV and RQ between human and machine is similar to the inter-reader variability between human observers. In general, RQ seems to be a more robust biomarker since it is less prone to variability in segmentations, as compared to RFV. The largest deviations affecting especially RFV were noticed in very ventral slices (out-of-plane motion) or in very dorsal slices (partial volume effects next to the rib cage). In future work, the impact of human vs machine segmentations will be investigated on reproducibility MP-MRI data. In conclusion, the segmentations computed by the neural network show good agreement but still require human supervision.9 Nevertheless, the automated DL segmentation increases the feasibility of routine whole-lung quantitative assessment with MP-MRI in the clinical setting.Acknowledgements
This work was supported by the Swiss National Science Foundation (SNF grant No. 320030_149576).References
1. Bauman G, Pusterla O, Bieri O. Ultra-fast Steady-State Free Precession Pulse Sequence for Fourier Decomposition Pulmonary MRI. Magnetic resonance in medicine. 2016;75(4):1647-53.
2. Voskrebenzev A, Gutberlet M, Klimes F, et al. Feasibility of quantitative regional ventilation and perfusion mapping with phase-resolved functional lung (PREFUL) MRI in healthy volunteers and COPD, CTEPH, and CF patients. Magnetic resonance in medicine. 2018;79(4):2306-14.
3. Bauman G, Bieri O. Matrix pencil decomposition of time-resolved proton MRI for robust and improved assessment of pulmonary ventilation and perfusion. Magnetic resonance in medicine. 2017;77(1):336-42.
4. Nyilas S, Bauman G, Sommer G, et al. Novel magnetic resonance technique for functional imaging of cystic fibrosis lung disease. The European respiratory journal. 2017;50(6).
5. Nyilas S, Bauman G, Pusterla O, et al. Structural and Functional Lung Impairment in PCD: Assessment with MRI and Multiple Breath Washout in Comparison to Spirometry. Annals of the American Thoracic Society. 2018.
6. Nyilas S, Bauman G, Pusterla O, et al. Ventilation and perfusion assessed by functional MRI in children with CF: reproducibility in comparison to lung function. Journal of cystic fibrosis : official journal of the European Cystic Fibrosis Society. 2018.
7. Guo F, Capaldi DPI, McCormack DG, et al. A framework for Fourier-decomposition free-breathing pulmonary (1) H MRI ventilation measurements. Magnetic resonance in medicine. 2018.
8. Andermatt S, Pezold S, Cattin P. Multi-dimensional Gated Recurrent Units for the Segmentation of Biomedical 3D-Data - Deep Learning and Data Labeling for Medical Applications. MICCAI 2016, Springer International Publishing, 2016.
9. Pusterla O, Andermatt S, Bauman G, et al. Deep Learning Lung Segmentation in Paediatric Patients. ISMRM 2018.
10. Sandkühler R, Jud C, Pezold S, Cattin PC, editors. Adaptive Graph Diffusion Regularisation for Discontinuity Preserving Image Registration, Cham: Springer International Publishing, 2018.
Figures
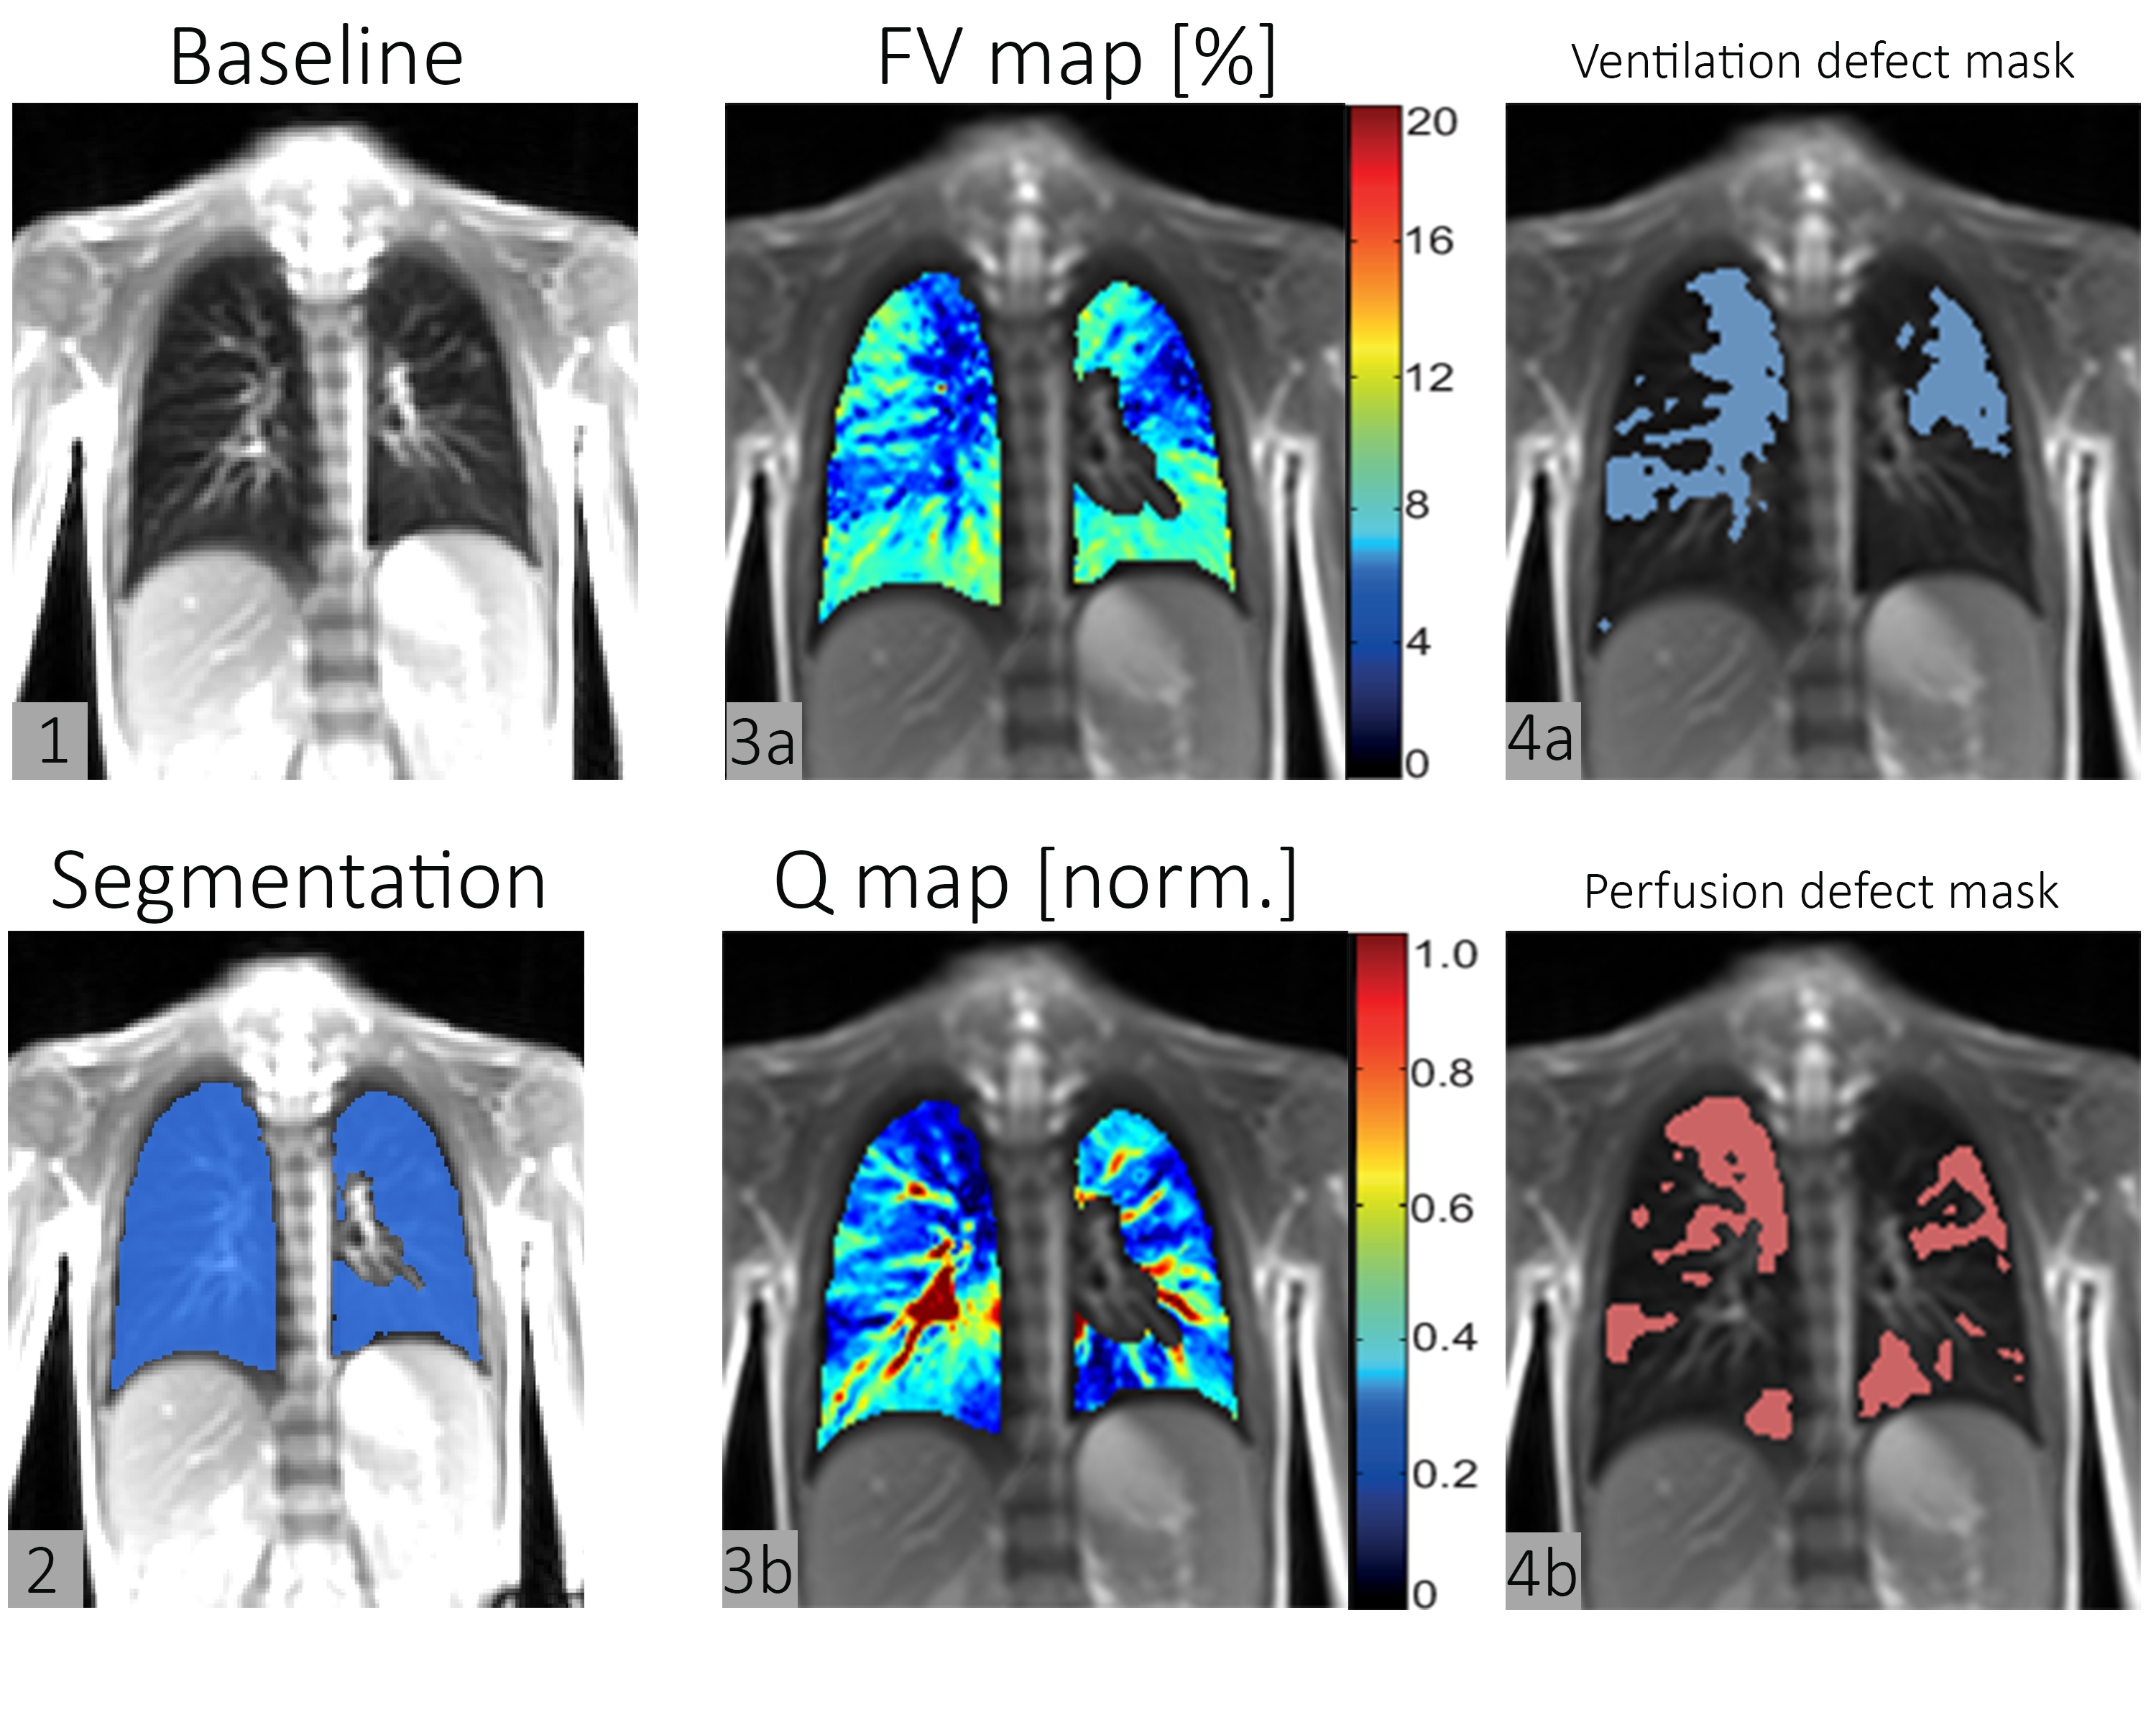
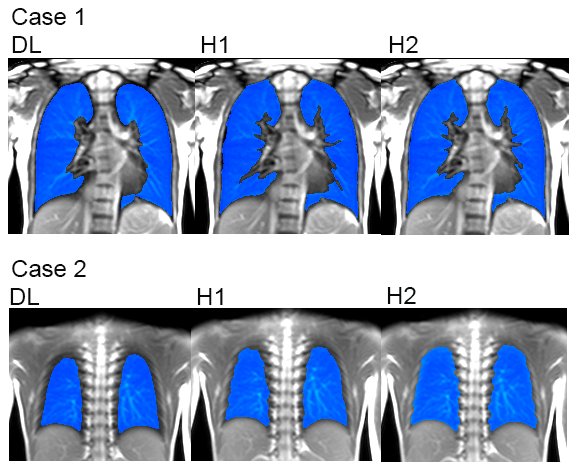
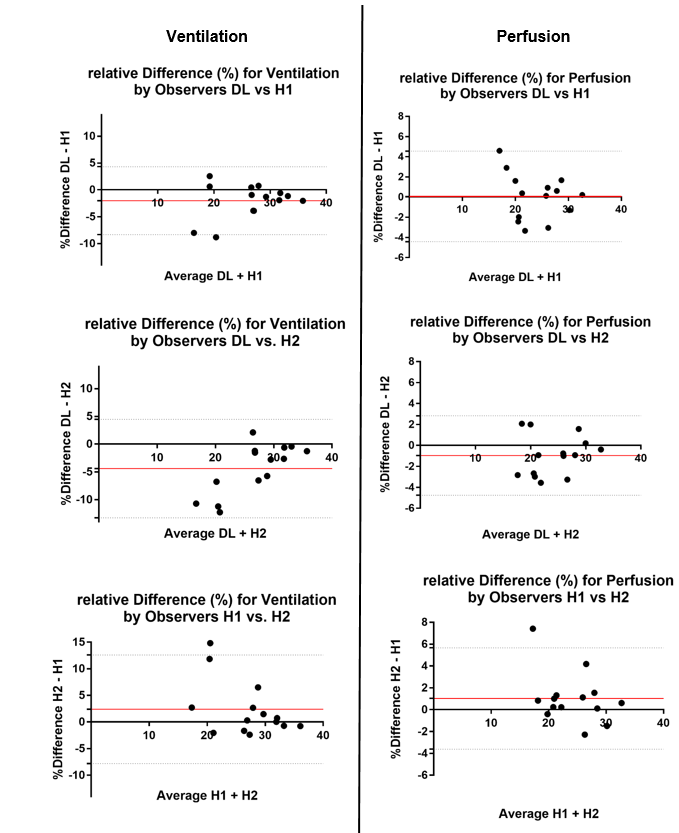
Figure 3. Bland-Altman Plots for relative Difference. Redline indicating Bias, Dotted lines indicating Limit of agreement.
We calculated the upper and lower limits of agreement between observers (mean difference ± 1.96 SD of differences between observers).