0874
Investigatory usage of a framework for automated cancer annotation of pathology slides of radical prostatectomy specimens: effect on performance of a predictive model for mpMRI detection of prostate cancer.1Center for Magnetic Resonance Research, University of Minnesota, Minneapolis, MN, United States, 2Division of Biostatistics, School of Public Health, University of Minnesota, Minneapolis, MN, United States, 3Department of Pathology, University of Washington, Seattle, WA, United States
Synopsis
The development of CAD systems for prostate cancer detection requires large amounts of training data with correlated pathologic ground truth. The gold standard is manual annotation of cancer by pathologists, which is tedious and difficult to obtain. Here, we retrospectively applied a previously-described digital-pathology framework for automating cancer annotation. We trained a Bayesian predictive model on the original ground truth (from manual annotation) and on the new ground truth, and compared the performances. The results suggest the ground truths are very similar and largely equivalent, which provides support for prospective usage of our approach for automatic annotation of prostate cancer.
Introduction
There has been significant interest in the development of computational models for detection of prostate cancer (PCa) using multiparametric MRI (mpMRI).1-3 The performance and validity of such models is highly-dependent on the training data. Arguably, the most reliable ground truth is derived from histopathologic examination of ex vivo prostate specimens obtained from radical prostatectomy (RP), as we previously described.1,4 However, manual annotation of PCa is not only time-consuming, but also associated with inter-reader, experience-dependent variability.5,6
Recently, we developed a framework for automatic annotation of PCa on digitized slides of RP specimens using colorimetric image analysis of both H&E slides and slides with immunohistochemistry (IHC) staining.7 Here, we retrospectively applied this approach to our modeling data, in effect generating a modified ground truth. This was then used to re-train the predictive model, and its performance was compared to that of the original model.
Methods
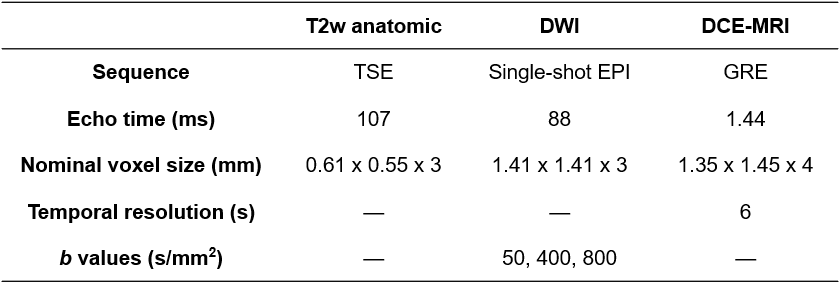
Modeling data were retrospectively acquired between 11/2009 and 01/2012 as previously described.1 Briefly, 34 patients with known PCa received mpMRI scans at 3T with a combination of a surface array coil and an endorectal coil (Table 1). Imaged patients subsequently underwent RP, and excised prostates were fixed and sliced into sections. Slides were stained for H&E, digitized, then assembled into pseudo-whole-mount (PWM) sections. Forty-six PWMs of interest were identified and co-registered to the mpMRI data8 to arrive at the final modeling data.
The 154 slides composing the selected PWMs were manually annotated for cancer by pathologists to obtain the original ground truth (To), and a subset of 69 slides were found to harbor significant cancer (Ssc). For each slide in Ssc, the original block was pulled, and two additional slides were cut; one was stained with H&E, and the other with a triple-antibody cocktail of HMWCK+p63+AMACR, which is routinely used to aid pathologic diagnosis of PCa.9 IHC slides were digitized, and SigMap software10 was used to register the H&E and IHC slides and to overlay a grid of 0.25mm2 analysis squares on both.
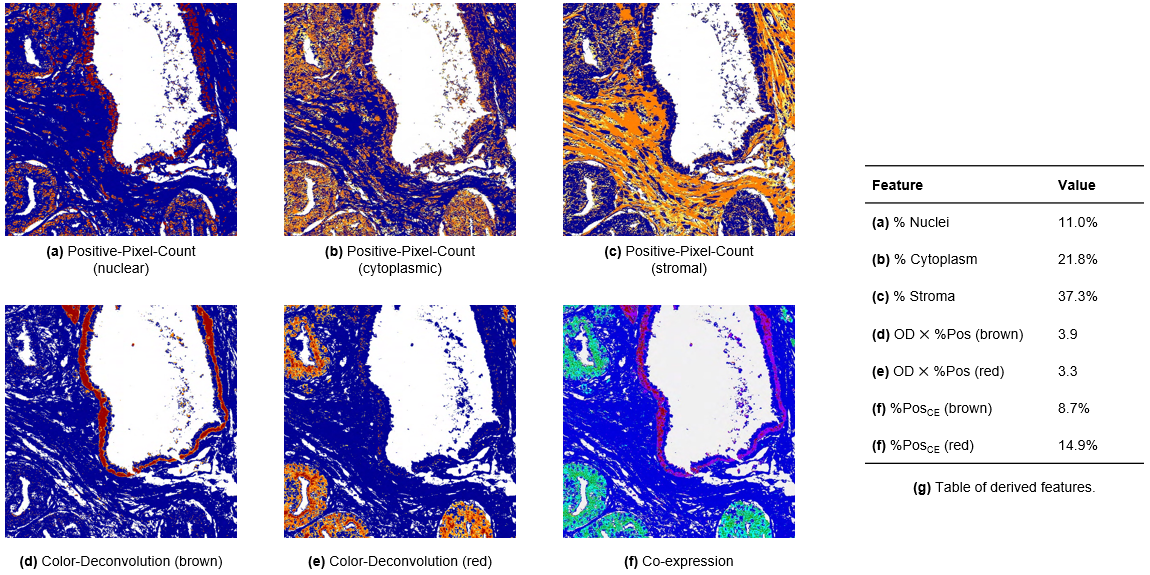
As previously described, each analysis square was analyzed with three image analysis algorithms (Aperio Brightfield Image Analysis Toolbox).7 In summary:
- The Positive-Pixel-Count algorithm was applied to the H&E slide to quantify the percentages of nuclei, epithelium, and stroma (Fig. 1a-c).
- The Color-Deconvolution algorithm was applied to the IHC slide to quantify the intensity of brown and red staining, corresponding to HMWCK+p63 and AMACR, respectively (Fig. 1d-e).
- The Co-expression algorithm was applied to the IHC slide to quantify the percentages of brown and red staining (Fig. 1f).
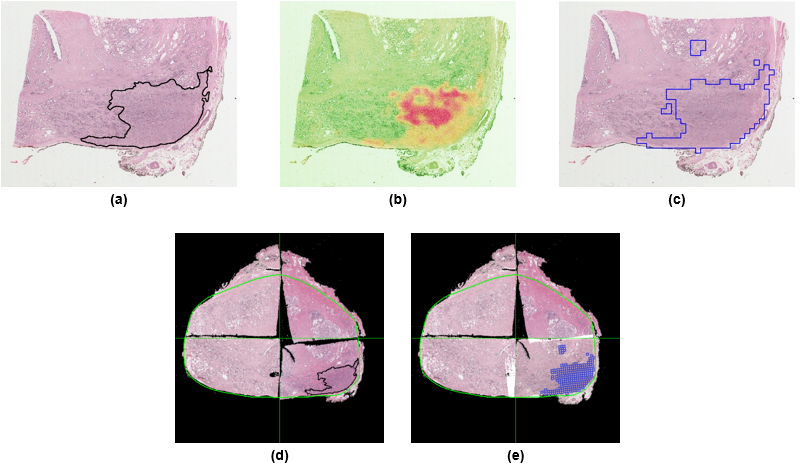
These seven outputs were then input into a fitted regression model, which output the predicted percentage of malignant epithelium in each analysis square. Thresholding this output produced maps of automatically-annotated cancer for each slide, and this new ground truth (Tn) was used to replace the manually-annotated cancer for the PWMs (Fig. 2a-c); the other 85 slides not in Ssc, which contained very little pathologist-identified cancer, were left unmodified (Fig. 2d-e).
A
previously-described Bayesian predictive model was trained using To and Tn. Briefly, it models
four quantitative mpMRI parameters (ADC, Ktrans, kep,
AUGC90) and cancer likelihood at each voxel as conditional on its 2D spatial
location (quantified by its xy-coordinates relative
to the prostate extent), and calculates cancer likelihood using the Bayesian
posterior probability.4 A patient-based leave-one-out
cross-validation scheme was used for training, with performance quantified by area under ROC curve (AUC).
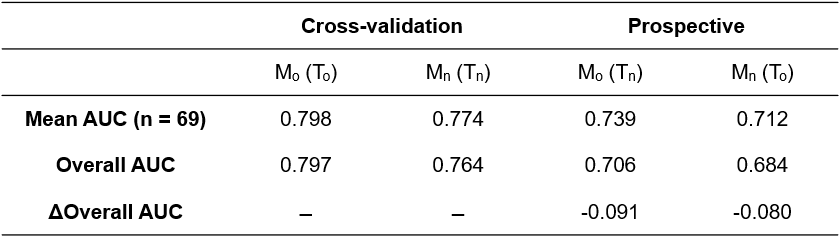
After training, the model trained on To (Mo) was then applied to Ssc of Tn. Since this data was unseen to Mo during training, this procedure quantifies the performance of Mo when used prospectively. Similarly, the model trained on Tn (Mn) was then applied to Ssc of To.
Results and Discussion
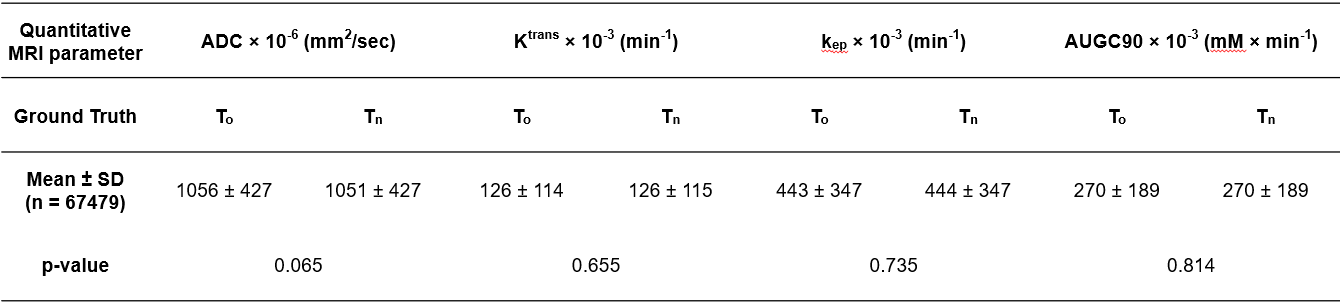
Table 2 summarizes the mean quantitative mpMRI parameter values for To and Tn, which were found to be not significantly different between them. Table 3 summarizes the cross-validation performance of Mo and Mn, and their performance when applied prospectively to the Ssc of Tn and To, respectively.
Notably, the overall test performances are roughly equal. Also, while test performance is predictably worse than cross-validation performance for both Mo and Mn, the decreases in performance are roughly equal. Additionally, the AUCs across the 69 slices of Ssc were found to be not significantly different between Mo and Mn when both were applied prospectively (p=0.417 by paired t-test).
As differences in AUC should only be interpreted as differences in goodness of fit, we cannot quantitatively conclude whether To and Tn are equally accurate. However, these results suggest that To and Tn are largely equivalent or interchangeable, which supports the validity of our approach for automatic annotation of PCa that addresses the major roadblock in obtaining the ground truth from RP specimens.
Acknowledgements
This work was supported in part by the National Institutes of Health (R01-CA1155268, P41-EB015894, T32-GM008244), Department of Defense (W81XWH-15-1-0477), and the University of Minnesota Graduate School Doctoral Dissertation Fellowship.References
1. Metzger GJ, Kalavagunta C, Spilseth B, Bolan PJ, Li X, Hutter D, Nam JW, Johnson AD, Henriksen JC, Moench L, Konety B, Warlick CA, Schmechel SC, Koopmeiners JS. Detection of Prostate Cancer: Quantitative Multiparametric MR Imaging Models Developed Using Registered Correlative Histopathology. Radiology. 2016;279(3):805-16.
2. Litjens G, Debats O, Barentsz J, Karssemeijer N, Huisman H. Computer-aided detection of prostate cancer in MRI. IEEE Trans Med Imaging. 2014;33(5):1083-92.
3. Wibmer A, Hricak H, Gondo T, Matsumoto K, Veeraraghavan H, Fehr D, Zheng J, Goldman D, Moskowitz C, Fine SW, Reuter VE, Eastham J, Sala E, Vargas HA. Haralick texture analysis of prostate MRI: utility for differentiating non-cancerous prostate from prostate cancer and differentiating prostate cancers with different Gleason scores. European radiology. 2015;25(10):2840-50.
4. Jin J, Zhang L, Leng E, Metzger GJ, Koopmeiners JS. Detection of prostate cancer with multiparametric MRI utilizing the anatomic structure of the prostate. Statistics in Medicine. 2018;37(22):3214-29.
5. Allam CK, Bostwick DG, Hayes JA, Upton MP, Wade GG, Domanowski GF, Klein MA, Boling EA, Stilmant MM. Interobserver variability in the diagnosis of high-grade prostatic intraepithelial neoplasia and adenocarcinoma. Mod Pathol. 1996;9(7):742-51.
6. Montironi R, Mazzuccheli R, Scarpelli M, Lopez-Beltran A, Fellegara G, Algaba F. Gleason grading of prostate cancer in needle biopsies or radical prostatectomy specimens: contemporary approach, current clinical significance and sources of pathology discrepancies. BJU international. 2005;95(8):1146-52.
7. Leng E, Henriksen J, Jin J, Koopmeiners JS, Schmechel SC, Metzger GJ. Colorimetric image analysis of H&E and IHC slides for automated pathologic annotation of prostate cancer. ISMRM Workshop on Advanced in Multiscale Cancer Detection: From Micro to Macro; Dublin, Ireland. 2018.
8. Kalavagunta C, Zhou X, Schmechel SC, Metzger GJ. Registration of in vivo prostate MRI and pseudo-whole mount histology using Local Affine Transformations guided by Internal Structures (LATIS). Journal of magnetic resonance imaging: JMRI. 2015;41(4):1104-14.
9. Herawi M, Epstein JI. Immunohistochemical antibody cocktail staining (p63/HMWCK/AMACR) of ductal adenocarcinoma and Gleason pattern 4 cribriform and noncribriform acinar adenocarcinomas of the prostate. The American journal of surgical pathology. 2007;31(6):889-94.
10. Metzger GJ, Dankbar SC, Henriksen J, Rizzardi AE, Rosener NK, Schmechel SC. Development of multigene expression signature maps at the protein level from digitized immunohistochemistry slides. PloS one. 2012;7(3):e33520.
Figures