0871
Deep Learning Based on MR Imaging for Differentiation of Low and High Fuhrman Grade Renal Cell Carcinoma1University of Pennsylvania, Philadelphia, PA, United States, 2The Second Xiangya Hospital of Central South University, Changsha, China
Synopsis
The inability to determine
aggressiveness of RCC based on pretreatment imaging makes it challenging for
physicians to select best benefit treatment. We aimed to
differentiate low grade (Fuhrman I–II) from high grade (Fuhrman III–IV) RCC
using a deep learning model based on routine MR imaging. 297 patients with 300 RCC lesions in a multicenter cohort were included.
A residual convolutional neural network model combining MR images and three
clinical variables was built, which demonstrated high accuracy when compared to
expert evaluation. Deep learning can non-invasively predict Fuhrman grade of
RCC using conventional MR imaging in a multi-institutional dataset.
INTRODUCTION
Pre-treatment determination of RCC Fuhrman grade noninvasively is challenging but important for clinical decision making. Fuhrmann grade has been shown to be a predictor of survival in RCC patients.1 Recently, several studies have developed predictive models of Fuhrman grade using CT-based radiomics on RCC with promising results.2,3 Deep learning, a type of machine learning technique, has already led to breakthroughs in predicting molecular biomarkers and disease outcomes in other organ systems.4,5 The purpose of the current study was to apply a deep learning-based approach based on routine MR images to differentiate low from high Fuhrman grade RCCs in a multicenter cohort.METHODS
Patient cohort
Our final cohort consisted of 297 patients with 300 RCC lesions. 235 lesions from one large academic center in the United States (HUP), 39 lesions from The Cancer Imaging Archive (TCIA), 11 lesions and 15 lesions from two hospitals in People’s Republic of China (SXH and PHH). The RCC lesions were grouped into low grade (grade I and II) and high grade (grade III and IV).
Expert evaluation
Two experts, with 23 and 12 years of experience of reading body MR respectively, independently reviewed the T2 and T1C images and graded the total cohort. Three more experts, with 13, 10 and 10 years of experience of reading body MR respectively, independently reviewed the renal tumors in the test set.
Tumor segmentation
MR images of all patients were loaded into 3D Slicer software (v4.6), 3D regions of interest were manually drawn slice-by-slice on the T2 and T1C sequences by an abdominal radiologist.6
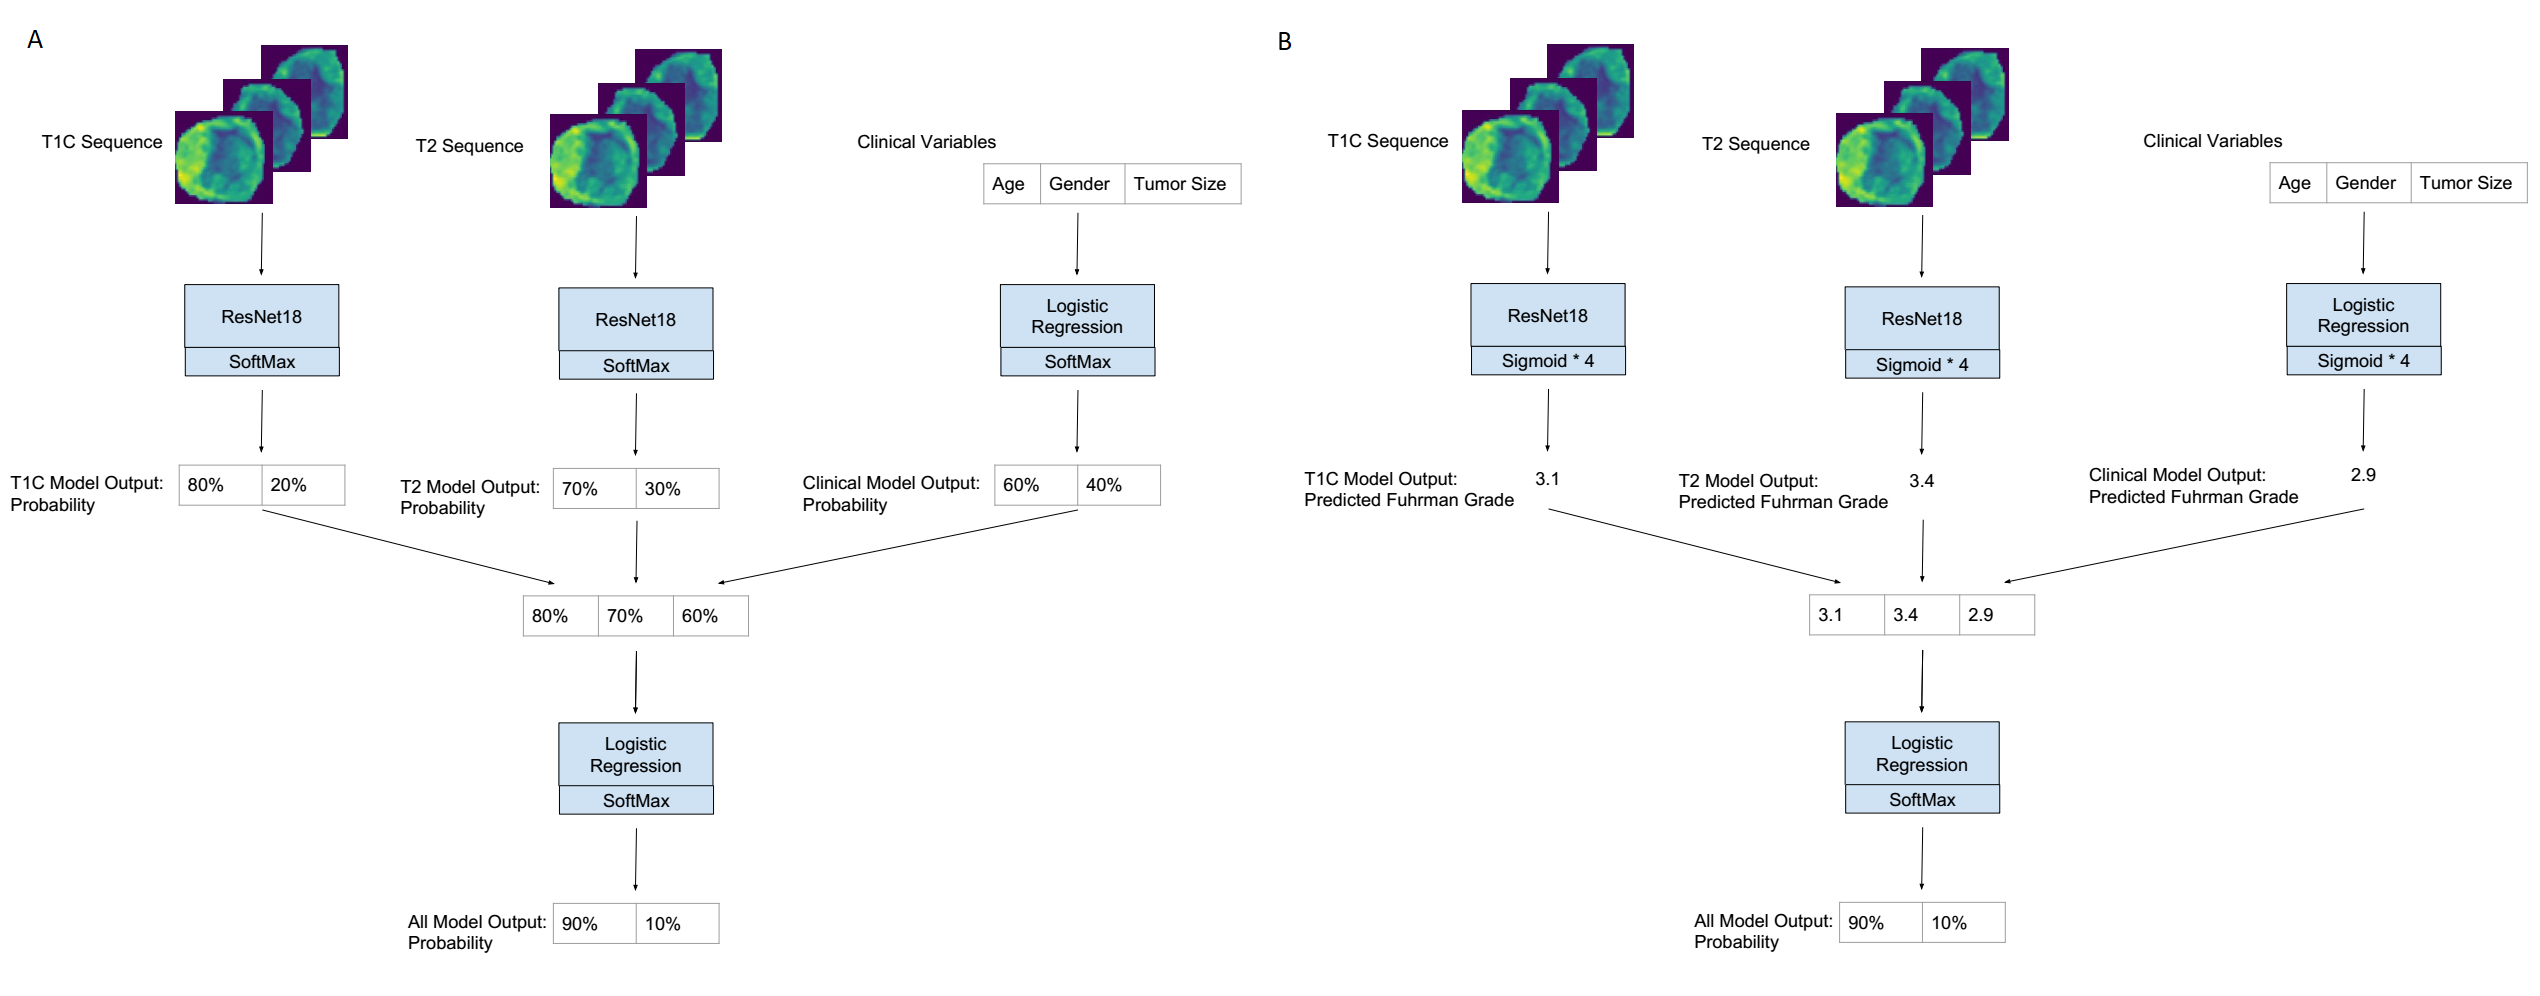
Model and Training
Our neural network model was based on the ResNet18 architecture with stochastic weights.7 A logistic regression model was used to predict Fuhrman grade from age, gender, and tumor size (clinical variables). The Resnet18 architecture was used to predict Fuhrman grade from T1C and T2 sequences (T1C and T2 models). These models were all bagged to form a final classifier by two versions of strategies (bagged probabilities and bagged regression). An illustration of our pipeline is shown in Figure. 1. Our data were partitioned into training, validation, and testing sets in a ratio of 7:2:1.
Statistical analysis
The
ROC curve and Precision-Recall curve were plotted
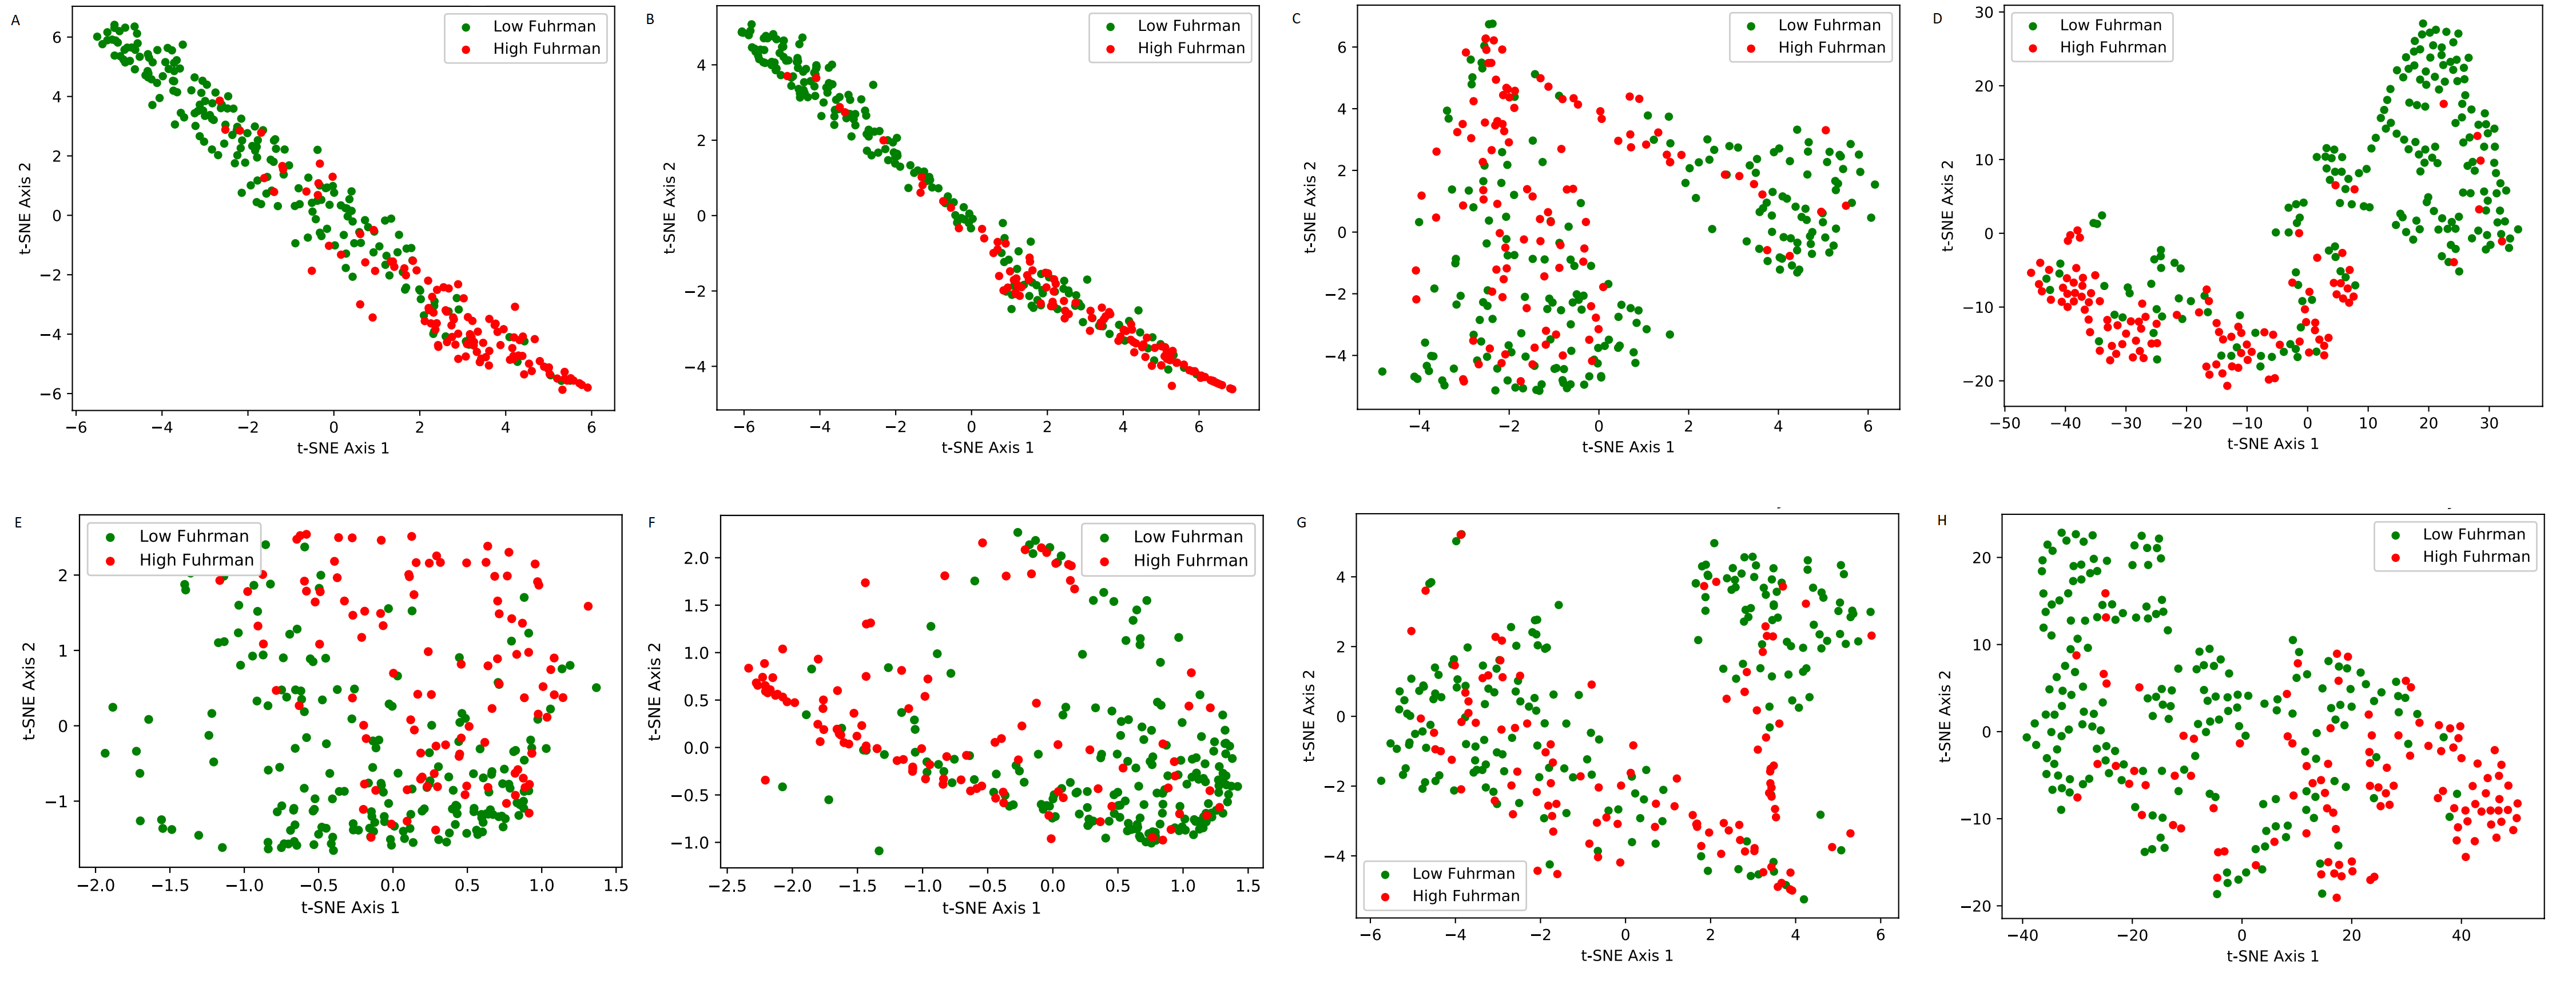
to measure the performance of the binary classifier. T-distributed Stochastic
Neighbor Embedding (t-SNE) was used to visualize high-level representations and
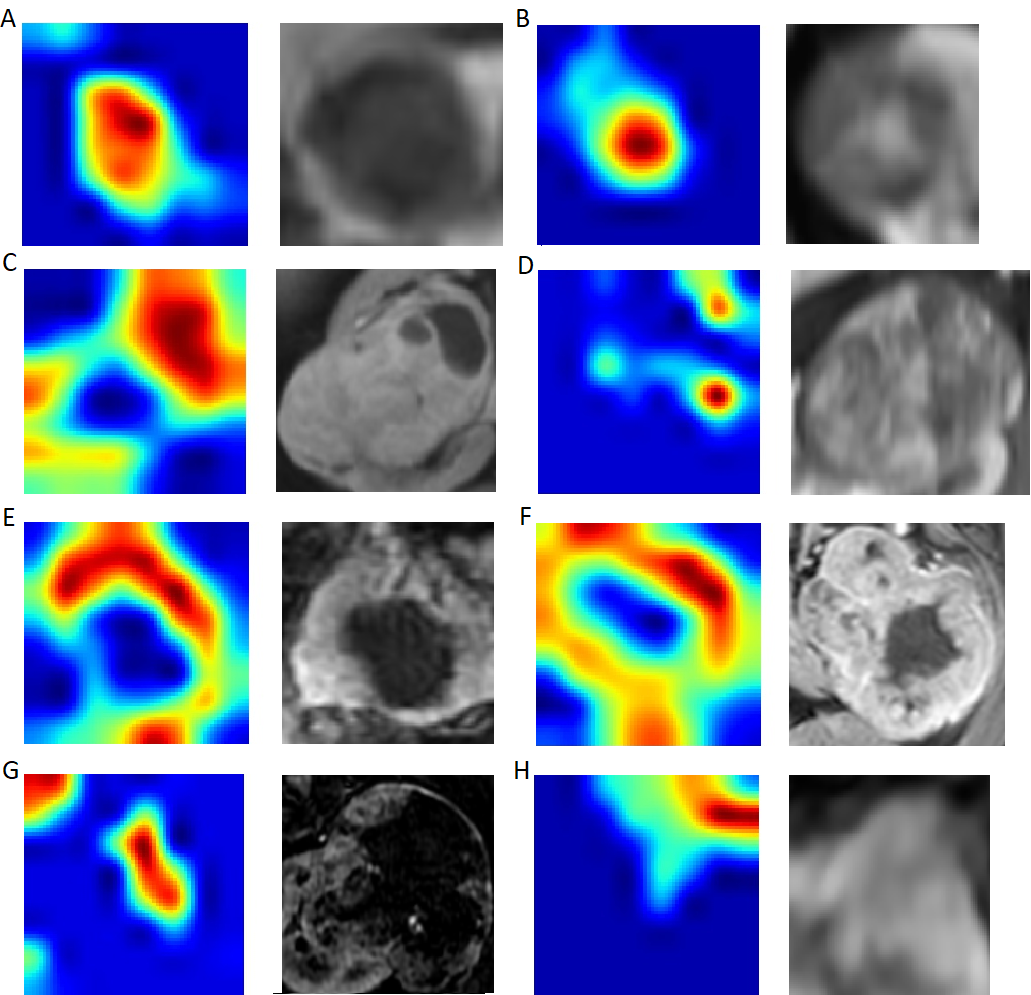
clustering learned by the model network.8 GradCam heatmaps
were plotted to demonstrate the attention the model paid to parts of the image
in order to make a decision.9
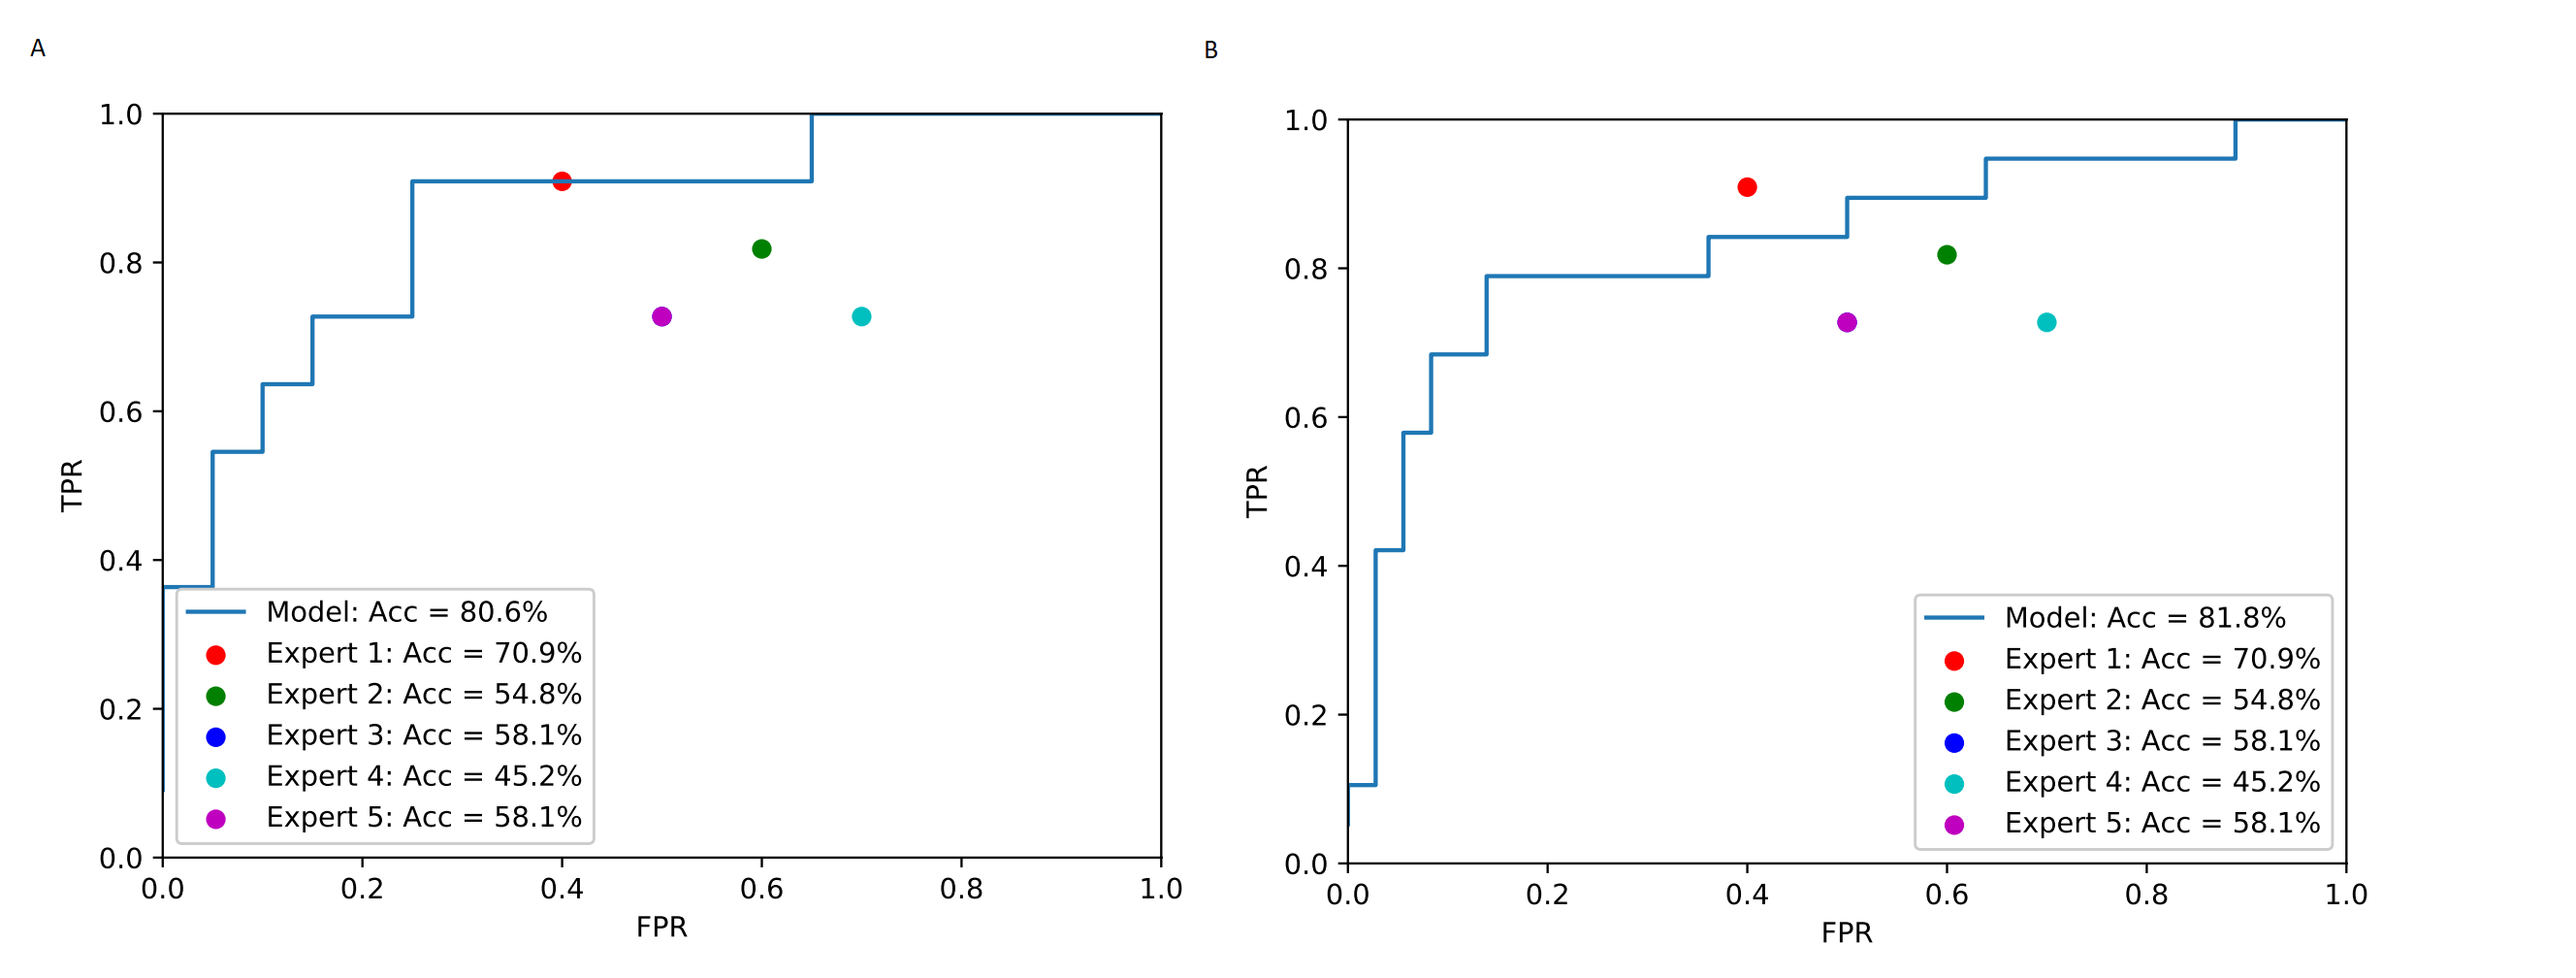
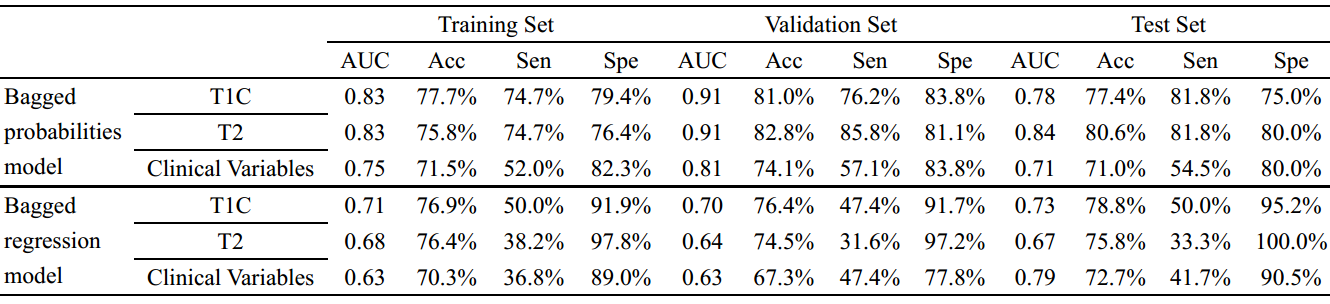
RESULTS
Among the 300 RCC lesions, 107 were high Fuhrman grade tumors and 193 were low Fuhrman grade tumors. Our bagged probabilities model achieved accuracies of 78.7% (AUC = 0.86), 84.4% (AUC = 0.93), and 80.6% (AUC = 0.86) in training, validation and test sets. Our bagged regression model achieved accuracies of 82.1% (AUC = 0.89), 81.8% (AUC = 0.83), and 81.8% (AUC = 0.75) in training, validation and test sets. In comparison, expert 1 achieved accuracy of 60.7% (AUC = 0.63) with 70.1% sensitivity and 55.4% specificity, and expert 2 achieved accuracy of 55.7% (AUC = 0.57) with 62.8% sensitivity and 51.8% specificity. The performance of deep learning models compared with the five experts on the test set was plotted in Figure 2. The individual performance of T1C, T2 sequences and clinical variables in training, validation and test sets are shown in Figure3. The t-SNE representation of the final dense layer of ResNet demonstrated good separation of low and high Fuhrman grade by the model (Fig. 4). Representative images of the GradCam heatmaps identifying the focus of interest by the model for both correctly classified and incorrectly classified tumors on T1C images are shown in Figure 5.DISCUSSION
In this study, the residual convolutional neural network model combining MR sequences (T2W, T1C) and three clinical variables (age, gender and tumor size) achieved high accuracy in differentiating low from high Fuhrman grade RCCs. Our model was based on the ResNet18 architecture, which has been shown to decrease overfitting and address vanishing gradients of deep neural nets. Augmentation technique was used in our training set, which allows further increase in the size of the cohort and prevent overfitting. Blind evaluation of the tumors in the test set by five experts demonstrated consistency among the experts. GradCam heatmaps suggest that for incorrectly classified tumors, the focus of the deep learning model may not be on the enhancing portion of the tumor.
CONCLUSION
If further validated, our model can help guide management in a clinical setting, and better triage patients for active surveillance versus treatment with ablation or resection.Acknowledgements
This study was supported by RSNA fellow research grant (RF1802), National Natural Science Foundation of China (8181101287) and SIR Foundation Radiology Resident Research Grant to HXB.
References
1. Novara G, Martignoni G, Artibani W, et al. Grading Systems in Renal Cell Carcinoma. Journal of Urology. 2007;177(2):430-436.
2. Ding J, Xing Z, Jiang Z, et al. CT-based radiomic model predicts high grade of clear cell renal cell carcinoma. European Journal of Radiology. 2018;103:51-56.
3. Hannu H, Darryl H, Steven C, et al. CT prediction of the Fuhrman grade of clear cell renal cell carcinoma (RCC): towards the development of computer-assisted diagnostic method. Abdominal Imaging. 2015;40(8):3168-3174.
4. Chang K, Bai HX, Zhou H, et al. Residual Convolutional Neural Network for Determination of IDH Status in Low- and High-grade Gliomas from MR Imaging. Clinical Cancer Research An Official Journal of the American Association for Cancer Research. 2017;34(34):2236.2017.
5. Zhou H, Vallières M, Bai HX, et al. MRI features predict survival and molecular markers in diffuse lower-grade gliomas. Neuro Oncol. 2017;19(6):862-870.
6. Fedorov A, Beichel R, Kalpathy-Cramer J, et al. 3D SLICER as an image computing platform for the quantitative imaging network. Magnetic Resonance Imaging. 2012;30(9):1323-1341.
7. Huang G, Sun Y, Liu Z, et al. Deep Networks with Stochastic Depth. 2016:646-661.
8. Maaten LVD, Hinton G. Visualizing Data using t-SNE. Journal of Machine Learning Research. 2008;9(2605):2579-2605.
9. Selvaraju RR, Cogswell M, Das A, et al., editors. Grad-CAM: Visual Explanations from Deep Networks via Gradient-Based Localization. IEEE International Conference on Computer Vision; 2017.
Figures