0869
Differential Diagnosis Between Normal Marrow and Metastasis of Pelvic Bones Using Relaxation Maps from Synthetic MRIYadong Cui1,2, Yue Lin1,2, Chunmei Li1, Jianxun Qu3, Bing Wu3, and Min Chen1,2
1Department of Radiology, Beijing Hospital, National Center of Gerontology, Beijing, China, 2Graduate School of Peking Union Medical College, Beijing, China, 3GE Healthcare, Beijing, China
Synopsis
Synthetic MRI enables quantification of T1, T2 and proton density (PD) value. The purpose of our study was to assess the feasibility for distinguishing bone metastasis from normal marrow with synthetic MRI. Our study found that T1 value of metastasis was significantly higher than those of red and yellow marrow. The T2 value of metastasis was significantly lower than those of red and yellow marrow. We concluded that synthetic MRI could be used for differentiating bone metastasis from normal marrow.
Purpose
The coexistence of yellow marrow and red marrow in medullary cavity may induce the heterogenous appearance in conventional contrast weighted images, which might complicate the detection of bone metastasis featuring similar non-uniform signal intensity 1. Characterization of bone marrow with MRI remains limited. Synthetic MRI, capable of quantifying multiple relaxation parameters accurately and efficiently, is a promising candidate for differentiating tissues based on quantitative properties 2. The study aims to assess the feasibility for distinguishing normal marrow from bone metastasis by synthetic MRI.Methods and materials
A total of 26 patients were enrolled in the study. Local ethical approval and consent forms were obtained. Four patients were diagnosed as prostate cancer and presented pelvic bone metastasis as confirmed by DWI images. The other twenty-two patients without prostate cancer also showed heterogeneous appearance of the pelvic bone marrow on T1 weighted (T1w) and T2 weighted (T2w) images. All the participants underwent MR exam that consisted of routine sequences and synthetic MR (MAGnetic resonance Imaging Compilation, MAGiC) on a 3.0T whole body MR system (Pioneer, GE Healthcare). MAGiC was acquired with FOV 300mm*300mm, matrix 320*256, and slice thickness/gap 4/1mm. The quantitative maps of T1, T2, and PD were generated from the console. Eleven ROIs of metastasis were placed on regions presenting high signal intensity in DWI images in prostate cancer patients; nineteen ROIs were placed on regions of yellow marrow and red marrow on the other patients. Yellow marrow was identified as hyperintensity (similar to subcutaneous fat) in femoral head on T1w and T2w images and red marrow was detected as intermediate signal intensity on T1w and T2w in pelvic bones (Figure 1). Statistical analysis was performed using SPSS 20.0 (IBM Corp, NY, USA). T1, T2 and PD value of metastasis, red marrow and yellow marrow were compared by one-way analysis of variance (ANOVA) test.Results
The T1 value of metastasis (1325.90 ± 219.05 ms) was significantly higher than those of red marrow (610.89±86.48 ms, p < 0.001) and yellow marrow (458.05 ± 25.4 ms, p < 0.001) (Figure.2a). The T2 value of metastasis (77.36 ± 5.87 ms) was significantly lower than those of red marrow (101.47 ± 19.89 ms, p < 0.001) and yellow marrow (157.74 ± 29.15 ms, p < 0.001) (Figure.2b). PD value of metastasis (70.18 ± 9.76 pu) was significantly lower than red marrow (81.29 ± 13.33 pu, p < 0.05). But there was no difference of PD between metastasis and yellow marrow (p = 0.089). Red marrow and yellow marrow present significant different T1 and T2 values (p < 0.001). But there was no significant difference of PD value between red and yellow marrow (p = 0.996) (Figure 2).Discussion and Conclusion
This study explored the feasibility of differentiating yellow marrow, red marrow, and metastasis with the quantitative relaxation maps from synthetic MRI. Significant differences in relaxation times were observed for yellow marrow, red marrow, and metastasis. In conventional contrast-weighted images, red marrow and metastasis might present similar intensity and therefore complicate the detection of metastasis. Our study first found that quantification of T1, T2 and PD value by synthetic MRI is helpful for differentiating red and yellow marrow from bone metastasis. Future studies with larger patient group size are needed to further validate the full potential of synthetic MR in characterizing bone marrow.Acknowledgements
No acknowledgement found.References
- Dawson KL, Moore SG, Rowland JM. Age-related marrow changes in the pelvis: MR and anatomic findings. Radiology 1992;183(1):47-51.
- Elias EJ, Liao JH, Jara H, et al. Quantitative MRI analysis of craniofacial bone marrow in patients with sickle cell disease. AJNR Am J Neuroradiol 2013;34(3):622-627.
Figures

Figure 1. Representative images of T2w, T1 map, T2 map, PD map and diffusion
weighted images (from left to right) of pelvic bone metastasis (A), red marrow (B)
and, yellow marrow (C) respectively. The metastasis and red marrow both show relatively
low signal intensity compare to the subcutaneous fat on T2w images. However, the
quantitative T1 value of metastasis is higher than those of red and yellow marrow. The T2 value of metastasis is lower than those
of red and yellow marrow. The PD value of metastasis
is lower than that of red marrow.
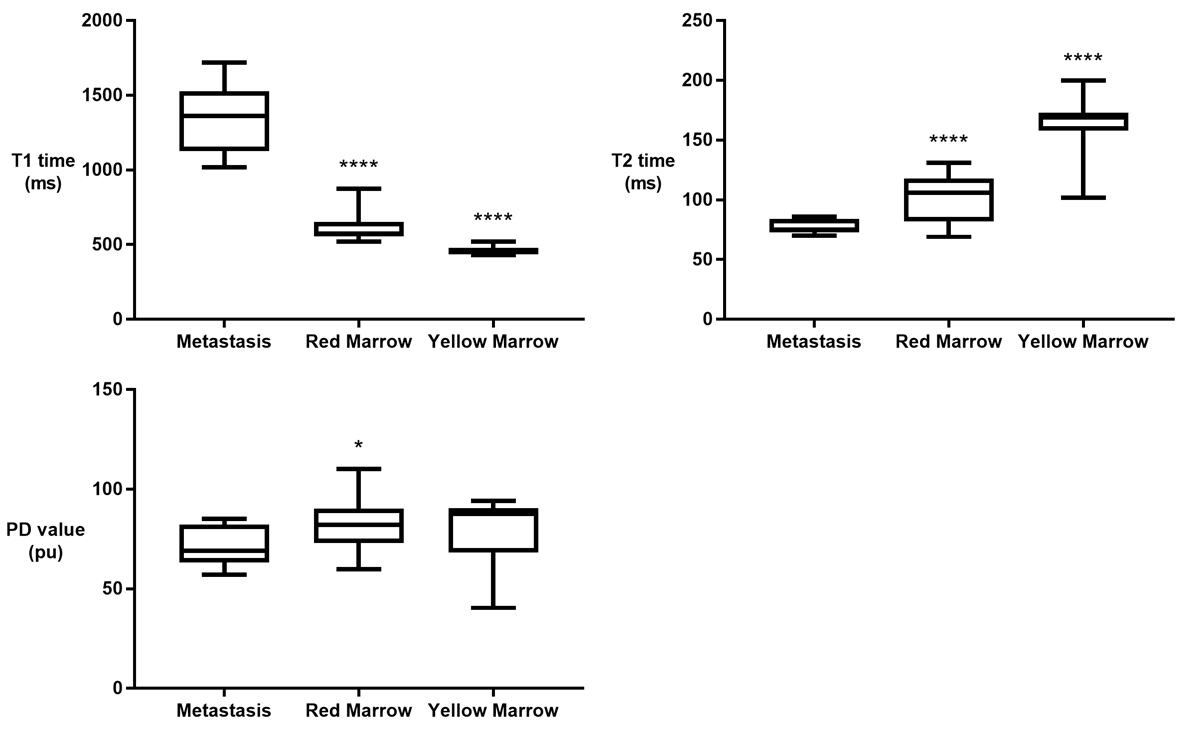
Figure 2. The
T1 value of metastasis is significantly higher than red and yellow marrow. The T2
value of metastasis is significantly lower than red and yellow marrow. The PD
value of metastasis is significantly lower than red marrow.
(Compared
with metastasis: *p<0.05; **p<0.01; ***p<0.005; ****p<0.001.)