0868
[18F]-NaF PET-MR Imaging Reveals Bone-Cartilage Interactions in Hip Osteoarthritis1Radiology and Biomedical Imaging, University of California San Francisco, San Francisco, CA, United States
Synopsis
In Osteoarthritis (OA), degeneration of articular cartilage can be accompanied by changes in bone structure. In this study, we analyzed the distribution of [18F]-NaF uptake and blood flow in the femur and acetabulum in 10 hip OA patients and studied associations between bone remodeling and cartilage composition in the presence of morphological abnormalities using PET-MR, quantitative MR and femur shape modeling. Our results showed associations of Standardized Uptake Values (SUV), blood flow to bone (Kpat) with patient reported pain, when different bone shapes like shaft thickness and coxa valga were taken into account.
Introduction
Osteoarthritis (OA) is a debilitating joint disease with a multi-factorial etiology including joint injury, aging, obesity, and hereditary factors1. While degenerative cartilage changes have been implicated in the development of OA, previous research suggests that bone changes can play a role in OA progression, leading to a need for understanding the cross-talk between bone-cartilage2. This study aims to characterize the distribution of [18F]-NaF uptake and blood flow in the femur and acetabulum in hip OA patients and study associations between bone remodeling and cartilage composition in the presence of morphological abnormalities using PET-MR, quantitative MR and femur shape modeling.
Methods
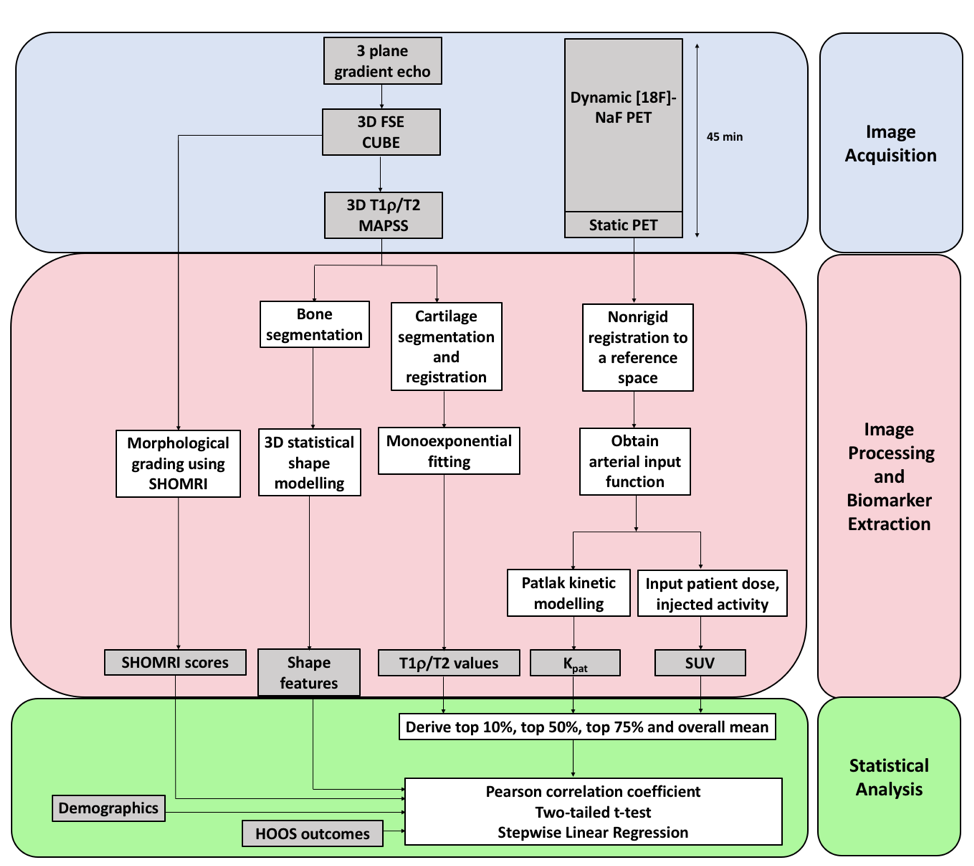
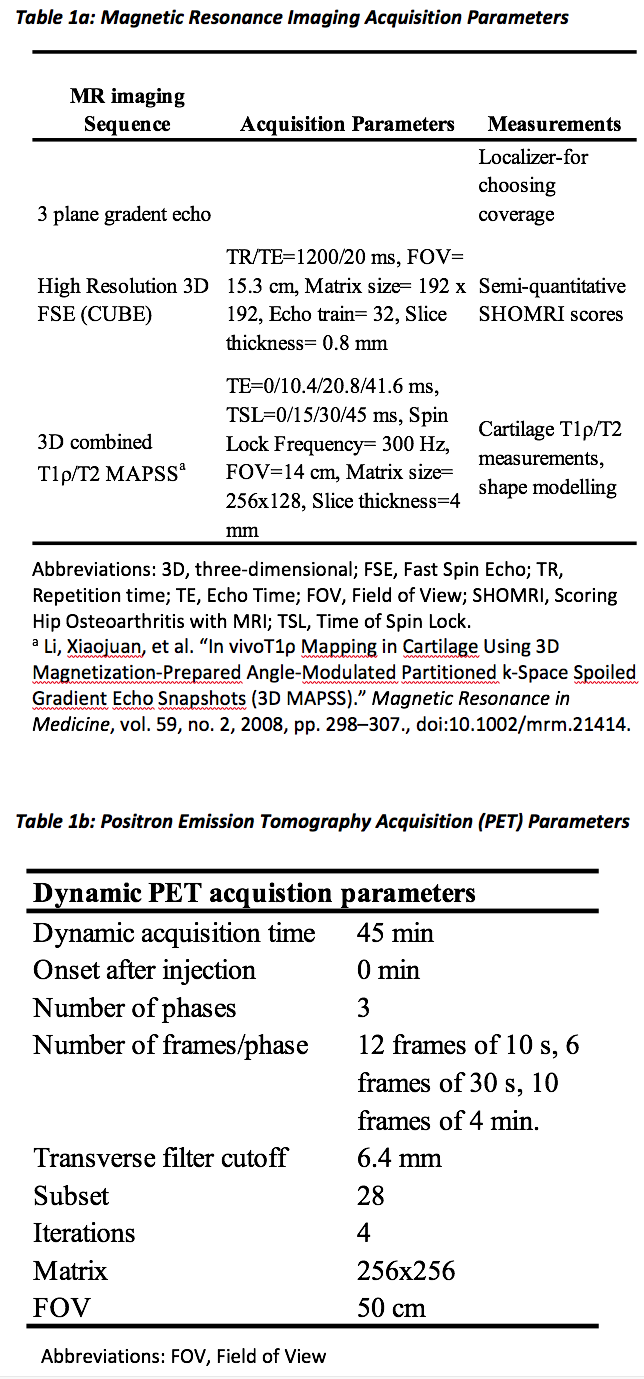
10 subjects with radiographic or symptomatic OA were recruited for this study (age 56.90±12.53 years, BMI 29.00±5.29 Kg/m3, 8 males, 2 (20%) Kellgren-Lawrence (KL) 0, 8 (80%) (KL) 1-2. Subjects were prepared with an intravenous catheter and positioned supine feet first, with a large receiver flex coil wrapped around the hip of interest, into a 3T TOF PET-MR scanner (GE Healthcare, Waukesha, WI). Subjects were injected with an average of 247.97 MBq [18F]-NaF for a 45 min dynamic PET scan. A Dixon fat-water sequence was acquired for MR-based attenuation correction (MRAC) of PET photons3. The MR images acquired simultaneously with PET included: (1) 3D high resolution isotropic CUBE FSE, and (2) 3D sagittal combined T1ρ/T2. The morphological abnormalities were graded by a trained radiologist using the SHOMRI system4. MR and PET acquisition parameters can be seen in Table 1. All image analysis was performed using an in-house program developed in MATLAB (Mathworks, Natick, MA). An overview of the entire methods process is contained in Figure 1. The 3D shape analysis and qMRI quantification were performed as previously described5,6,7. The arterial input function (AIF) was measured by automatically isolating the signal of femoral artery on the PET data. The static PET data was converted to standardized uptake value (SUV) using the injected dose and patient weight. A one compartment Patlak kinetic tracer model was used to determine the rate of net influx (Kpat) of the [18F]-NaF tracer after 15 mins (so the tracer is well-mixed within the plasma) in the femur and acetabulum using the dynamic data8. Pearson correlation coefficients were calculated to assess the associations between different parameters. A Stepwise Linear Regression was used to study the associations between the bone shapes and the PET parameters.
Results
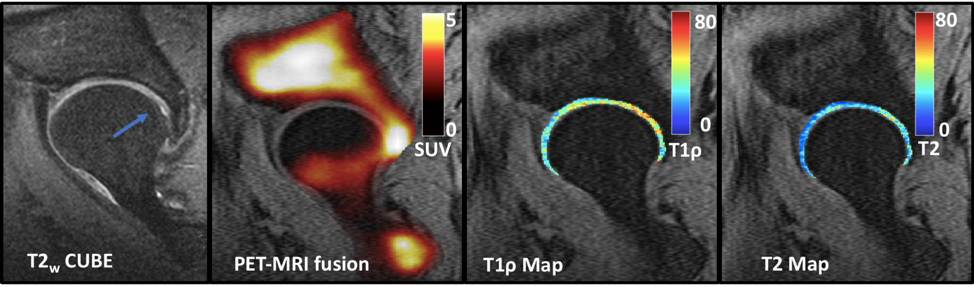
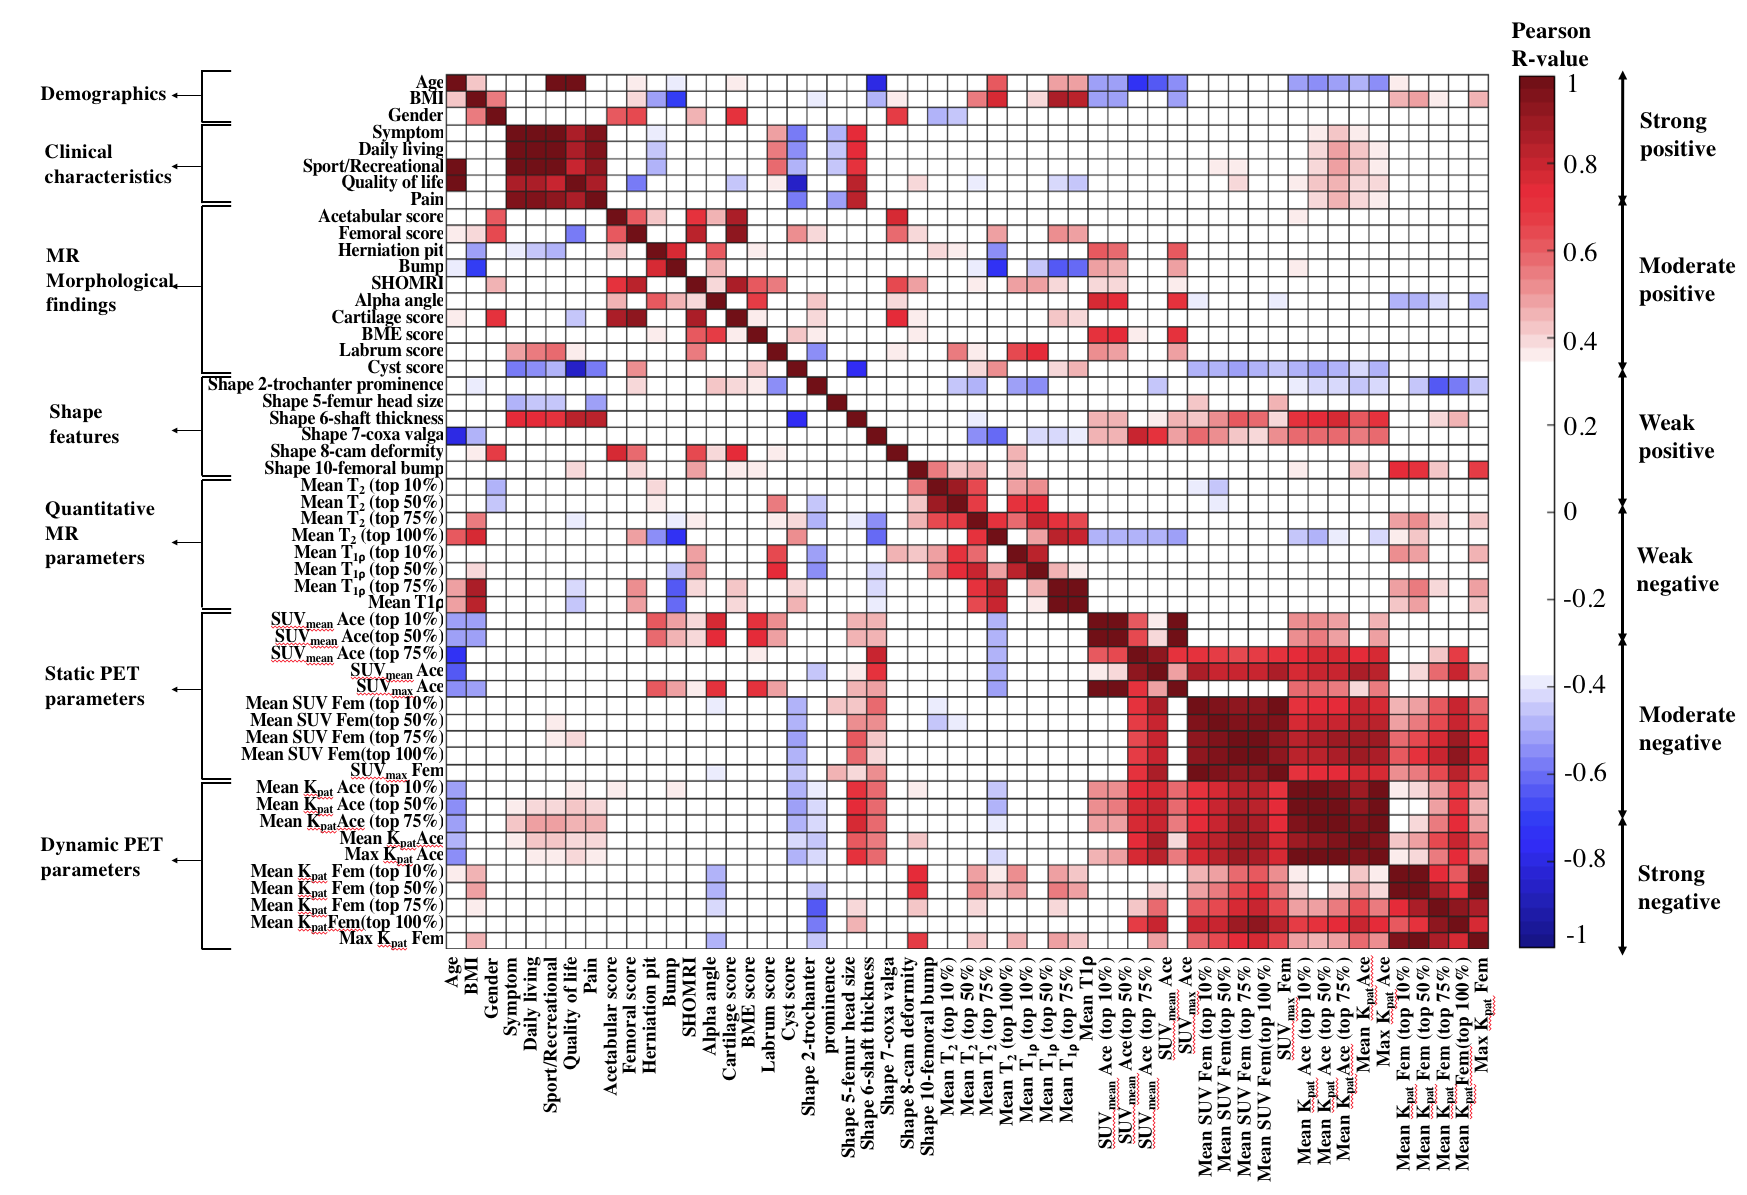
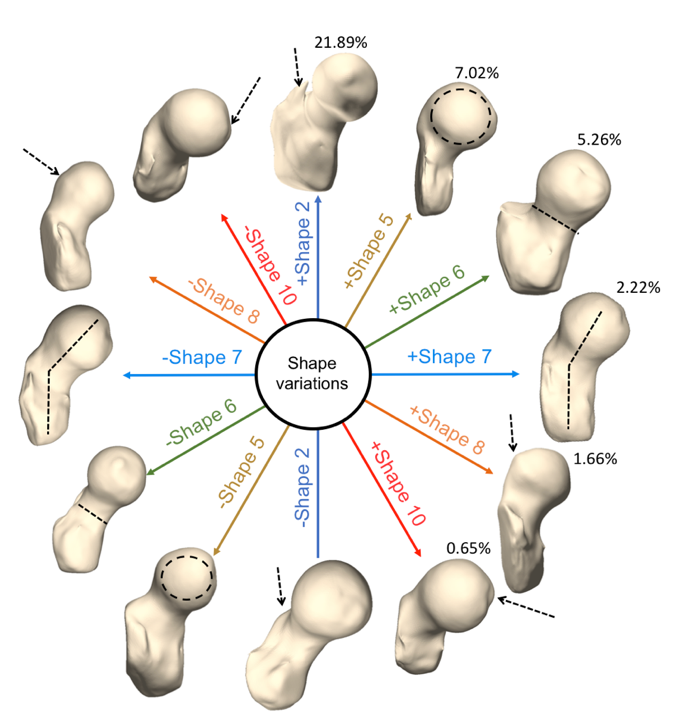
A case wise analysis showed inconsistencies in correspondences between presence of morphological abnormalities and tracer uptake, as seen in previous studies9,10,11,12. For example, Figure 2 shows a patient with a very high peak of SUV in the posterior part of the hip near the severe cartilage lesion (blue arrow). Adjacent to this region of elevated SUV, elevated T1ρ and T2 values are seen. There is also tracer uptake in the anterior part of the femoral head, which does not seem to correspond to any pathology. Figure 3 shows the correlation heat map between all the parameters. Bone Marrow Edema (BME) scores had a high correlation with SUVmax in the acetabulum (R=0.70), but not in the femur (R=-0.14). The correlation between BME score and SUVmax in the acetabulum was further improved when corrected for by age (R=0.79). Figure 4 shows the derived shape variations in the dataset. Coxa valga showed a high correlation with SUVmean in the acetabulum (R=0.70) and age (R=-0.79), but a weak association with SUVmean in the femur (R=0.38). The shaft thickness showed a strong correlation with Kpat in the acetabulum (R=0.70) and moderate correlation with SUVmean in the femur (R=0.59). The correlation between SUVmean and pain increased when shaft thickness was taken into account (R value in acetabulum 0.12 to -0.50, R value in femur 0.01 to -0.56). The Stepwise Linear Regression results showed that the trochanter prominence and coxa valga were predictors of the SUVmean (p=0.007) whereas shaft thickness, coxa valga and osteophytic growth were predictors of the maximum Kpat (p=0.0033) in the acetabulum.Discussion and Conclusion
This study demonstrated the ability of [18F]-NaF PET-MRI, 3D Statistical Shape Modeling and quantitative compositional MRI to investigate cartilage-bone interactions along with bone shape features in osteoarthritis. Overall, the acetabulum showed stronger correlations with different PET and MR parameters. Pain scores were found to be correlated to different femur bone shapes, and taking the shapes into account resulted in correlations between pain and PET parameters. The results support the complex interactions between joint loading, biochemistry and tissue degeneration that occur before and during OA, and lead to the potential to develop directed interventions using these tools.Acknowledgements
Financial support: This project was supported by a grant from GE Healthcare and NIH-NIAMS grant R01AR069006 (SM/RS).References
1. Chen, Di, et al. “Osteoarthritis: toward a Comprehensive Understanding of Pathological Mechanism.” Bone Research, vol. 5, 2017.
2. Pedoia, Valentina, et al. “Study of the Interactions between Proximal Femur 3d Bone Shape, Cartilage Health, and Biomechanics in Patients with Hip Osteoarthritis.” Journal of Orthopedic Research, Nov. 2017.
3. Wagenknecht, Gudrun, et al. “MRI for Attenuation Correction in PET: Methods and Challenges.” Magnetic Resonance Materials in Physics, Biology and Medicine, vol. 26, no. 1, 2012, pp. 99–113.
4. Lee, Sonia, et al. “Scoring Hip Osteoarthritis with MRI (SHOMRI): A Whole Joint Osteoarthritis Evaluation System.” Journal of Magnetic Resonance Imaging, vol. 41, no. 6, 2014.
5. Pedoia V, Lansdown DA, Zaid M, et al. 2015. Three-dimensional MRI-based statistical shape model and application to a cohort of knees with acute ACL injury. Osteoarthritis Cartilage.
6. Pedoia V, Su F, Amano K, et al. 2017. Analysis of the articular cartilage T1ρ and T2 relaxation times changes after ACL reconstruction in injured and contralateral knees and relationships with bone shape. J Orthop Res.
7. Inamdar, Gaurav, et al. “An MR Study of Longitudinal Variations in Proximal Femur 3D Morphological Shape and Associations with Cartilage Health in Hip Osteoarthritis.” Journal of Orthopaedic Research®, Sept. 2018.
8. Patlak, Clifford S., et al. “Graphical Evaluation of Blood-to-Brain Transfer Constants from Multiple-Time Uptake Data.” Journal of Cerebral Blood Flow & Metabolism, vol. 3, no. 1, 1983.
9. Savic, Dragana, et al. “Imaging Bone–Cartilage Interactions in Osteoarthritis Using [18F]-NaF PET-MRI.” Molecular Imaging, vol. 15, 2016.
10. Kogan, Feliks, et al. “PET/MRI of Metabolic Activity in Osteoarthritis: A Feasibility Study.” Journal of Magnetic Resonance Imaging, vol. 45, no. 6, 2016.
11. Dyke, Jonathan P., et al. “Characterization of Bone Perfusion by Dynamic Contrast-Enhanced Magnetic Resonance Imaging and Positron Emission Tomography in the Dunkin-Hartley Guinea Pig Model of Advanced Osteoarthritis.” Journal of Orthopaedic Research, vol. 33, no. 3, 2014, pp. 366–372.
12.Kobayashi, Naomi, et al. “Comparison of 18F-Fluoride Positron Emission Tomography and Magnetic Resonance Imaging in Evaluating Early-Stage Osteoarthritis of the Hip.” Nuclear Medicine Communications, vol. 36, no. 1, 2015, pp. 84–89.
Figures