0865
Assessment of an In Vitro Model of Rotator Cuff Tendinopathy Using 3D-UTE MRI Biomarkers with Biochemical and Histological Correlation1Department of Radiology, University of California, San Diego, San Diego, CA, United States, 2Department of Radiology, Beijing Hospital, Beijing, China, 3Radiology Service, VA San Diego Healthcare System, San Diego, CA, United States
Synopsis
Changes in extracellular matrix are seen in cuff tendinopathy, and in particular, alterations in collagen proportion and property are characteristic. Tendon contains an abundance of short T2 components that rapidly decay to background levels. Thus, UTE sequences are better suited for quantitative evaluation of tendon compared with standard clinical MR sequences. In this study, we assess the sensitivity of multiple UTE biomarkers for the evaluation of rotator cuff degeneration in a controlled laboratory experiment.
Introduction
Rotator cuff tendinopathy is a debilitating degenerative condition and one of the principal causes of chronic shoulder pain (1). Tendons can withstand high tensile loads because of their dense and highly ordered collagenous matrix (2). Changes in extracellular matrix (ECM) are seen in cuff tendinopathy, and in particular, alterations in collagen proportion and property are characteristic (3, 4). While clinical MRI is useful for assessment of gross tendon tearing, evaluation of collagen content and structure is challenging with standard sequences due to the short T2 relaxation of ECM (5). 3D-UTE sequences can be used to acquire signals from the ECM before decay to background levels and provide multiple potential magic-angle insensitive biomarkers for assessment of tendinopathy (6). However, the sensitivity of these measures to collagen degradation remains unknown. The aim of this study was to correlate 3D-UTE biomarkers with biochemical and histological reference standards in an in vitro model of tendon degeneration.Methods
30 pieces of supraspinatus tendon were harvested from 5 cadaveric specimens (2F, 3M; 52.8±10.5 years-old). The specimens were equally distributed into 3 groups: (1) digested with 600U of collagenase, (2) digested with 150U of collagenase, and (3) undigested control. For enzyme-treated samples, 100 ul of collagenase solution (VII C0773, Sigma-Aldrich, St. Louis, MO) was applied to all sides, while the controls were only treated with 100 ul of same buffer without collagenase. All samples were vacuum sealed and immediately scanned at baseline on a 3T scanner (MR750, GE Healthcare, Milwaukee, WI) using a homemade birdcage coil. All samples were incubated in 37℃ for 24h and subsequently scanned again, with careful positioning to ensure the same orientation. 3D-UTE sequences included T1, T1ρ and magnetization transfer (MT). The long-axis of the tendon was always scanned parallel to the B0 field. Sequence parameters included: FOV = 4×4×4.5 cm3, Matrix = 192×192×28, BW = 43.3 kHz, T1 with variable flip angles (FA = 5°, 10°, 20° and 30°, TR = 20 ms), adiabatic T1ρ with spin-lock time of 6, 12, 24, 36, 48, 72 and 96 ms, MT with three pulse powers of saturation (FA = 300°, 600°, and 900°) and five offset frequencies for each pulse power (Df = 2, 5, 10, 20 and 50 kHz). ROIs were drawn over the entire sample on the midportion image and T1, T1ρ and macromolecular fraction (MMF) were calculated as were the relative changes after digestion. One half of the sample was homogenized and washed with distilled water for biochemical analysis. The sedimentation containing the undigested collagen and supernatant containing the digested collagenous fragments were separated and quantified using a hydroxyproline (HYP) colorimetric assay kit (K555-100, BioSivion, Milpitas, CA). The percentage of digested collagen was defined as . The other half of the sample was fixed in 10% zinc formalin, dehydrated with alcohol, paraffin embedded, and sectioned. Staining was performed using H&E and Col-F Collagen Binding Reagent (ImmunoChemistry Technologies, Bloomington, MN), which is a fluorescence stain with affinity for collagen and elastin. Statistical analysis was performed using one-way ANOVA and correlations.Results
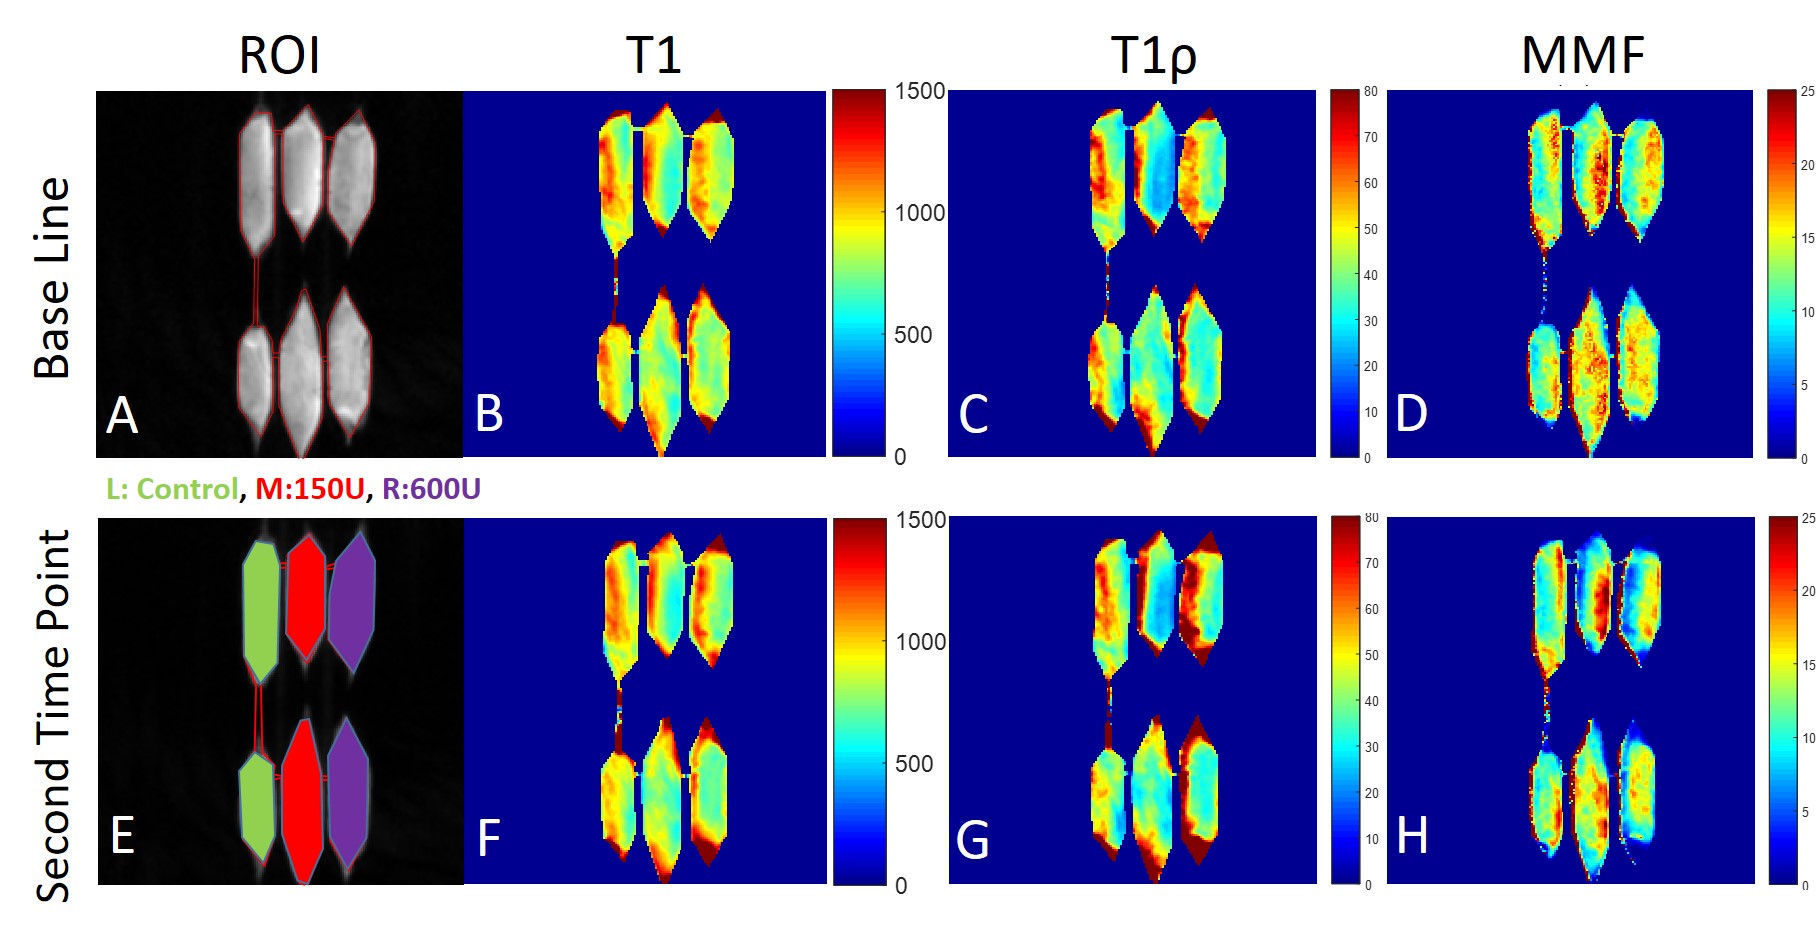
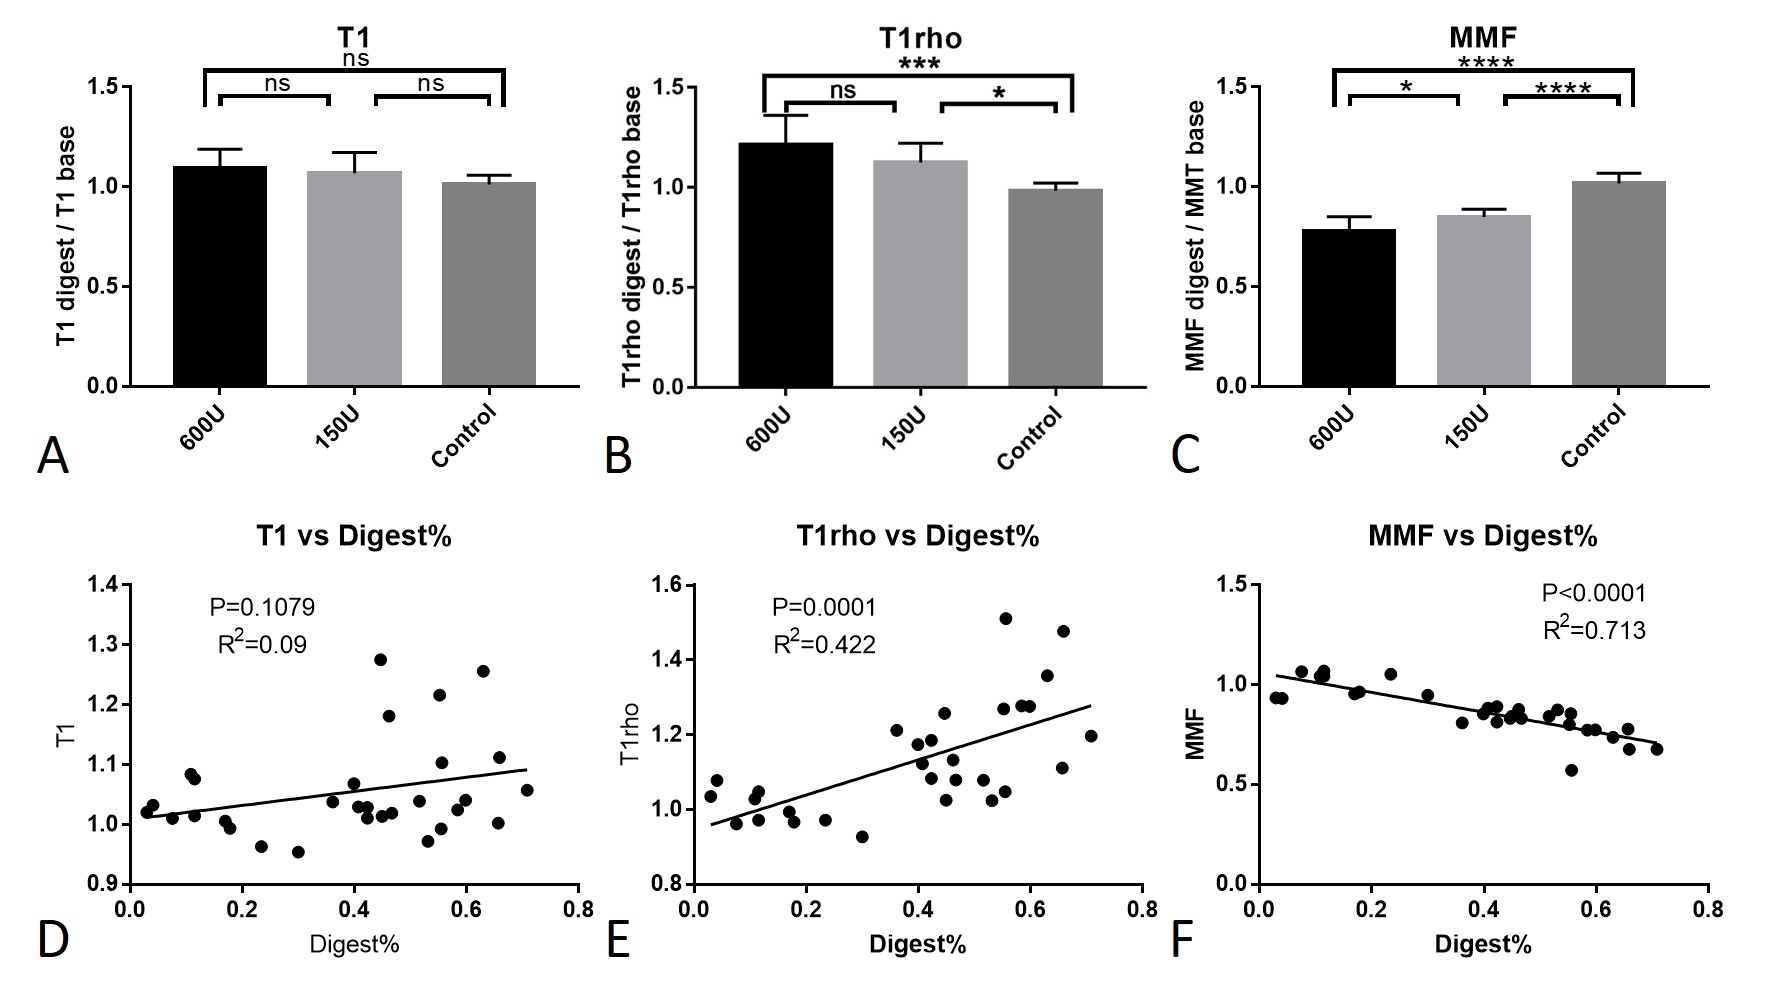
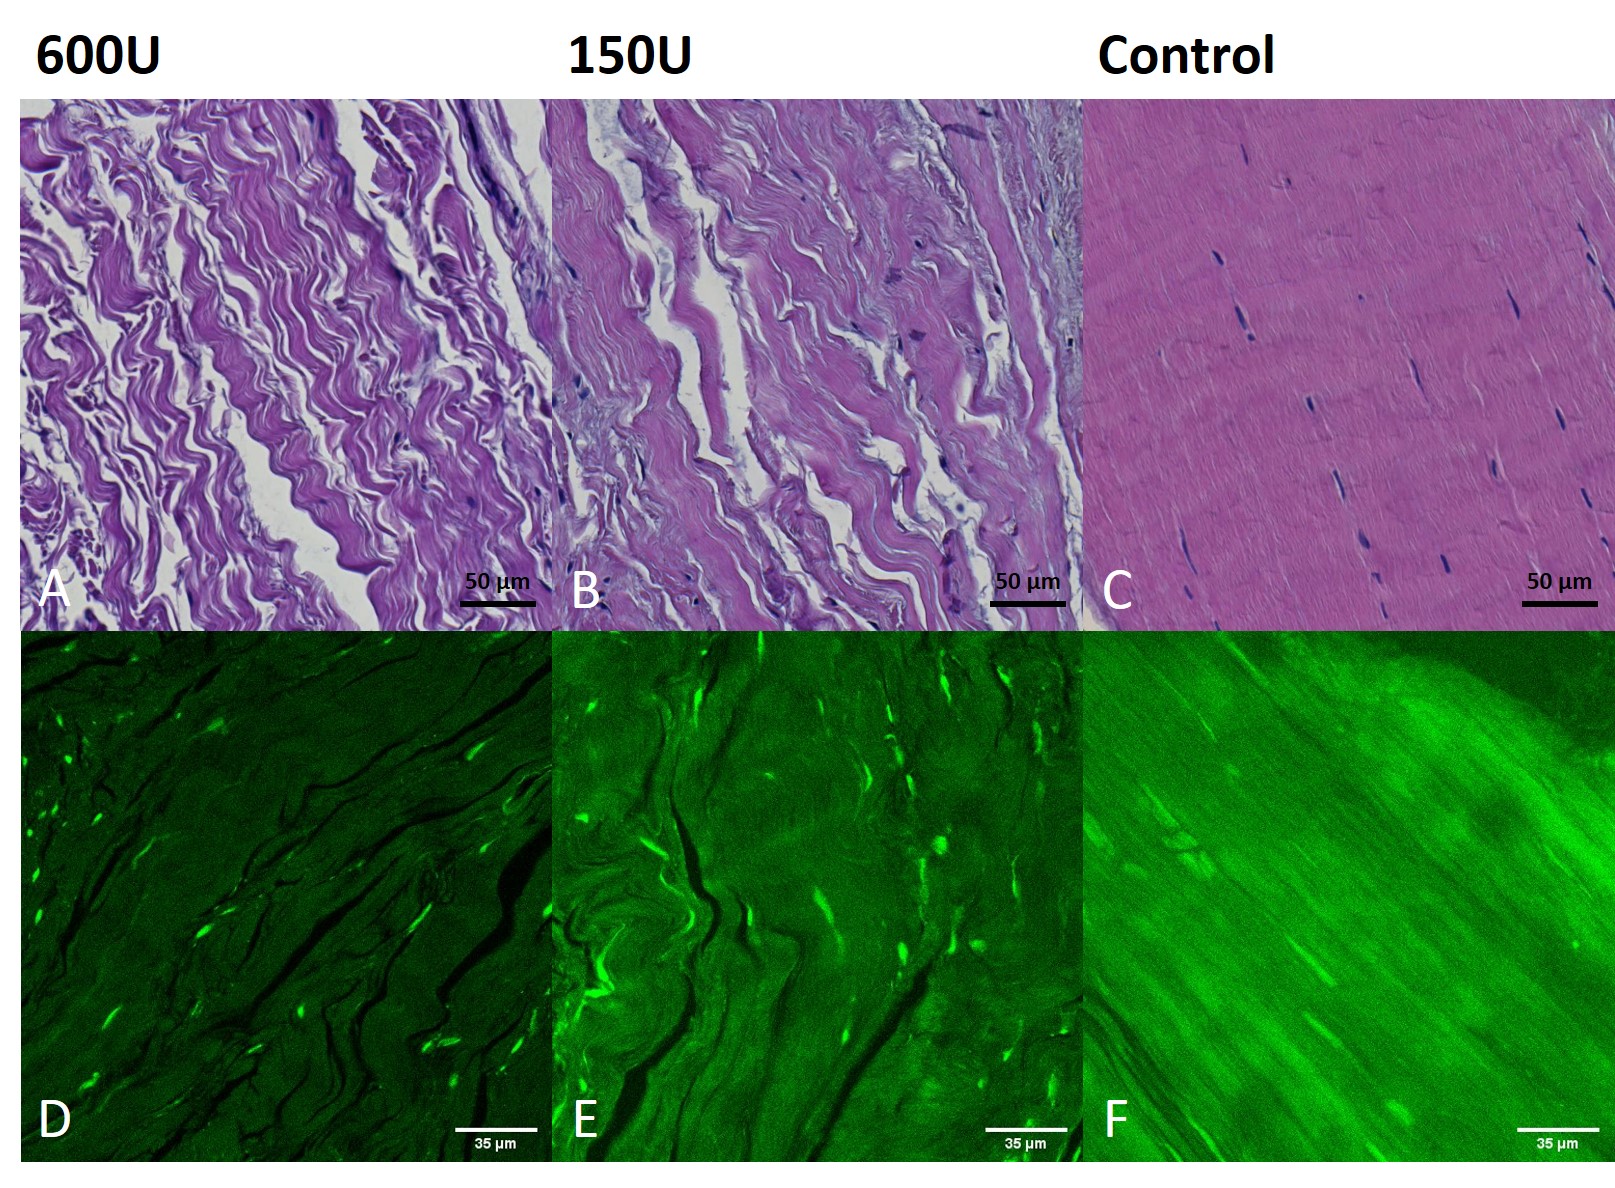
Figure 1 shows representative samples. When compared with baseline images, UTE parametric pixel maps of samples after digestion show a clear peripheral pattern of color change, corresponding to the gradient concentration of collagenase penetrating from superficial to deep. Enzymatic digestion approached the core in the 600U group, whereas no notable changes were apparent in the control group. When compared with the control group, both digestion groups demonstrated significant decreases in MMF (P<0.0001) and significant increases in T1ρ (P<0.001) (Fig 2). No significant differences of T1 were obtained between digested and control groups. Significant negative and positive correlations were observed between MMF and biochemistry results and T1ρ and biochemistry results, respectively. Evaluation of the H&E stained histology images showed separated and disorganized collagen fascicles in digested groups, whereas collagen fascicles were intact in the control group (Fig 3). Evaluation of fluorescence after Col-F staining showed gradually decreased intensity as enzyme concentration increases.Discussion
UTE sequences permit quantitative imaging of tendons with higher signal-to-noise compared with longer TE sequences. Both the UTE-MT technique with two‐pool modeling, which relies on magnetization exchange between detected water protons and macromolecules, and adiabatic T1ρ are less sensitive to the magic-angle effect compared with T2 or T1ρ with continuous wave spin-locking (6, 7). We now demonstrate that both of these techniques are also sensitive to collagen structure and content.Conclusion
MMF and adiabatic T1ρ, acquired using UTE sequences, are strongly correlated with collagen content can be used to evaluate rotator cuff tendon degeneration.Acknowledgements
The authors gratefully acknowledge grant support from the VA Clinical Science R&D Service (I01CX001388), VA Rehabilitation R&D Service (I01RX002604) and National Natural Science Foundation of China (81801673).
References
1. Chard M D, Hazleman B L. Shoulder disorders in the elderly (a hospital study). Ann Rheum Dis 1987; 46:486-7.
2. G P Riley, R L Harrall, C R Constant, et al. Tendon degeneration and chronic shoulder pain: changes in the collagen composition of the human rotator cuff tendons in rotator cuff tendinitis. Annals of the Rheumatic Diseases. 1994; 53:359-366.
3. Mays P K, Bishop J E, Laurent G J. Age-related changes in the proportion of types I and III collagen. Mech Ageing Dev. 1988; 45: 203-12.
4. Bazin S, Le Lous M, Duance V C, et al. Biochemistry and histology of the connective tissue of Dupuytren's disease. EurJ7 Clin Inivest. 1980; 10: 9-16.
5. Chang EY, Szeverenyi NM, Statum S, Chung CB. Rotator cuff tendon ultrastructure assessment with reduced‐orientation dipolar anisotropy fiber imaging. AJR Am J Roentgenol. 2014; 202:376–378.
6. Zhu Y, Cheng X, Ma Y, et al. Rotator cuff tendon assessment using magic‐angle insensitive 3D ultrashort echo time cones magnetization transfer (UTE‐Cones‐MT) imaging and modeling with histological correlation. J Magn Reson Imaging. 2018; 48(1):160-168.
7. Jiang Du, Michael Carl, Eric Diaz, et al. Ultrashort TE T1rho (UTE T1rho) imaging of the Achilles tendon and meniscus. Magnetic Resonance in Medicine. 2010; 64:834–842.
Figures