0862
T2* and UTE-T2* Evaluations of Anterior Cruciate Ligament Graft Maturation1Department of Orthopedic Surgery, Stanford University School of Medicine, Stanford, CA, United States
Synopsis
This study tests the hypothesis that quantitative T2* and UTE-T2* are sensitive to ACL graft changes reflective of histological stages of human ACL graft incorporation following ACL reconstruction. T2* variability at 6 months suggests transition from early stage incorporation to remodeling, while stable values from 6 months to 1 year are consistent with remodeling. ACL graft T2* and UTE-T2*, respectively, from two different cohorts decreased between 1 and 2 years suggesting continued graft maturation during the second year. T2* and UTE-T2* of ACL graft incorporation may help to inform decisions concerning return to sports and work activities following ACL reconstruction.
Introduction
Graft tissues used in anterior cruciate ligament (ACL) reconstruction (ACLR) are derived from tendons. Due to the very short inherent T2 times of tendon and ligament tissues, robust quantitative imaging measures of human ACL graft incorporation and maturation are lacking.1; 2 This study tests the hypothesis that noninvasive quantitative T2* and UTE-T2* mapping are sensitive to ACL graft changes reflective of histologically determined stages of human ACL graft incorporation during the first two years after ALCR.Methods
A total of 147 MRI scans from 32 ACLR subjects (18M, age 30±9yrs, BMI 26±5) undergoing ACLR and 30 uninjured control subjects (18M, age 30±9yrs, BMI 23±3) who provided informed consent to participate in these IRB-approved studies were evaluated. There are two separate cohorts based on different acquisition sequences and scanner manufacturers used at 2 different institutions, Table 1. Twenty ACLR subjects and 20 uninjured controls underwent 3T T2* examination using a radial-out 3-D Cones sequence3, acquired at 7 or 10 TEs (1-25ms, non-uniform echo spacing)4. All Cones cohort ACLR subjects were scanned at 6 weeks, 6 months, and 1 year post-ACL reconstruction. Bilateral imaging was performed at 1 year, and 10 of the 20 Cones cohort subjects were scanned at 2 years. Evaluation of preferred walking speed using gait analysis5 was performed in 11 ACLR Cones cohort subjects at 1-year follow-up. Twelve ACLR subjects and 10 uninjured controls underwent 3T UTE-T2* examination using an acquisition weighted stack of spirals (AWSOS) sequence6, acquired at 11 TEs (0.6-40ms, non-uniform echo spacing)7. All ACLR subjects in the AWSOS cohort were scanned at 1 year. In addition, 10 of the 12 were scanned at 2 years, and 8 were scanned at 6 months. Uninjured controls from both cohorts were scanned once. T2* values from the Cones cohort and UTE-T2* values from the AWSOS cohort were calculated in the intra-articular portion of the ACL or ACL graft manually segmented from a single 2-D slice via pixel-by-pixel mono-exponential T2-curve fitting using MRIMapper software running on a MATLAB platform (©MIT 2006; MathWorks). UTE-T2* values were also calculated in the patellar tendons of AWSOS cohort uninjured controls. Voxels that appeared to be impacted by metal artifacts were excluded from the segmented regions. Normality was assessed with Shapiro-Wilks tests. Longitudinal T2* and UTE-T2* changes were assessed by repeated measures ANOVA (or Friedman for non-normally distributed data). Paired t-tests assessed pairwise differences (or Kruskal Wallis for non-normal data). The relationship between T2* and gait was assessed with Pearson correlation. Statistical analyses were performed with SigmPlot (Systat).Results
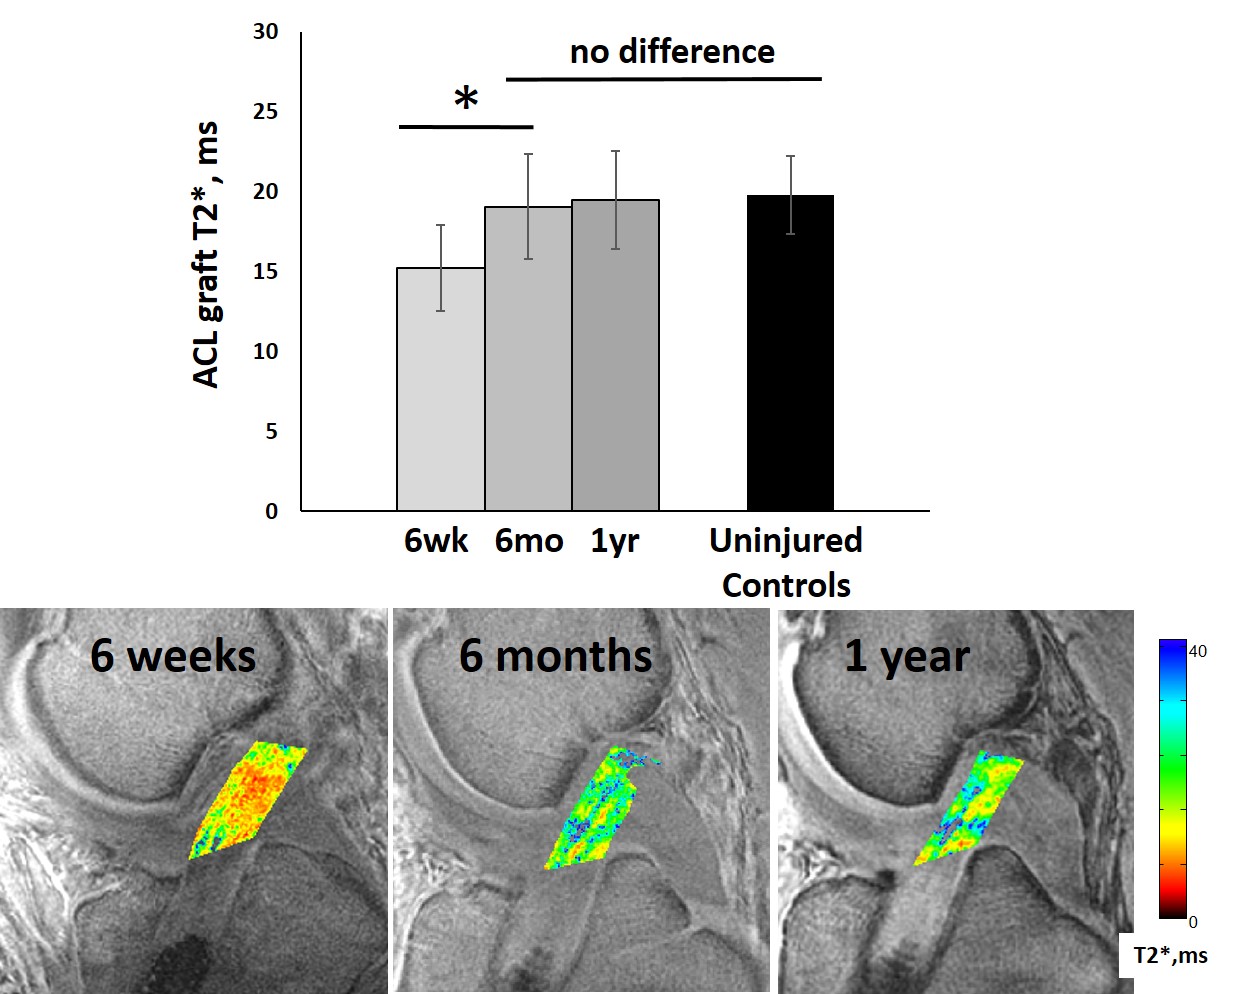
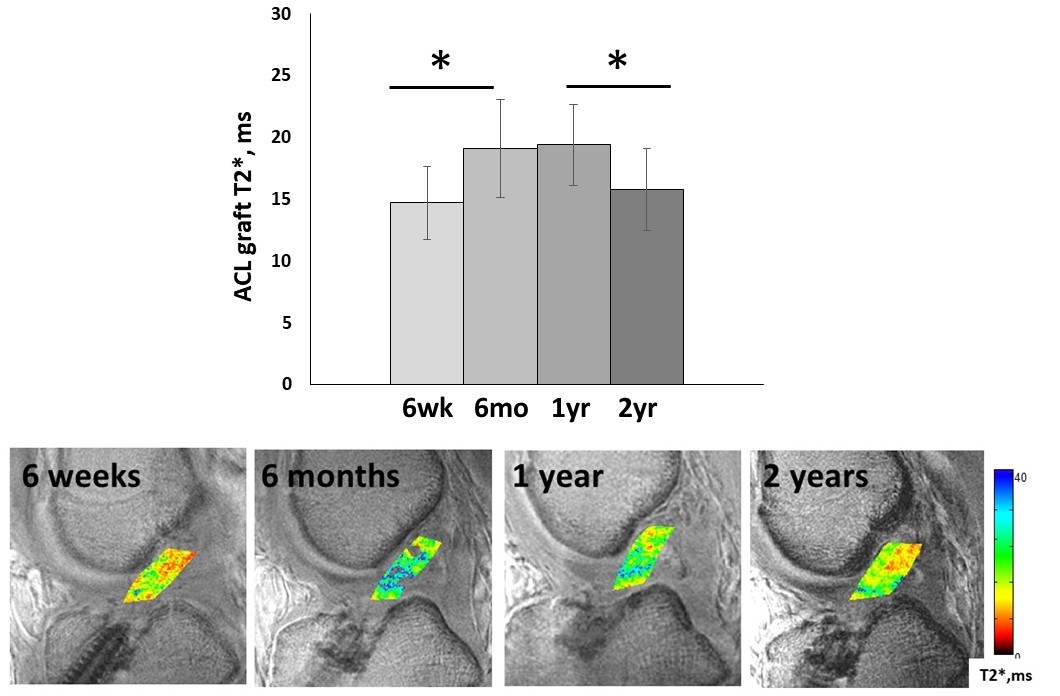
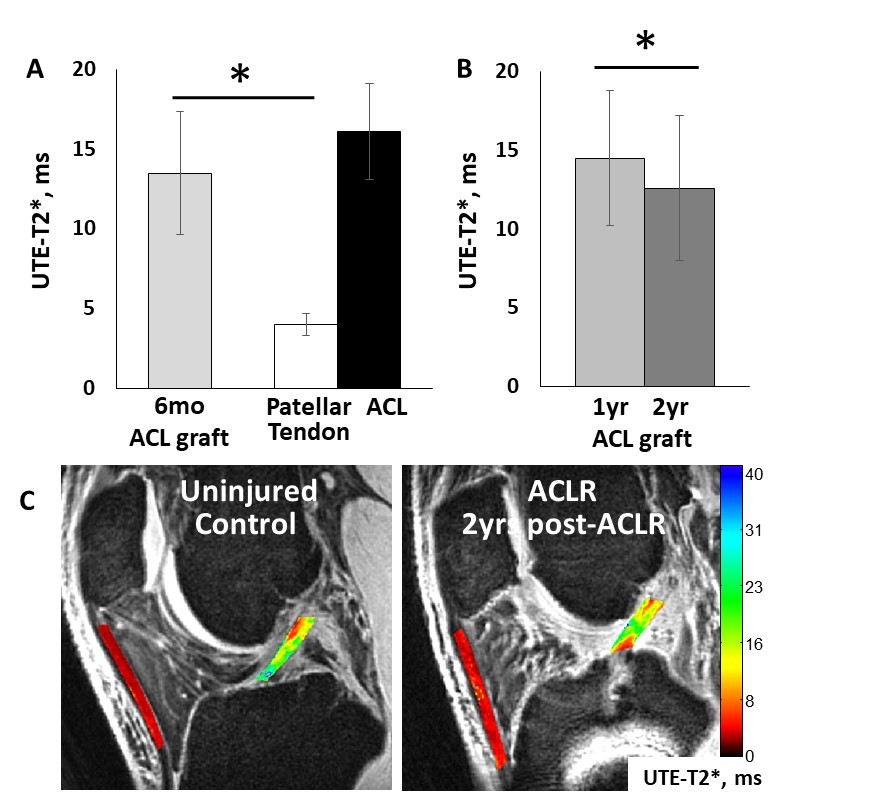
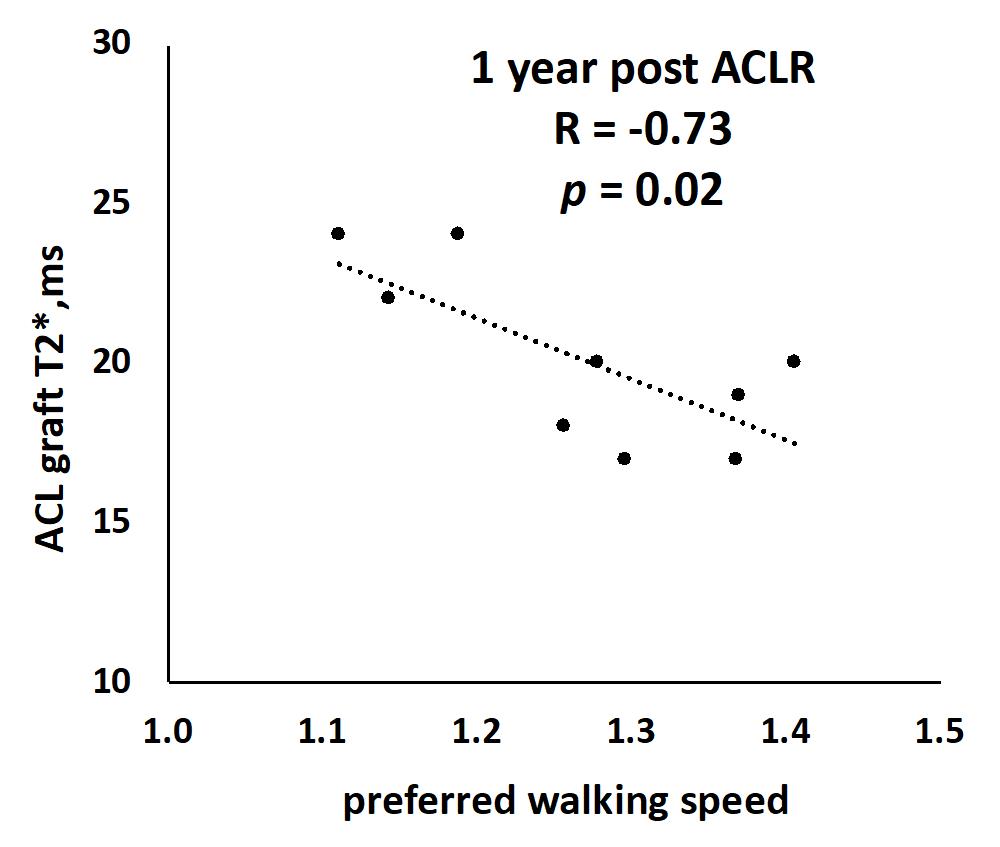
Both T2* and UTE-T2* show evidence of continuing ACL graft maturation between 1 and 2 years after reconstruction. ACL graft T2* increases significantly from 6 weeks to 6 months (Figures 1&2), reaching uninjured ACL levels by 6 months (Figure 1), is stable between 6 months and 1 year (Figures 1&2), and then decreases from 1 to 2 years after ACLR (Figure 2). Likewise, ACL graft UTE-T2* is stable from 6 months to 1 year, and then (Figure 3) decreases to 2 years. Both ACL graft T2* and UTE-T2* show the greatest variation between subjects at the 6 month time-point (Figures 1-3), at which time UTE-T2* maps suggest ACL graft composition has undergone a significant change from that of tendon (Figure 3). Gait analysis indicates that ACLR subjects with lower graft T2* at 1 year walk faster than subjects with higher T2* values (Figure 4).Discussion
Clinical quantitative assessments of short and ultrashort T2* changes in ACL grafts are consistent with what is currently known about the histological stages of human ACL graft maturation.8-11 Moreover, the sensitivity of UTE-T2* mapping to ultrashort T2 signals abundant in source tendon tissue suggest substantial “ligamentization” within the graft as early as 6 month post-surgery. Both T2* and UTE-T2* mapping showed relatively stable graft composition from 6 month to 1 year consistent with remodeling9;12, followed by decreases from 1 to 2 years suggestive of continuing maturation. Gait assessment showing that ACLR subjects with lower graft T2* at 1 year post-surgery walk faster than subjects with higher values suggests that lower T2* at 1-year indicates earlier maturation for those subjects. The UTE-T2* mapping method used in this work has potentially greater sensitivity to graft maturation than T2* methods13;14 due to its enhanced sensitivity to very short T2* signals, the proportion of which is expected to increase as the ligament matures. These data support further investigation into T2* and UTE-T2* assessments of ACL graft incorporation to assist in informing personalized clinical decisions concerning return to sports and work activities.Acknowledgements
NIH RO1 AR052784 (PI Chu) and GE Healthcare for MRI scan time and sequence support.References
1. Biercevicz AM, Akelman MR, Fadale PD, et al. 2015. MRI volume and signal intensity of ACL graft predict clinical, functional, and patient-oriented outcome measures after ACL reconstruction. Am J Sports Med 43(3):693-699.
2. Ma Y, Murawski CD, Rahnemai-Azar AA, et al. 2015. Graft maturity of the reconstructed anterior cruciate ligament 6 months postoperatively: a magnetic resonance imaging evaluation of quadriceps tendon with bone block and hamstring tendon autografts. Knee Surg Sports Traumatol Arthrosc 23(3):661-668.
3. Gurney PT, Hargreaves BA, Nishimura DG. 2006. Design and analysis of a practical 3D cones trajectory. Magn Reson Med 55(3):575-582.
4. Williams AA, Titchenal MR, Andriacchi TP, et al. 2018. MRI UTE-T2* Profile Characteristics Correlate to Walking Mechanics and Patient Reported Outcomes 2 years after ACL Reconstruction. Osteoarthritis Cartilage 26(4):569-579.
5. Titchenal MR, Williams AA, Chehab EF, et al. 2018. Cartilage Subsurface Changes to Magnetic Resonance Imaging UTE-T2* 2 Years After Anterior Cruciate Ligament Reconstruction Correlate With Walking Mechanics Associated With Knee Osteoarthritis. Am J Sports Med 46(3):565-572.
6. Qian Y, Boada FE. 2008. Acquisition-weighted stack of spirals for fast high-resolution three-dimensional ultra-short echo time MR imaging. Magn Reson Med 60(1):135-145.
7. Williams A, Qian Y, Chu CR. 2011. UTE-T2 * mapping of human articular cartilage in vivo: a repeatability assessment. Osteoarthritis Cartilage 19(1):84-88.
8. Abe S, Kurosaka M, Iguchi T, et al. 1993. Light and electron microscopic study of remodeling and maturation process in autogenous graft for anterior cruciate ligament reconstruction. Arthroscopy 9(4):394-405.
9. Claes S, Verdonk P, Forsyth R, et al. 2011. The "ligamentization" process in anterior cruciate ligament reconstruction: what happens to the human graft? A systematic review of the literature. Am J Sports Med 39(11):2476-2483.
10. Falconiero RP, DiStefano VJ, Cook TM. 1998. Revascularization and ligamentization of autogenous anterior cruciate ligament grafts in humans. Arthroscopy 14(2):197-205.
11. Rougraff B, Shelbourne KD, Gerth PK, et al. 1993. Arthroscopic and histologic analysis of human patellar tendon autografts used for anterior cruciate ligament reconstruction. Am J Sports Med 21(2):277-284.
12. Amiel D, Kleiner JB, Roux RD, et al. 1986. The phenomenon of "ligamentization": anterior cruciate ligament reconstruction with autogenous patellar tendon. J Orthop Res 4(2):162-172.
13. Beveridge JE, Machan JT, Walsh EG, et al. 2018. Magnetic resonance measurements of tissue quantity and quality using T2 * relaxometry predict temporal changes in the biomechanical properties of the healing ACL. J Orthop Res 36(6):1701-1709.
14. Biercevicz AM, Murray MM, Walsh EG, et al. 2014. T2 * MR relaxometry and ligament volume are associated with the structural properties of the healing ACL. J Orthop Res 32(4):492-499.
Figures
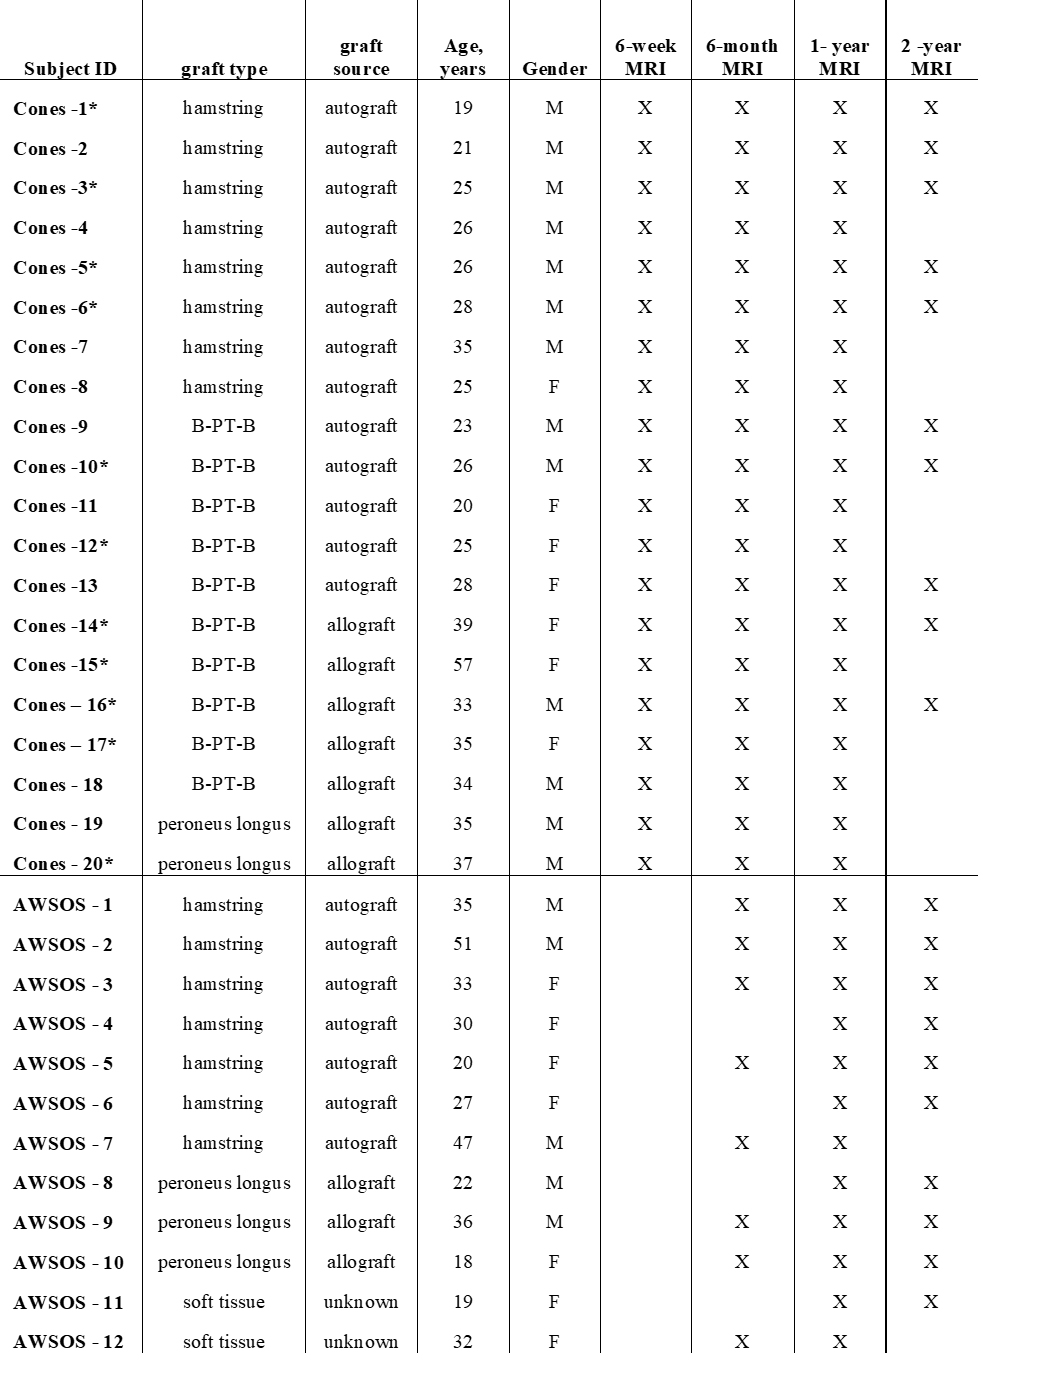
Table 1. Cones T2* and
AWSOS UTE-T2* Cohorts.
*Indicates
subjects completing 1 year gait analysis.
X indicates MRI acquired.
B-PT-B indicates bone-patellar tendon-bone type ACL autograft.