0860
Serial characterization of HP [1-13C]pyruvate metabolism in the brains of patients with glioma and healthy controls1Department of Radiology and Biomedical Imaging, University of California, San Francisco, San Francisco, CA, United States, 2Department of Neurological Surgery, University of California, San Francisco, San Francisco, CA, United States, 3Department of Bioengineering and Therapeutic Sciences, University of California, San Francisco, San Francisco, CA, United States
Synopsis
Serial dynamic hyperpolarized [1-13C]pyruvate imaging was performed on 3 patients undergoing treatment for recurrent brain tumors and 2 healthy controls using a frequency-specific EPI sequence (20 total scans). To evaluate metabolism within normal-appearing white matter (NAWM), rate constants for pyruvate-to-lactate (kPL) and pyruvate-to-bicarbonate (kPB) conversion were kinetically modeled. Healthy control data provided reference rate constants in NAWM and demonstrated replicabililty of test-retest type scans across hardware platforms. Serial patient data also showed similar, replicable data with standard-of-care treatment, as well as evidence that kPL, NAWM is increased 148-290% following administration of anti-angiogenic agent Bevacizumab, which promotes vascular normalization.
Introduction
Gliomas comprise a heterogeneous class of brain tumors, with glioblastoma being the most common and malignant subtype. Because treatment-related changes often mimic or mask malignant disease on standard anatomic imaging1, it is difficult to monitor patients clinically for recurrence. Dynamic hyperpolarized (HP) 13C imaging allows for real-time measurement of metabolism, which may improve glioma surveillance2,3,4. Here, we focus on characterizing brain metabolism in normal-appearing white matter using serial HP scans from patients with recurrent glioma during treatment and healthy controls.
Methods
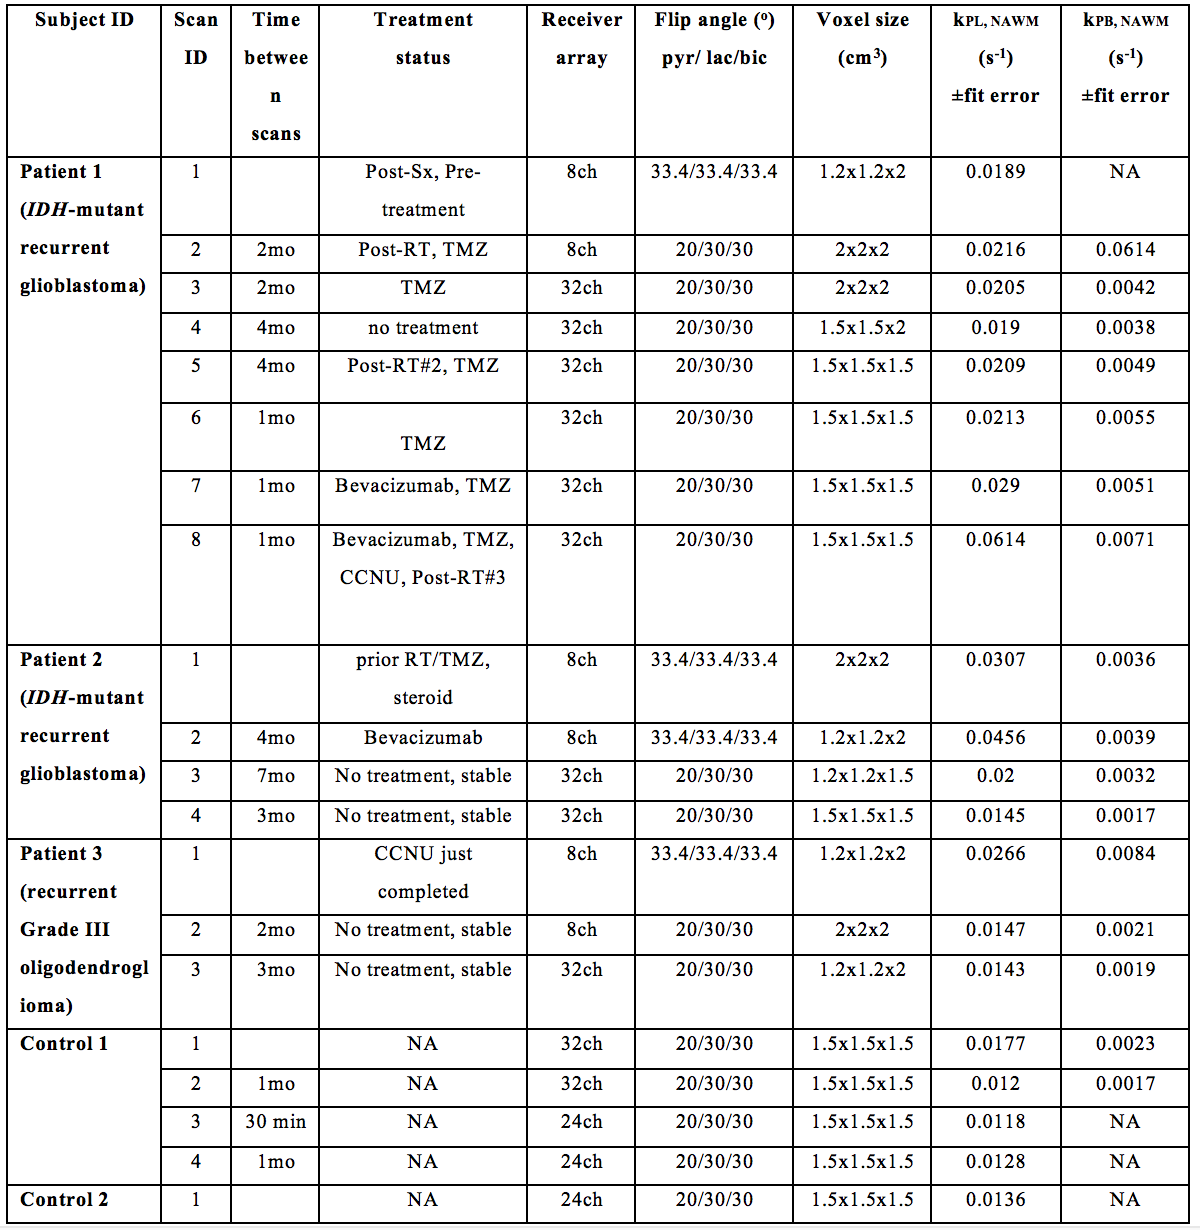
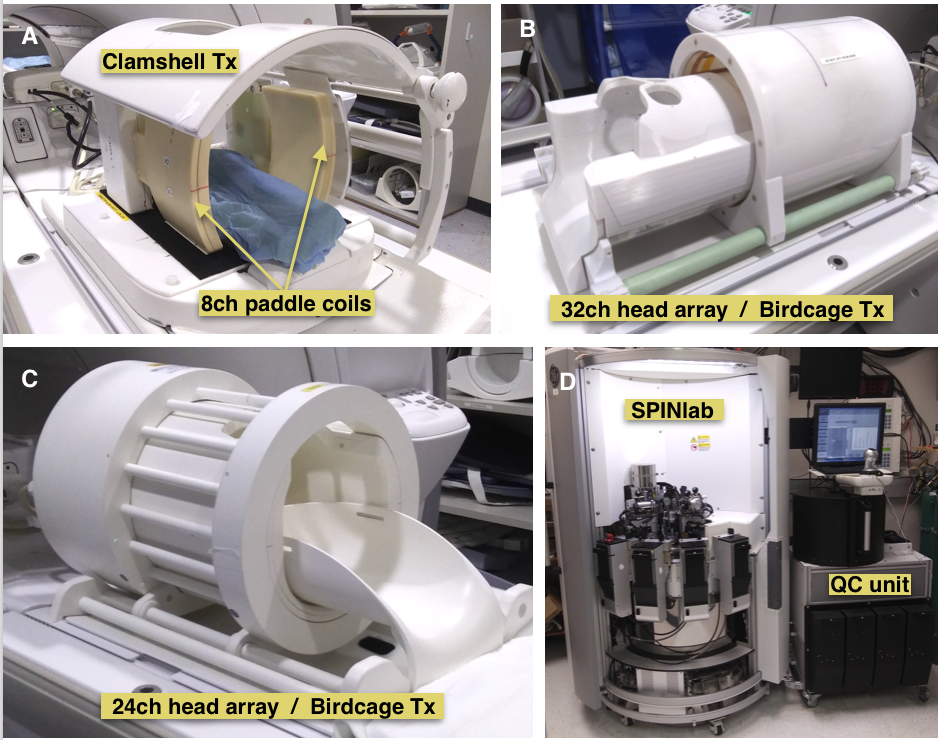
Serial HP 13C Imaging. Serial dynamic HP 13C imaging was acquired from 3 patients with recurrent glioma (1 female, 2 males) and 2 healthy male volunteers (see Table 1). The latter consented to undergo imaging as controls for independent and test-retest style exams. A frequency-specific 2-D multislice EPI sequence5 (TR/TE=62.5ms/21.7ms, 8 slices, 20 timepoints, 3s temporal resolution, 3 frequencies) with SPSP excitation was run on a 3T MR750 scanner using 8-channel 13C, 32-channel 13C, or combined 24-channel 13C/8-channel 1H coils with resolution and flip angle parameters summarized in Table 1. Custom-designed 13C phased-array receivers and transmit coil configurations6 are shown in Figure 1A-C.
Polarization and Injection. Dynamic nuclear polarization of [1-13C]pyruvate was performed on a SPINlab system (Figure 1D), according to previously described methods2. In brief, 1.432g [1-13C]pyruvic acid and 28 mg trityl radical were polarized in a sterile pharmacy kit for 2.5 hr. Upon dissolution and pharmacist release, a 0.43mL/kg dose of [1-13C]pyruvate was injected intravenously at 5mL/s, followed by a 20mL saline flush. The 13C data were obtained after a 5s delay.
White Matter Segmentation. 3-D FLAIR and T1-weighted images (TR/TE/TI=6652/2448/450ms, resolution=1.5x1x1mm3, FOV=25.6, matrix=256x256) from a subsequent 1H examination were aligned to FSE images from the 13C examination using body coil or 24-channel(13C)/8-channel(1H) coils. White matter was segmented using the FSL FAST algorithim7. Normal-appearing white matter (NAWM) ROIs were obtained by subtracting regions of Gd-enhancement and FLAIR hyperintensity, and then resampling to 13C data resolution. Voxels containing>50% NAWM were considered in the subsequent analysis.
Modeling kPL and kPB. EPI data were prewhitened8 and channel-combined according to a weighted-sum based on the total pyruvate signal9. After phasing the complex data and summing signal across NAWM voxels, the rate constants for pyruvate-to-lactate (kPL,NAWM) and pyruvate-to-bicarbonate (kPB,NAWM) conversion were estimated using a two-site exchange model4,10. Apparent rate constant values with errors based on fitting estimates<0.01 were reported.
Results
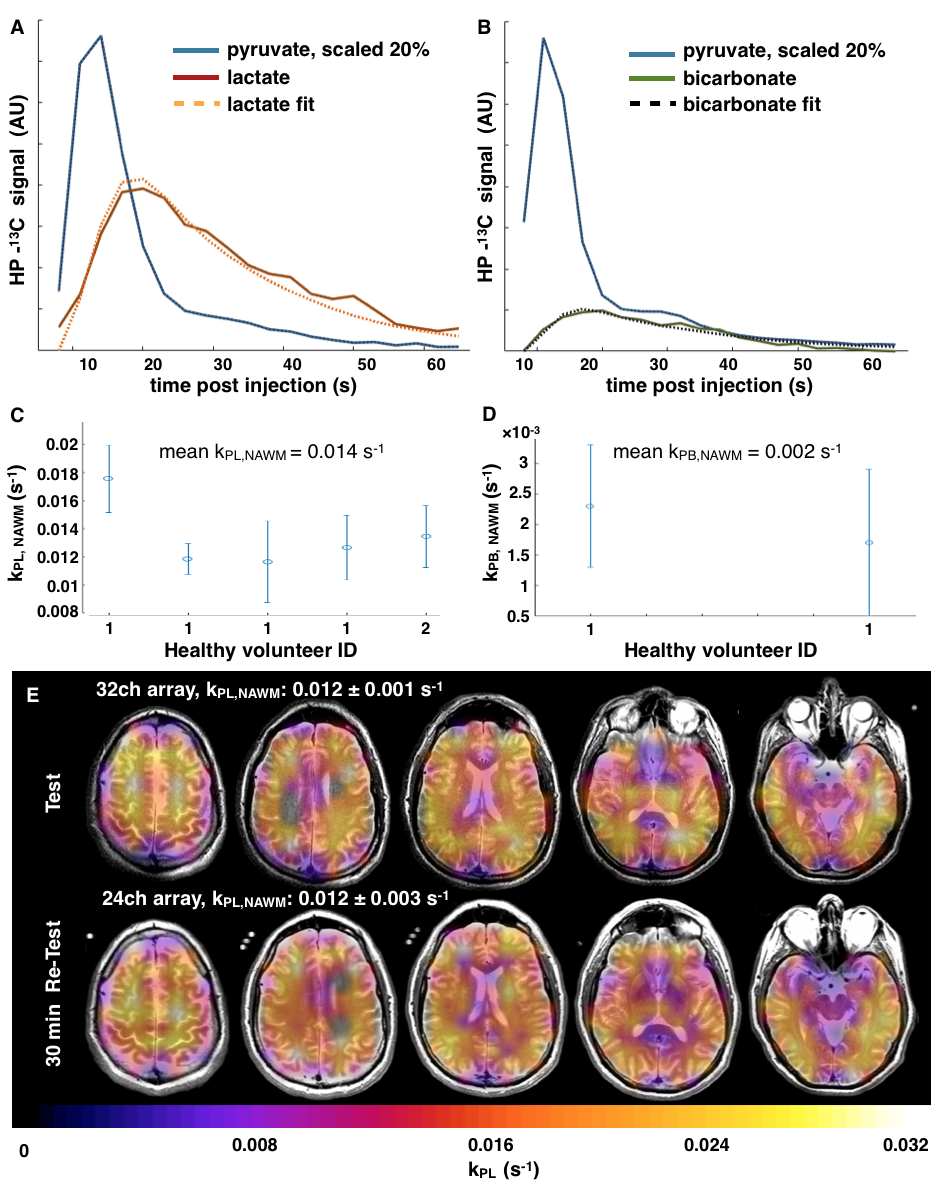
Examples of HP 13C lactate and bicarbonate traces from dynamic EPI patient data are shown alongside model fits for kPL,NAWM and kPB,NAWM in Figure 2A,B, respectively. Based on 5 scans from the 2 healthy volunteers, the mean kPL,NAWM was 0.014s-1 (Figure 2C; Table 1), while the mean kPB,NAWM of 0.002s-1 (Figure 2D; Table 1) was only estimated from two exams due to comparatively lower bicarbonate SNR. The 2nd and 3rd scans from volunteer#1 were acquired 30 min apart using different hardware with kPL,NAWM±error of 0.012±0.001s-1 and 0.012±0.001s-1, respectively (Figure 2E).
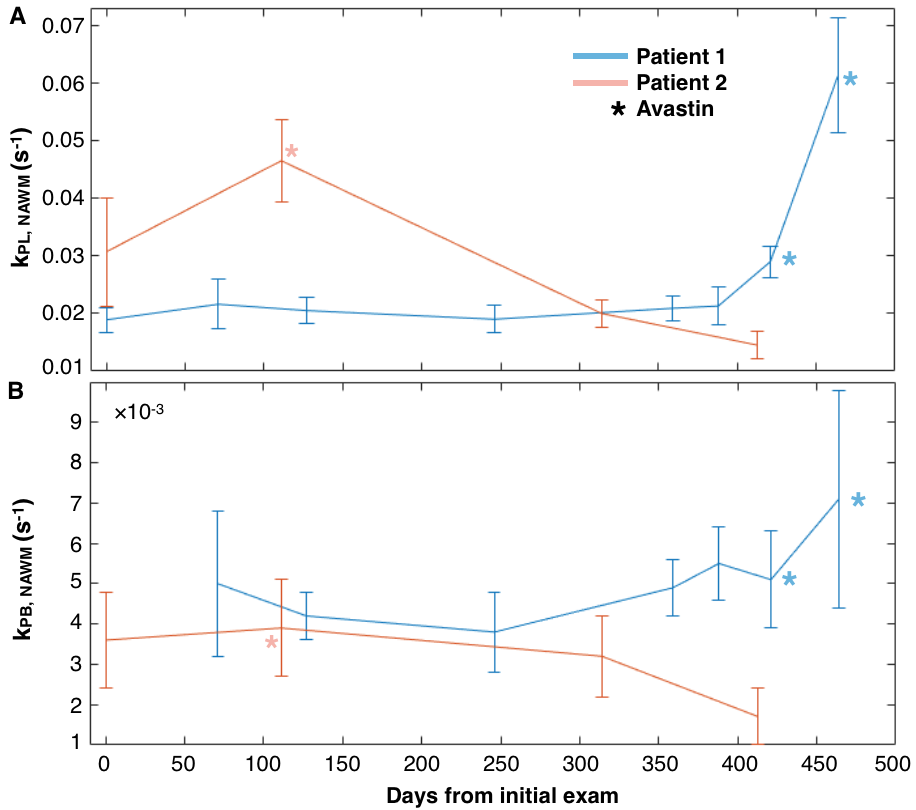
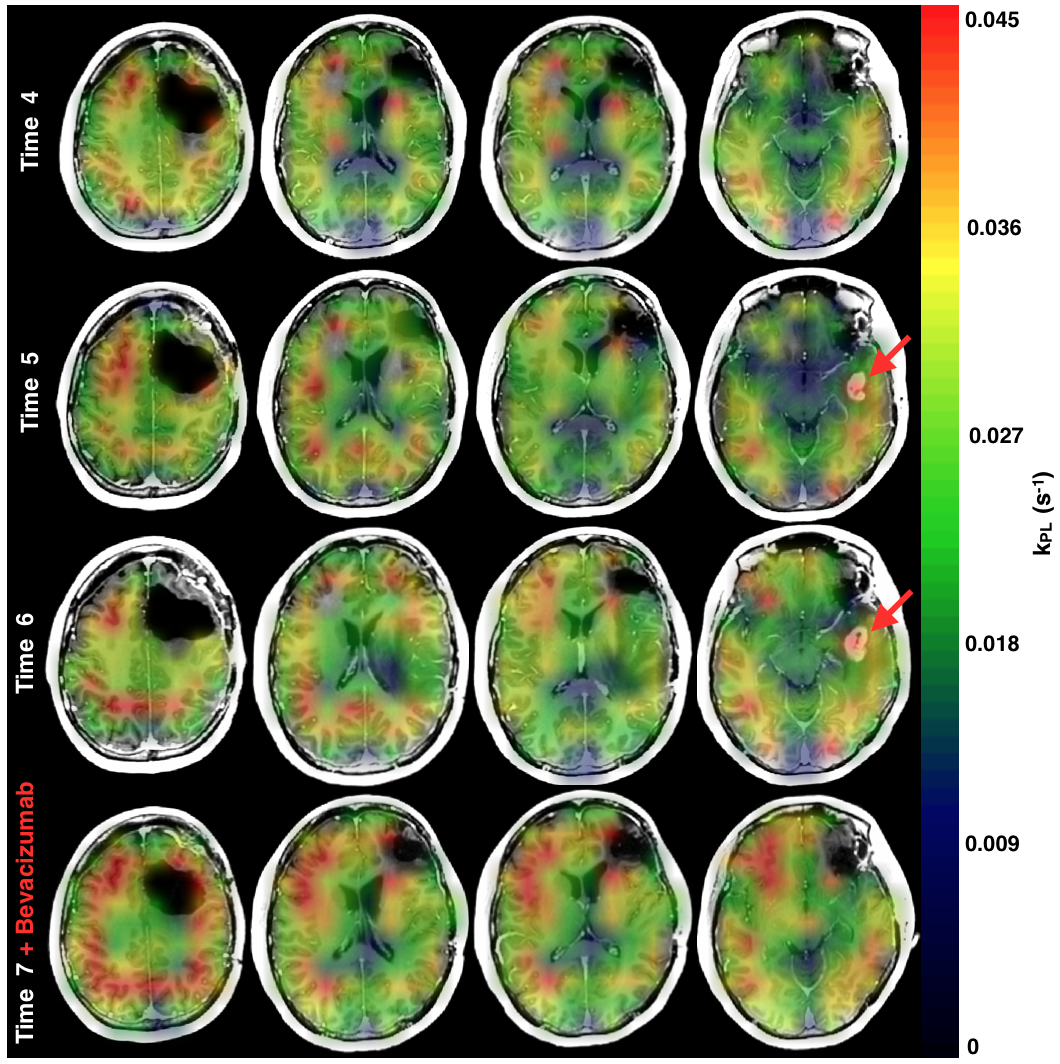
Rate constants from serial patient HP exams are given in Table 1. kPL,NAWM from patient#3 while clinically stable and off-treatment was similar to that of healthy controls. A pattern of temporal variation corresponding to Bevacizumab dosing can be seen in patients#1,2 (Figure 3). For patient#1, kPL,NAWM was stable pre-treatment and post-radiation/chemotherapy(temozolomide, TMZ), but increased by 138% (timepoint#6) and 290% (timepoint#7) after Bevacizumab treatment. kPL,NAWM in patient#2 increased 148% with Bevacizumab at timepoint#2 and subsequently reduced to values that were similar to the baseline scan for patient#1. Mean kPB,NAWM values for patient#1 and patient#2 were 0.005s-1 and 0.003s-1, respectively, with SNR limitations restricting the number of voxels included in the calculation. Figure 4 depicts serial changes in kPL for patient#1, where an emerging lesion with heightened kPL disappeared in conjunction with the loss of Gd-enhancement following Bevacizumab treatment.
Discussion
This work evaluated the apparent rate constants associated with HP [1-13C]pyruvate metabolism in healthy volunteers and patients with gliomas during serial imaging. Volunteer data demonstrated the replicability of kPL,NAWM and provided a reference for rate constants. Despite previous standard-of-care treatment, kPL,NAWM from patients#1,2 was similar to that in healthy controls but changed after Bevacizumab11 was introduced. This provides evidence that the anti-angiogenic agent produces vascular changes in the blood-brain barrier of normal brain that affect apparent [1-13C]pyruvate metabolism12. Error estimates for kPB,NAWM showed considerable overlap within and between patients. Limitations in the current study included the use of variable spatial resolutions and the impact of partial voluming on isolating NAWM signals.Conclusion
This study provided reference rate constants in normal white matter of the brain and suggested that Bevacizumab may increase kPL in serial HP 13C brain imaging.Acknowledgements
This work was supported by NICO and NIH Grants R01 CA127612, P01 CA118816 and P41 EB0341598References
1. Hygino da Cruz LC, Rodriguez I, Domingues RC, Gasparetto EL, Sorensen AG.Pseudoprogression and pseudoresponse: imaging challenges in the assessment of posttreatment glioma. AJNR Am J Neuroradiol. 2011, 32(11):1978-85
2. Park I, Larson PEZ, Gordon JW, Carvajal L, Chen HY, Bok R, Van Criekinge M, Ferrone M, Slater JB, Xu D, Kurhanewicz J, Vigneron DB, Chang S, Nelson SJ. Development of methods and feasibility of using hyperpolarized carbon-13 imaging data for evaluating brain metabolism in patient studies. Magn Reson Med. 2018; 80(3):864-873
3. Miloushev VZ, Granlund KL, Boltyanskiy R, Lyashchenko SK, DeAngelis LM, Mellinghoff IK, Brennan CW, Tabar V3,6, Yang TJ, Holodny AI, Sosa RE, Guo YW, Chen AP, Tropp J, Robb F, Keshari KR. Metabolic Imaging of the Human Brain with Hyperpolarized 13C Pyruvate Demonstrates 13C Lactate Production in Brain Tumor Patients. Cancer Res. 2018; 78(14): 3755-3760
4. Mammoli D, Gordon JW, Autry AW, Larson PEZ, Chen H. Modeling In Vivo Metabolism of
Hyperpolarized Pyruvate in Human Brain Tumor Patients. Proc. Intl. Soc. Mag. Reson. Med. 2018, abstract#3564
5. Gordon JW, Vigneron DB, and Larson PEZ. Development of a Symmetric Echo Planar Imaging Framework for Clinical Translation of Rapid Dynamic Hyperpolarized 13C Imaging. Magn Reson Med. 2017; 77: 826–832
6. Autry AW, Gordon JW, Carvajal L, Park I, Mammoli D, Chen H, Chang S, Li Y, Xu D, Vigneron DB, and Nelson SJ. Comparison between 8- and 32-channel phased-array receive coils for in vivo hyperpolarized C-13 brain imaging. Proc. Intl. Soc. Mag. Reson. Med. 2018, abstract#3565
7. Zhang Y, Brady M, Smith S. Segmentation of brain MR images through a hidden random field model and the expectation-maximization algorithm, IEEE Trans Med Imag. 2001; 20(1): 45-57
8. Hansen
MS. Parallel Imaging Reconstruction I: Cartesian. Proc. Intl. Soc. Mag. Reson.
Med. 18 (2010)
9. Zhu Z, Zhu X, Ohliger M, Cao P, Tang S, Gordon JW, Carvajal L, Shin PJ, Aggarwal R, Bok R, Kurhanewicz J, Munster P, Larson PEZ, Vigneron DB. Coil Combination Methods for 16-channel Hyperpolarized C13 Spectroscopic Imaging Studies of Liver Metastases Patients. Proc. Intl. Soc. Mag. Reson. Med. 2018, abstract#3881
10. Larson PEZ, Chen H, Gordon JW, et al. Analysis Methods for Human Hyperpolarized 13C-pyruvate Studies. Proc. Intl. Soc. Mag. Reson. Med. 2018, abstract#3850
11. Friedman HS, Prados MD, Wen PY, et al. Bevacizumab alone and in combination with irinotecan in recurrent glioblastoma. J Clin Oncol 2009;27:4733-4740
12. Miller JJ, Grist JT, Serres S, et al. 13C Pyruvate Transport Across the Blood-Brain Barrier in Preclinical Hyperpolarised MRI. Scientific Reports 8, Article number: 15082 (2018)
Figures