0859
Deuterium Metabolic Imaging (DMI) of glucose metabolism in patients with brain tumors.Henk M. De Feyter1, Zachary A. Corbin2, Isabel P. Prado3, Robert K. Fulbright1, Douglas L. Rothman1, and Robin A. de Graaf1
1Radiology and Biomedical Imaging, Yale University, New Haven, CT, United States, 2Neurology, Yale University, New Haven, CT, United States, 3Yale University, New Haven, CT, United States
Synopsis
Deuterium Metabolic Imaging (DMI) is a novel approach providing high 3D spatial resolution metabolic data from both animal models and human subjects. DMI relies on 2H MRSI in combination with administration of 2H-labeled substrates. Here we describe the first experiences with using DMI to map steady state metabolism of orally administered [6,6’-2H2]-glucose in patients diagnosed with a brain tumor. DMI revealed striking image contrast based on regional differences of glucose metabolism, with high-grade tumor lesions depicting metabolite labeling with consistently high lactate production and low glucose oxidation, a metabolic phenotype known as the Warburg effect.
Introduction
Deuterium Metabolic Imaging (DMI) is a novel metabolic imaging method combining 2H MRSI with administration of 2H-labeled substrates (1). DMI can be applied dynamically to calculate metabolic rates or map steady state levels of 2H-labeling in downstream metabolites of the 2H-labeled substrate of interest, revealing regional differences in metabolism. Altered metabolism is increasingly recognized as a hallmark of cancer (2). An increased rate of glycolysis and lower degree of oxidative glucose metabolism, first described by Otto Warburg and hence named the Warburg effect, is a well-described example (3). Here we report the first experiences with using DMI to image the Warburg effect in patients diagnosed with a brain tumor, after oral intake of [6,6’-2H2]-glucose.Methods
Patient studies (n=5) were performed on a 4T magnet interfaced to a Bruker Avance III HD spectrometer. Studies were performed with a proton TEM coil for MRI and shimming. 2H RF reception at 26.2MHz was achieved with a four-coil phased-array (8x10cm), driven as a single RF coil during transmission. Subjects took an oral dose (0.75g/kg) of [6,6’-2H2]-glucose dissolved in 200-250mL of water. After positioning the patient in the scanner, scout images, B0 mapping, shimming, and T2-weighted multi-slice spin echo MR images were acquired. 2H MRSI signal acquisition was achieved with a pulse-acquire sequence extended with 3D phase-encoding gradients and spherical k-space encoding (TR: 333 ms, averages: 8, total scan time: 29 mins)(1). Steady state DMI was performed at a nominal 20x20x20mm3=8mL spatial resolution, with the acquisition starting 70-80 min after glucose intake. All 1H MRI and 2H DMI data were processed in NMRWizard, a home-written graphical user interface in Matlab 8.3. DMI processing included linear prediction of missing time domain points due to the phase encoding gradients and 5Hz line broadening followed by 4D Fourier transformation. The resulting 2H MR spectra were quantified with linear least-squares fitting of up to four Lorentzian lines and a linear baseline. Corrected amplitudes of fitted water and metabolite peaks were converted to concentration (in millimolar) using the baseline natural abundance water peak as an internal reference (10.12 mM)(1). Deuterium-enriched metabolite levels were overlaid on anatomical MR images as amplitude color maps following spatial convolution with a Gaussian kernel (Fig. 1).Results
Five patients with a brain tumor were studied (4 male, 1 female, age: 53-72 yrs). Four patients were diagnosed with glioblastoma (GBM), and one patient had an anaplastic oligodendroglioma. All patients had undergone partial tumor resection and were receiving standard of care (chemo-radiation) before being recruited for a DMI study. All 5 DMI studies resulted in high quality datasets which were used to generate metabolic maps of 2H-labeled glucose, glutamate+glutamine (Glx), and lactate (Fig. 1). The DMI maps clearly show regional differences in levels of 2H-labeled metabolites, with the tumor region displaying lower levels of labeled Glx and higher levels of labeled lactate, compared to normal-appearing brain. Similar patterns were observed in other patients diagnosed with GBM (Fig. 2). In the patient with the anaplastic oligodendroglioma, no increased level of labeled lactate was observed in the tumor lesion (Fig. 3). Instead, the data show a qualitatively similar metabolic appearance as normal brain.Discussion
Aggressive tumors typically display increased glycolytic activity with production of lactate and decreased oxidative glucose metabolism, a phenomenon known as the Warburg effect. We used the ratio of labeled lactate over Glx as a representation of the Warburg effect, which allowed regional mapping of this cancer-specific metabolic phenotype. All GBM tumors showed strong image contrast with normal-appearing brain in the lactate/Glx, or Warburg maps. Interestingly, the patient with the anaplastic oligodendroglioma did not have elevated levels of labeled lactate. Anaplastic oligodendroglioma is considered a high-grade (III) tumor, yet this particular lesion was characterized as IDH1 R132H-mutated, 1p/19q co-deleted, and MGMT methylated. These genetic features are found in tumors with better clinical outcomes. These data suggest that brain tumor glucose metabolism, as imaged with DMI, could be an indicator of tumor grade and potentially disease aggressiveness.Conclusion
DMI combined with oral administration of [6,6’-2H2]-glucose provided unique information about regional glucose metabolism in the brain that is currently not offered by any other imaging modality. The first experience with DMI in patients indicates that DMI is a robust and low-burden technique. Together with the affordability of [6,6’-2H2]-glucose, these results warrant further exploration of DMI and the relevance of its derived metabolic maps for the diagnosis and management of patients with brain tumors.Acknowledgements
We thank Pete Brown, Scott McIntyre and Terry Nixon for continuing technical support and maintenance of the Yale MRRC MR scanners. We thank the American Brain Tumor Association and the James S. McDonnell Foundation for financial support.References
1. De Feyter HM, Behar KL, Corbin ZA, et al. Deuterium metabolic imaging (DMI) for MRI-based 3D mapping of metabolism in vivo. Sci. Adv. 2018;4:eaat7314 doi: 10.1126/sciadv.aat7314. 2. Hanahan D, Weinberg RA. Hallmarks of Cancer: The Next Generation. Cell 2011;144:646–674 doi: 10.1016/j.cell.2011.02.013. 3. Warburg O. On respiratory impairment in cancer cells. Science 1956;124:269–270.Figures
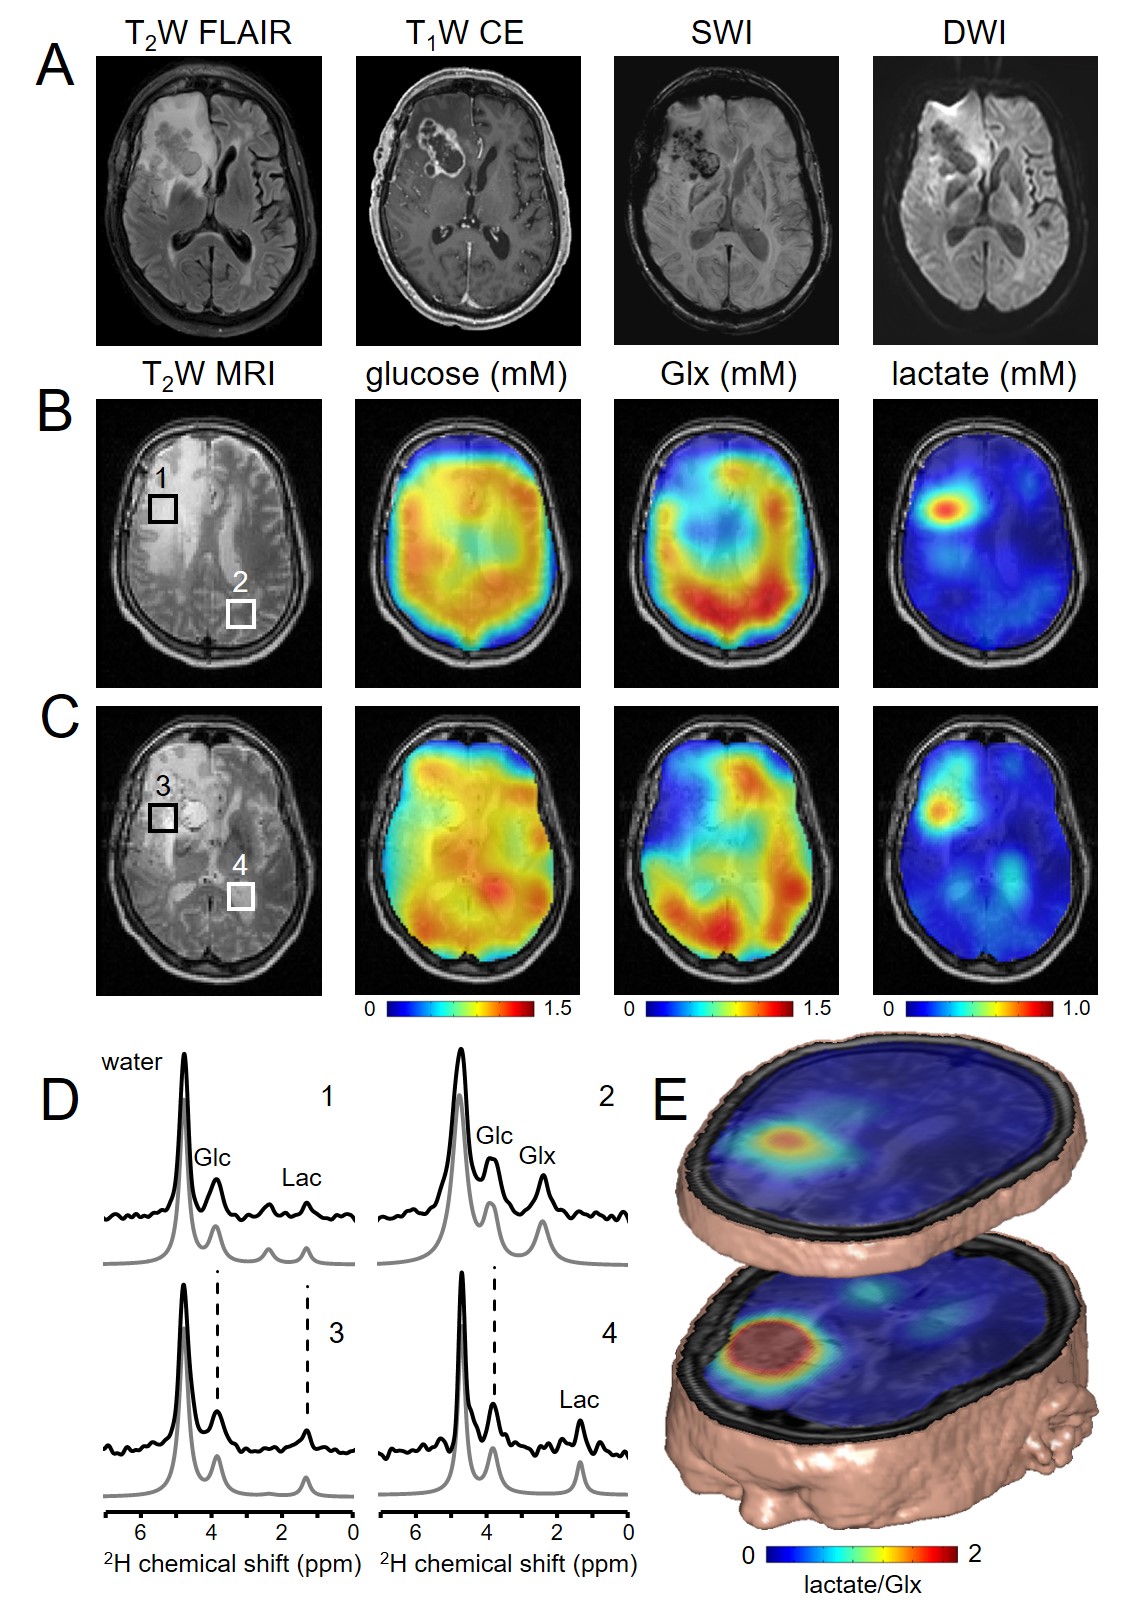
Figure 1. DMI visualizes the Warburg
effect after oral [6,6’-2H2]-glucose
intake. A) MR images
acquired as standard of care in a patient diagnosed with recurrent GBM. B, C) T2-weighted
MRI and overlaid DMI maps in two slices that contain the tumor lesion. DMI maps
show homogenous distribution of 2H-glucose across the slices but
lower levels of 2H-labeled Glx and a higher concentration of 2H-labeled
lactate in the tumor lesion. D) 2H NMR spectra from numbered
locations depicted in the T2W MR image. E) 3D illustration of
combined MRI and DMI of the lactate/Glx ratio representing the spatial
distribution of the Warburg effect.
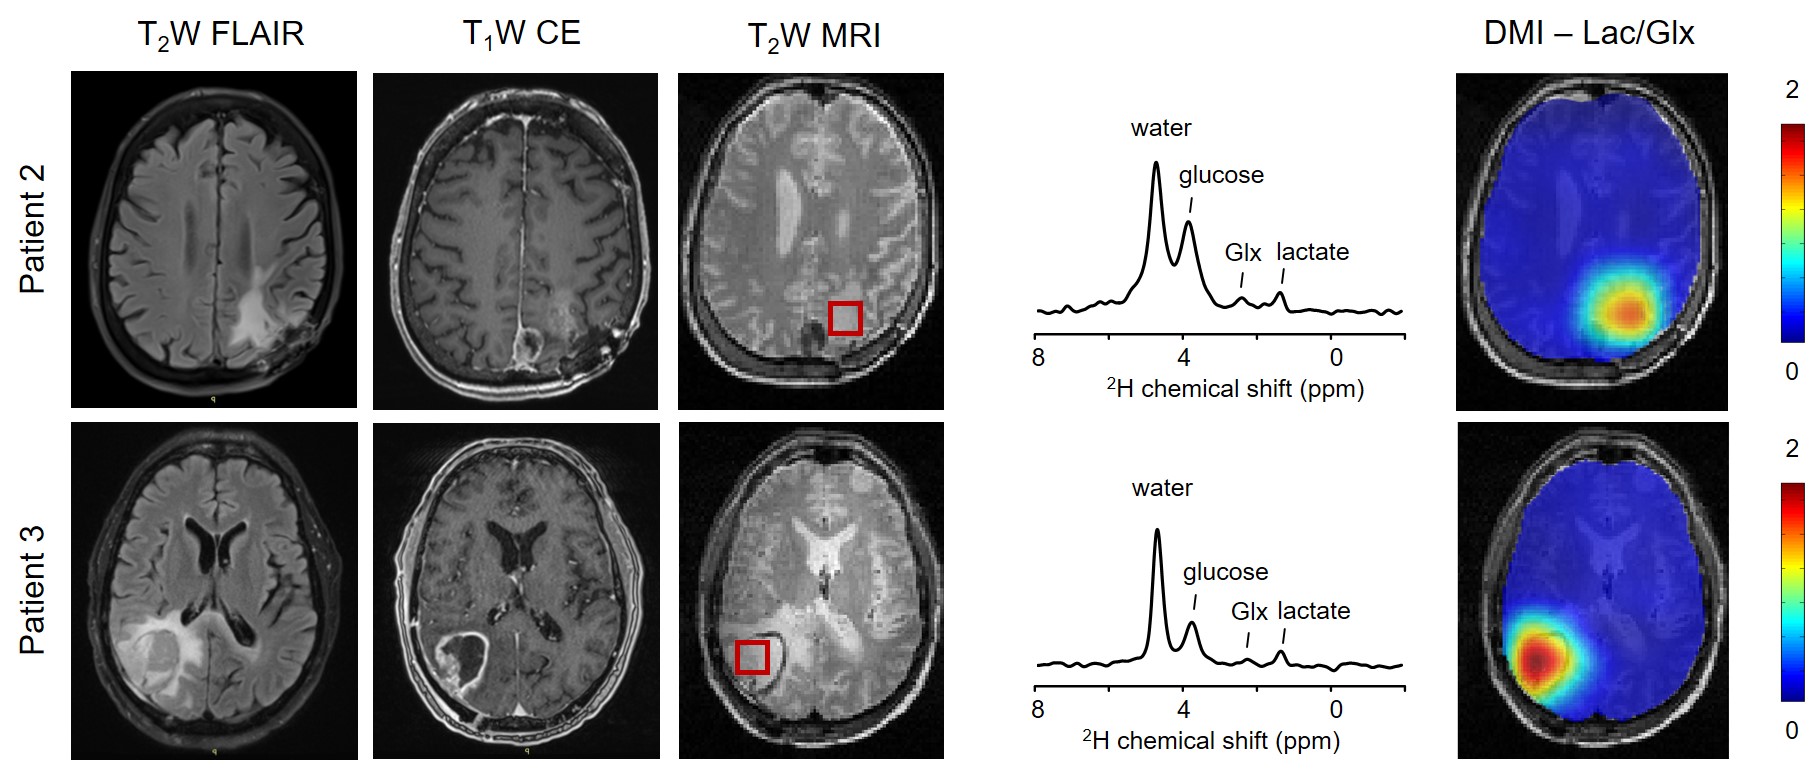
Figure 2. DMI in patients 2 and 3 with
GBM after oral [6,6’-2H2]-glucose intake.
From left to
right: T2W, T1W CE, T2W spin echo images acquired
at the time of DMI study, individual 2H MR spectra originating from
voxels depicted on T2W MRI, and DMI maps of the lactate/Glx, or
Warburg effect. Data are shown for patient 2 (top) and patient 3 (bottom),
both diagnosed with GBM. In both patients, DMI shows stark image contrast on
the lactate/Glx map. Abbreviations: T2W: T2-weighted, FLAIR:
fluid-attenuated inversion recovery, CE: contrast-enhanced, Glx:
glutamate+glutamine, Lac: lactate.
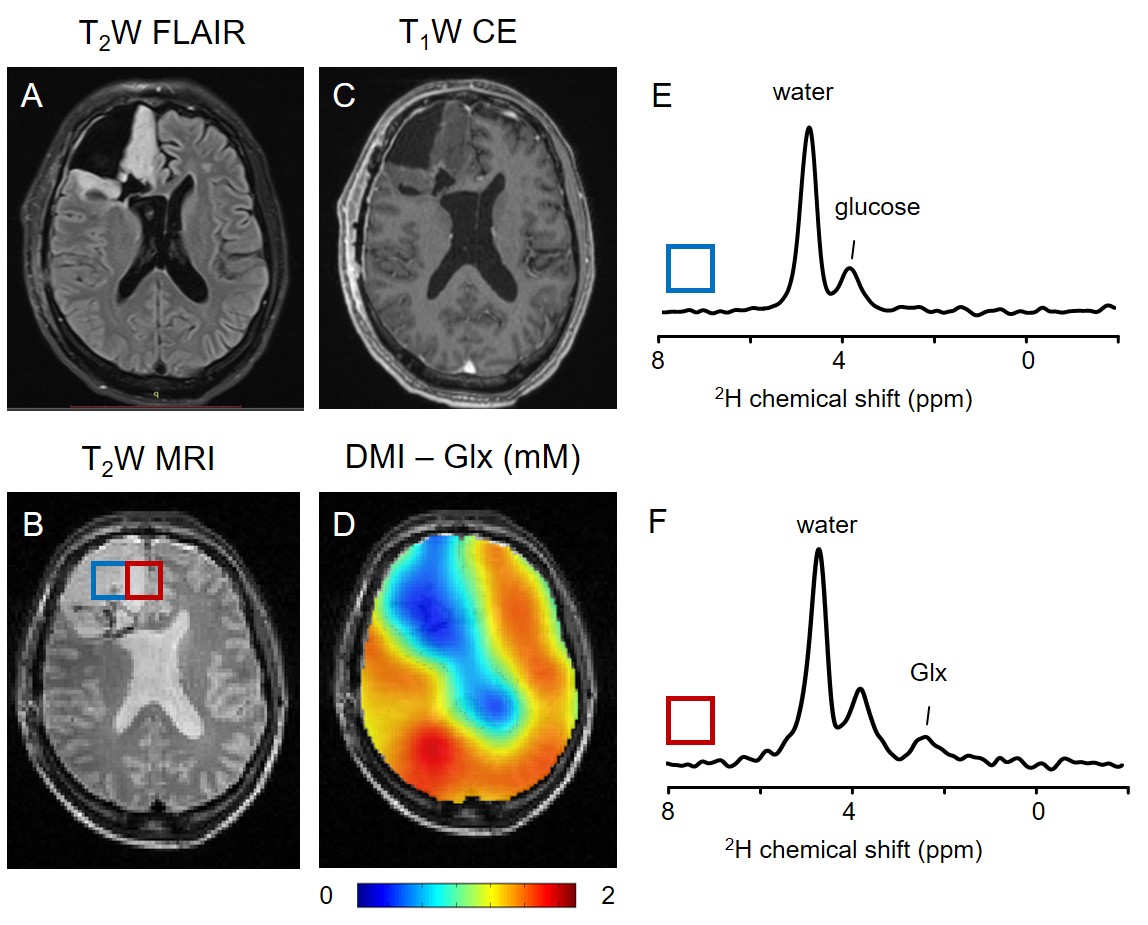
Figure 3. DMI in patient 4 with
anaplastic oligodendroglioma after oral [6,6’-2H2]-glucose
intake. (A, C) T2W
and T1W CE clinical MR images, (B) T2W spin echo image
acquired at the time of DMI study, (D) DMI map of labeled Glx in mM, (E, F)
individual 2H MR spectra from a voxel positioned in the resection
cavity (E, blue) and from a voxel positioned in tumor tissue (F, red). Note the
lack of 2H-labeled lactate in the tumor lesion while a significant
peak of Glx is observed. Abbreviations: T2W: T2-weighted, FLAIR:
fluid-attenuated inversion recovery, CE: contrast-enhanced, Glx:
glutamate+glutamine, Lac: lactate.