0857
GLINT: GlucoCEST in neoplastic tumors at 3 T – preliminary application in glioma patients using optimized preparation, imaging, and post-processing1High-Field Magnetic Resonance, Max Planck Institute for Biological Cybernetics, Tuebingen, Germany, 2Department of Diagnostic and Interventional Neuroradiology, Eberhard-Karls University Tuebingen, Tuebingen, Germany, 3Institute of Neurology, University College London, London, United Kingdom, 4Department of Biomedical Magnetic Resonance, Eberhard-Karls University Tuebingen, Tuebingen, Germany
Synopsis
Dynamic glucoCEST at clinical field strengths is very challenging due to the low effect size. Here, we present a saturation, imaging and post-processing protocol for minimizing possible artifacts to detect dynamic CEST effects reliably, and demonstrate the application in two glioblastoma patients at 3 T.
Introduction
GlucoCEST uptake has already been shown in human brain tumor patients at UHF MRI1–4, yet few first attempts at clinical field strengths were presented. The low effect size in combination with many possible sources of artifacts in a long dynamic measurement (e.g. head movement, B0 field alterations) makes dynamic glucose enhanced (DGE) imaging at 3 T very challenging. Herein, we present an imaging and post-processing protocol for maximizing the CEST effect and correcting for artifacts, to achieve a stable DGE experiment at 3 T, and show first results in two brain tumor patients.Methods
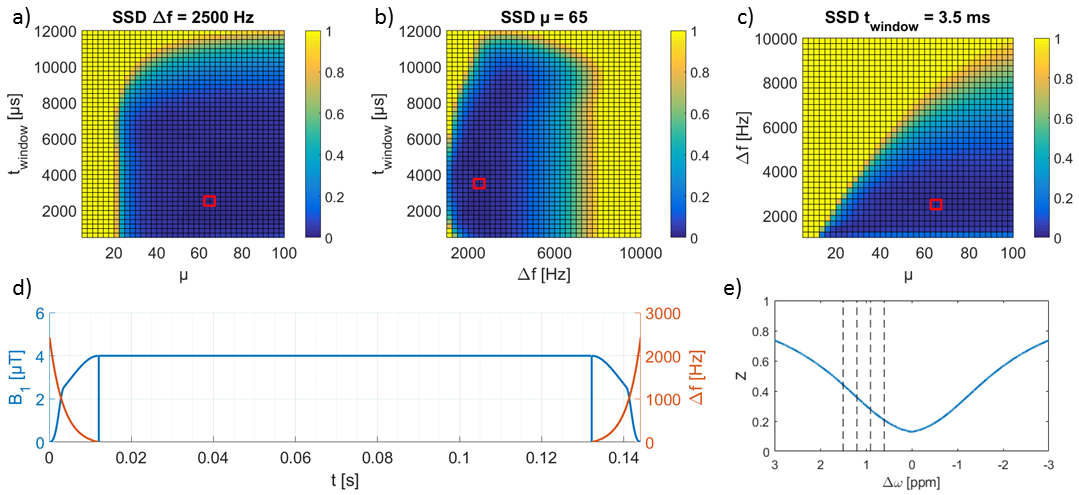
T1ρ-based DGE imaging consisted of a presaturation, using a HSExp5 spin-lock pulse (∆f: 2.5 kHz; µ: 65; twindow: 3.5ms; B1: 4µT; tadia; TSL: 120ms), which was optimized for 3 T (Figure 1), followed by a 3D single-shot GRE readout6,7 (TE: 2ms; TR: 4ms; 700Hz/px; FA: 6°; 12 slices; 2x2x5mm3 voxel size). These imaging parameters were adapted from the original reference to achieve a sufficient SNR at a reasonable voxel size. Scanning was performed at a 3 T Siemens PRISMA using a 64-channel head coil. Images were acquired at 160 time points before, during and after a glucose injection (0.3 mg/kg) with 6.3s temporal resolution (Total: 16:45 min) at five different frequency offsets (-300, 0.6, 0.9, 1.2, and 1.5 ppm; 32 images per offset). Three healthy volunteers were scanned to optimize the motion correction algorithm. The final measurement and post-processing protocol, including optimized motion correction and a dynamic B0 correction8, was then applied in two glioblastoma (IDH wild-type, unmethylated MGMT promoter) patients (1: male, 70y, 2: female, 75y). Z images were generated using the corresponding image at -300 ppm as S0: Zi(∆ω) = Si(∆ω)/Si(-300 ppm) with 1≤i≤32. For 0.6, 0.9, 1.2 and 1.5 ppm, ∆DGE was calculated using the mean of the first five images per offset as a baseline Zref: ∆DGEi(∆ω) = Zref (∆ω) - Zi(∆ω).Results
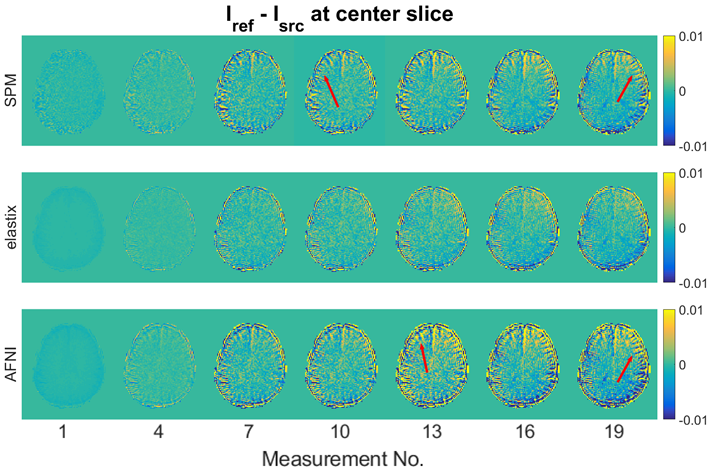
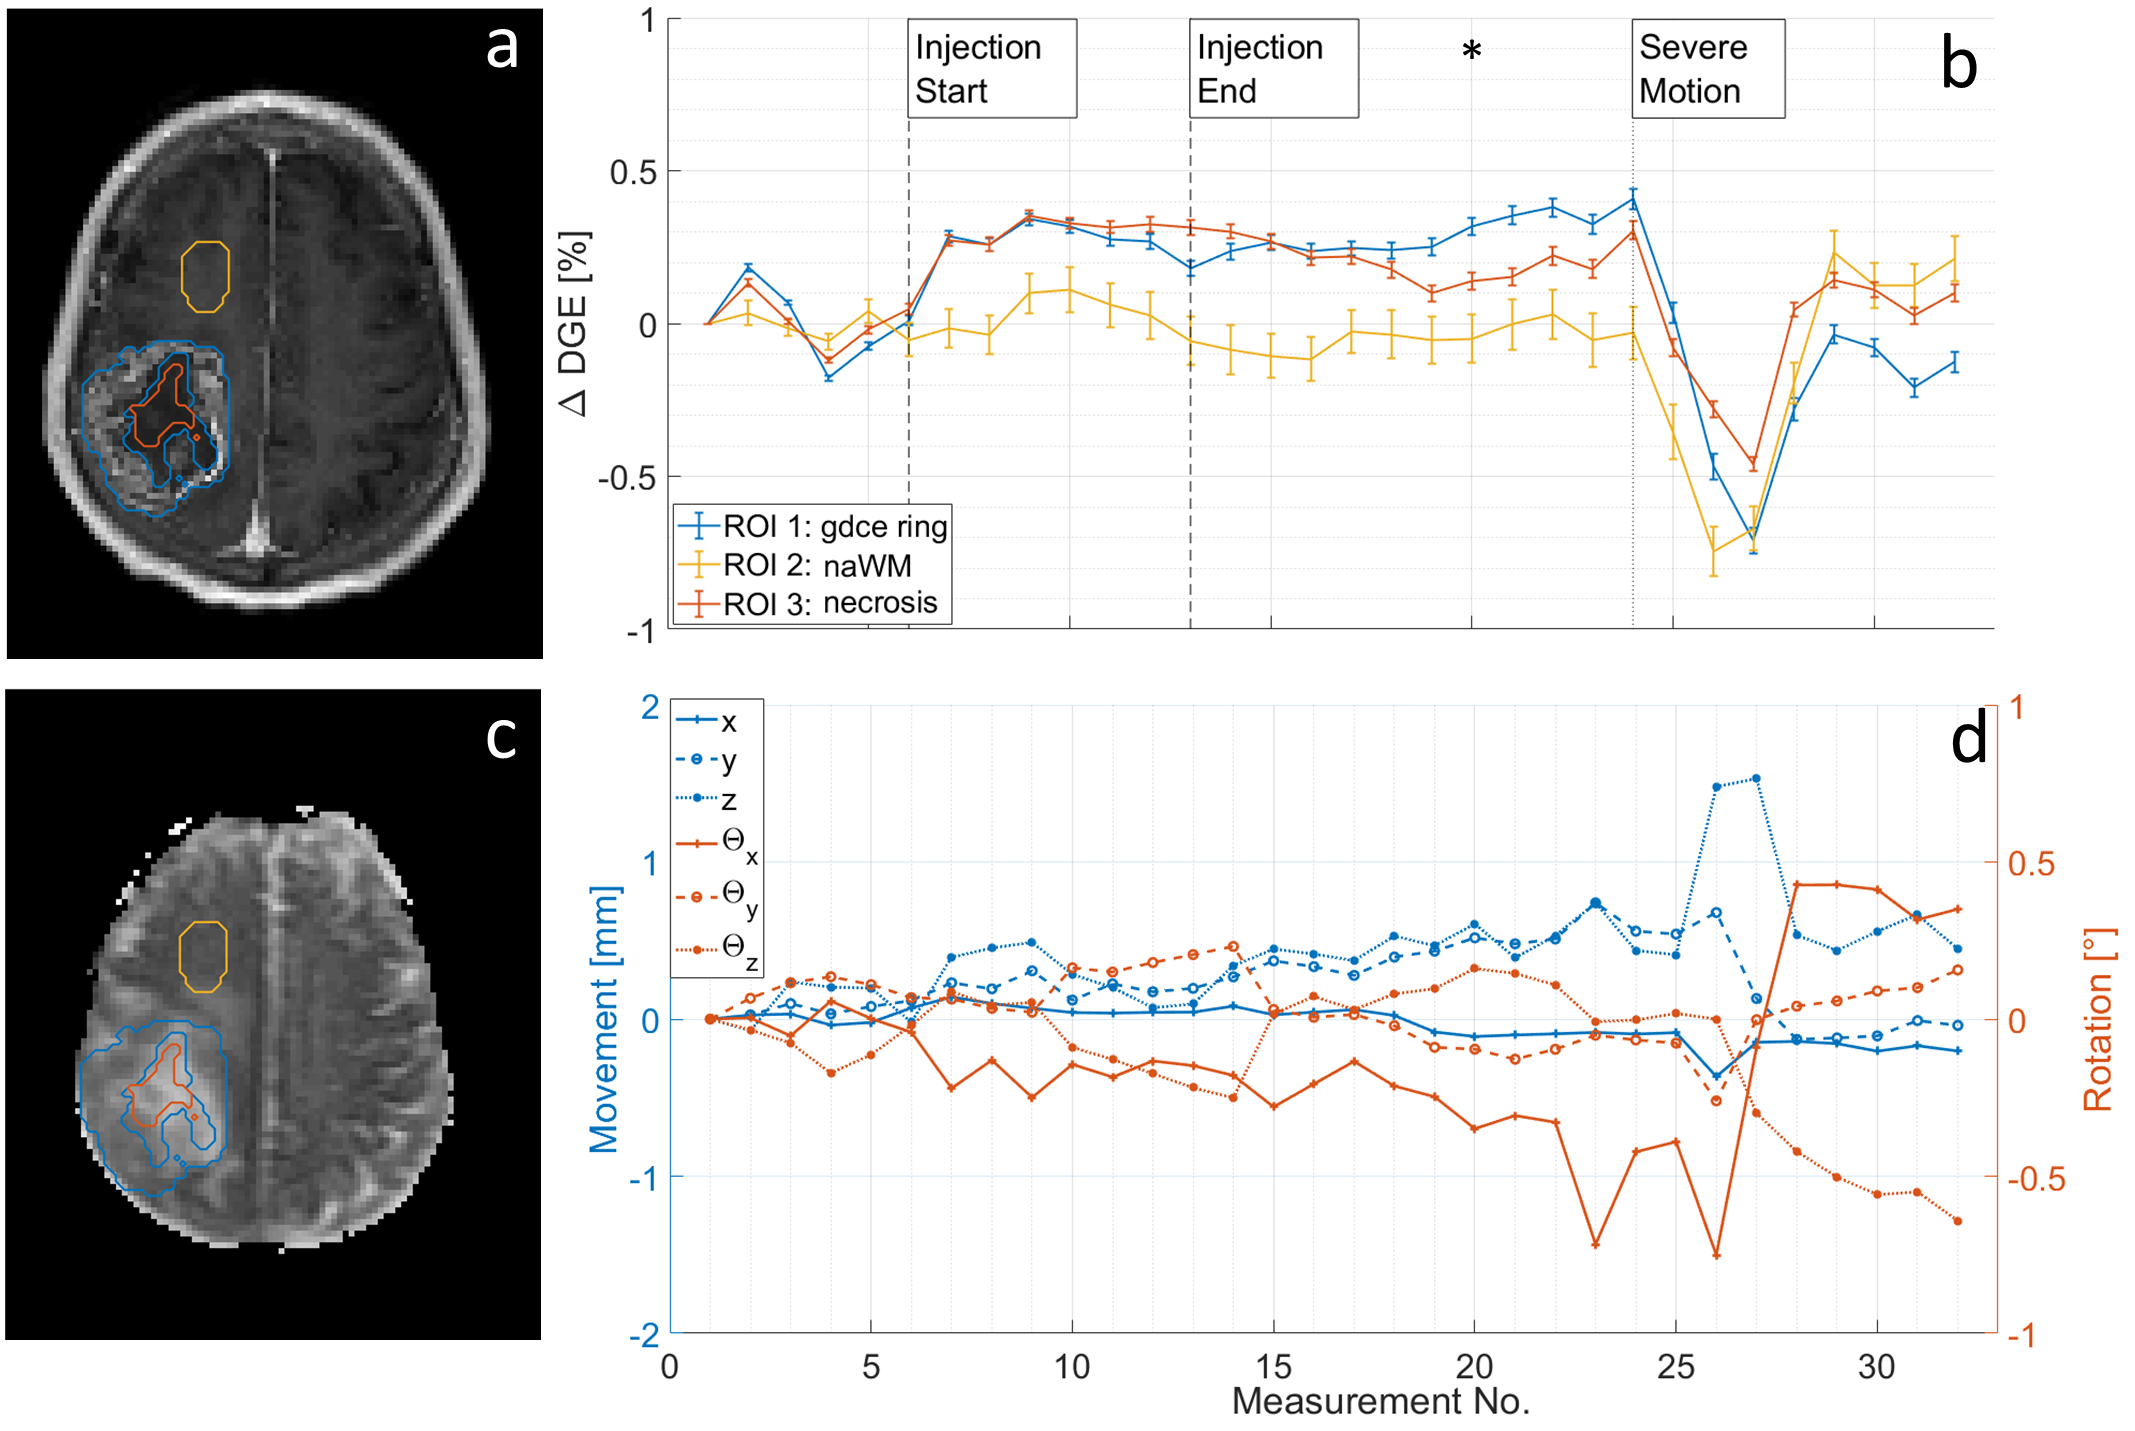
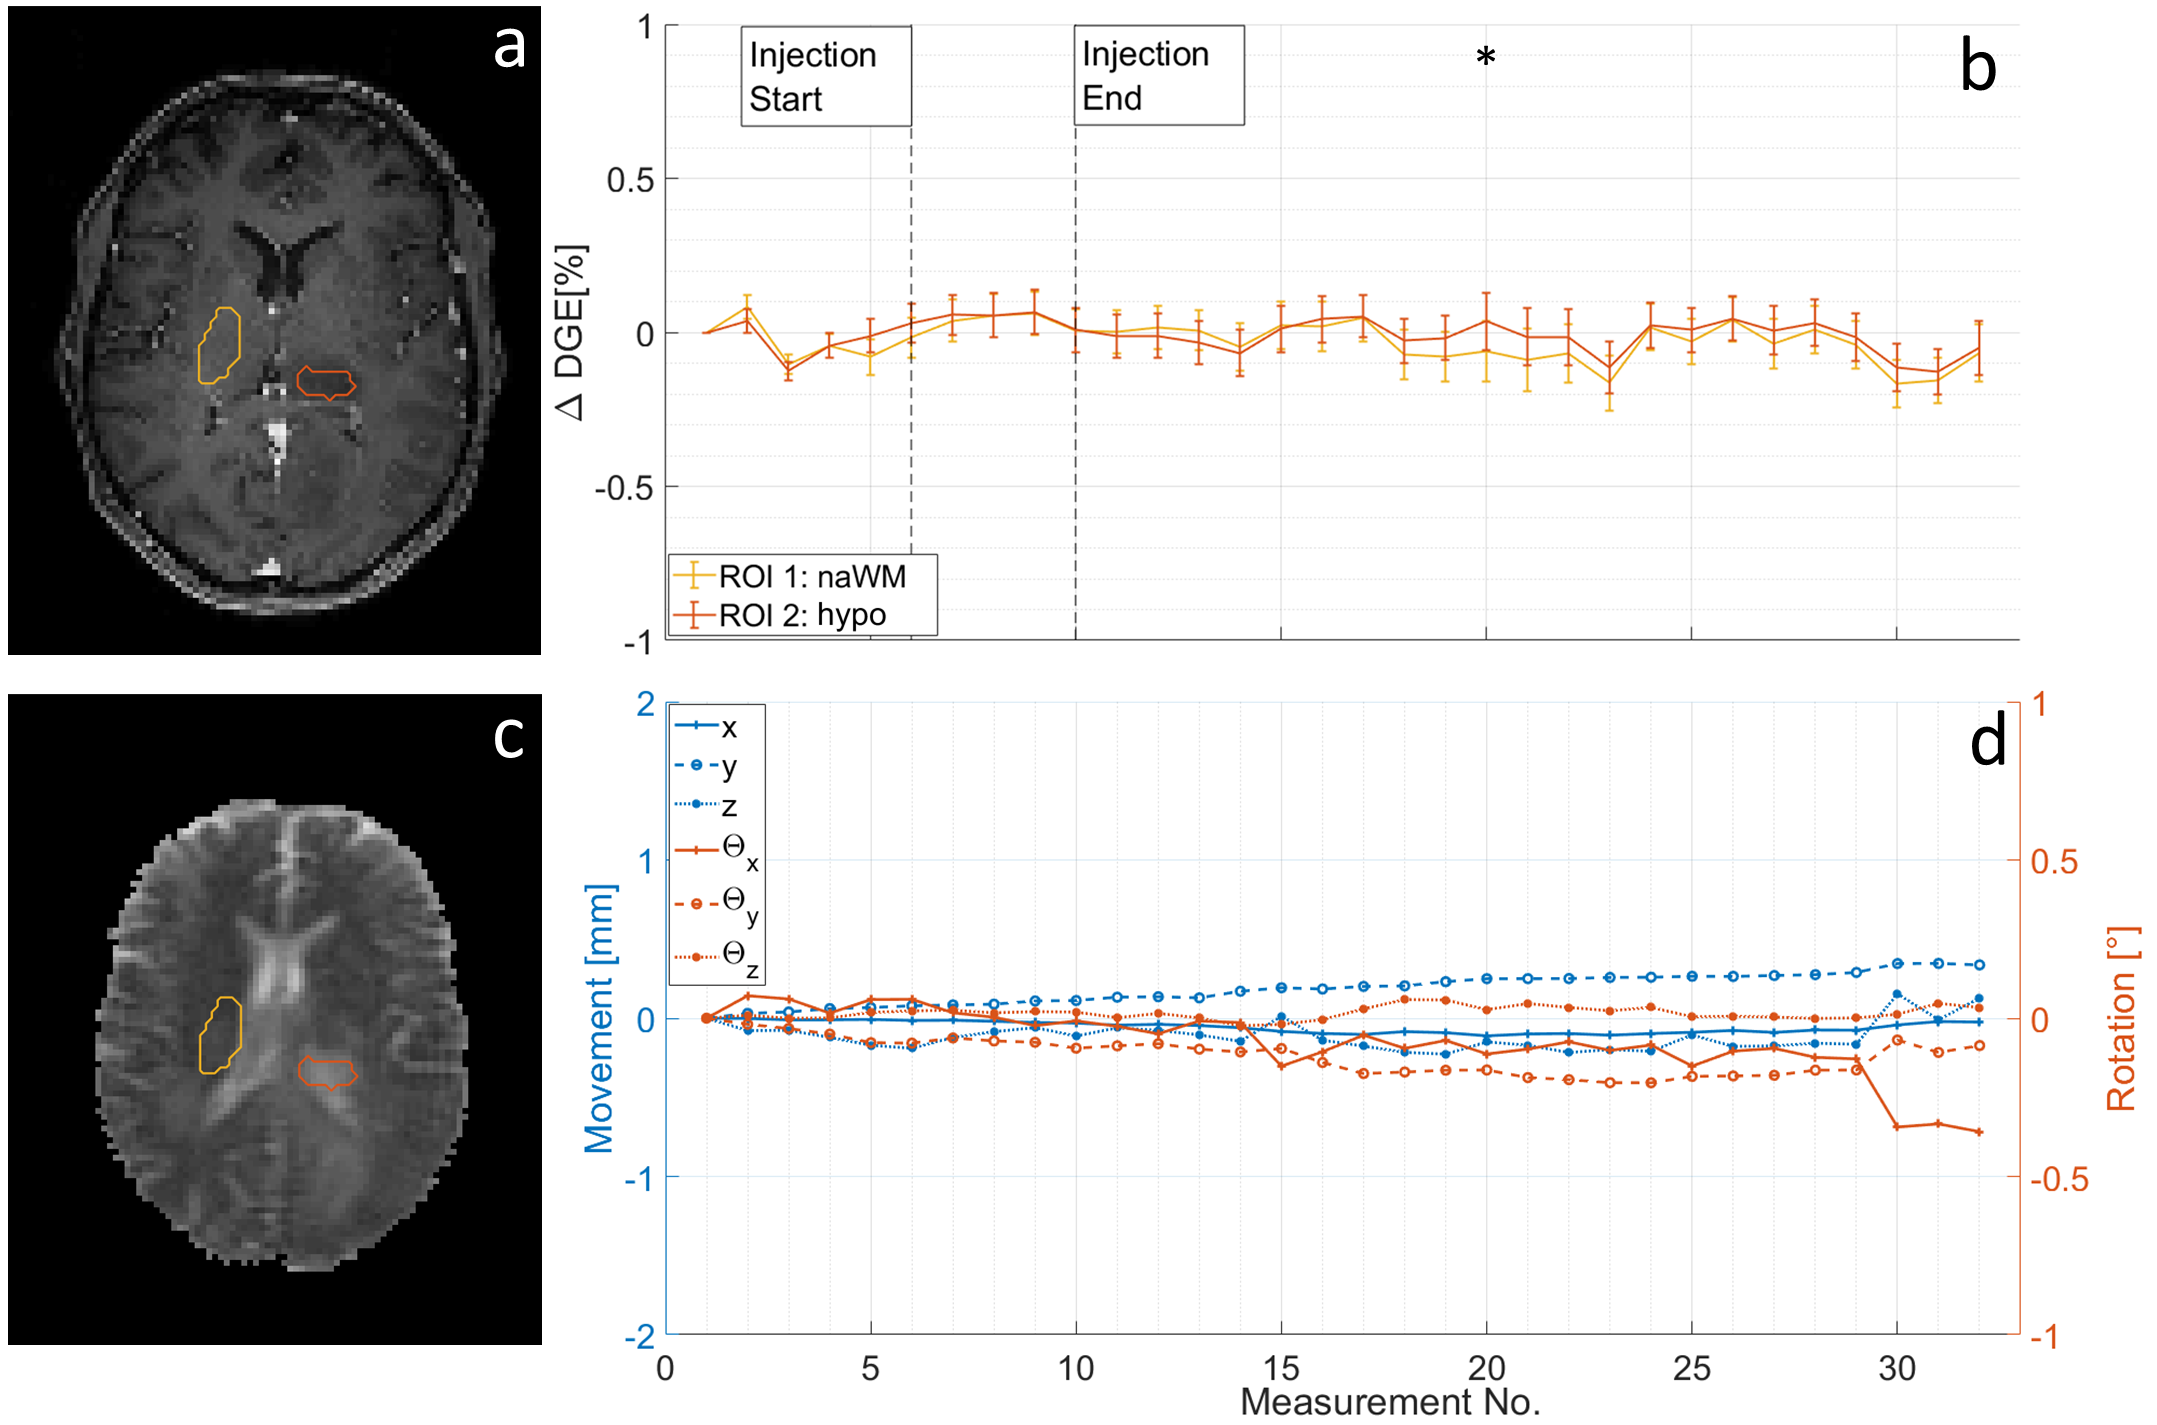
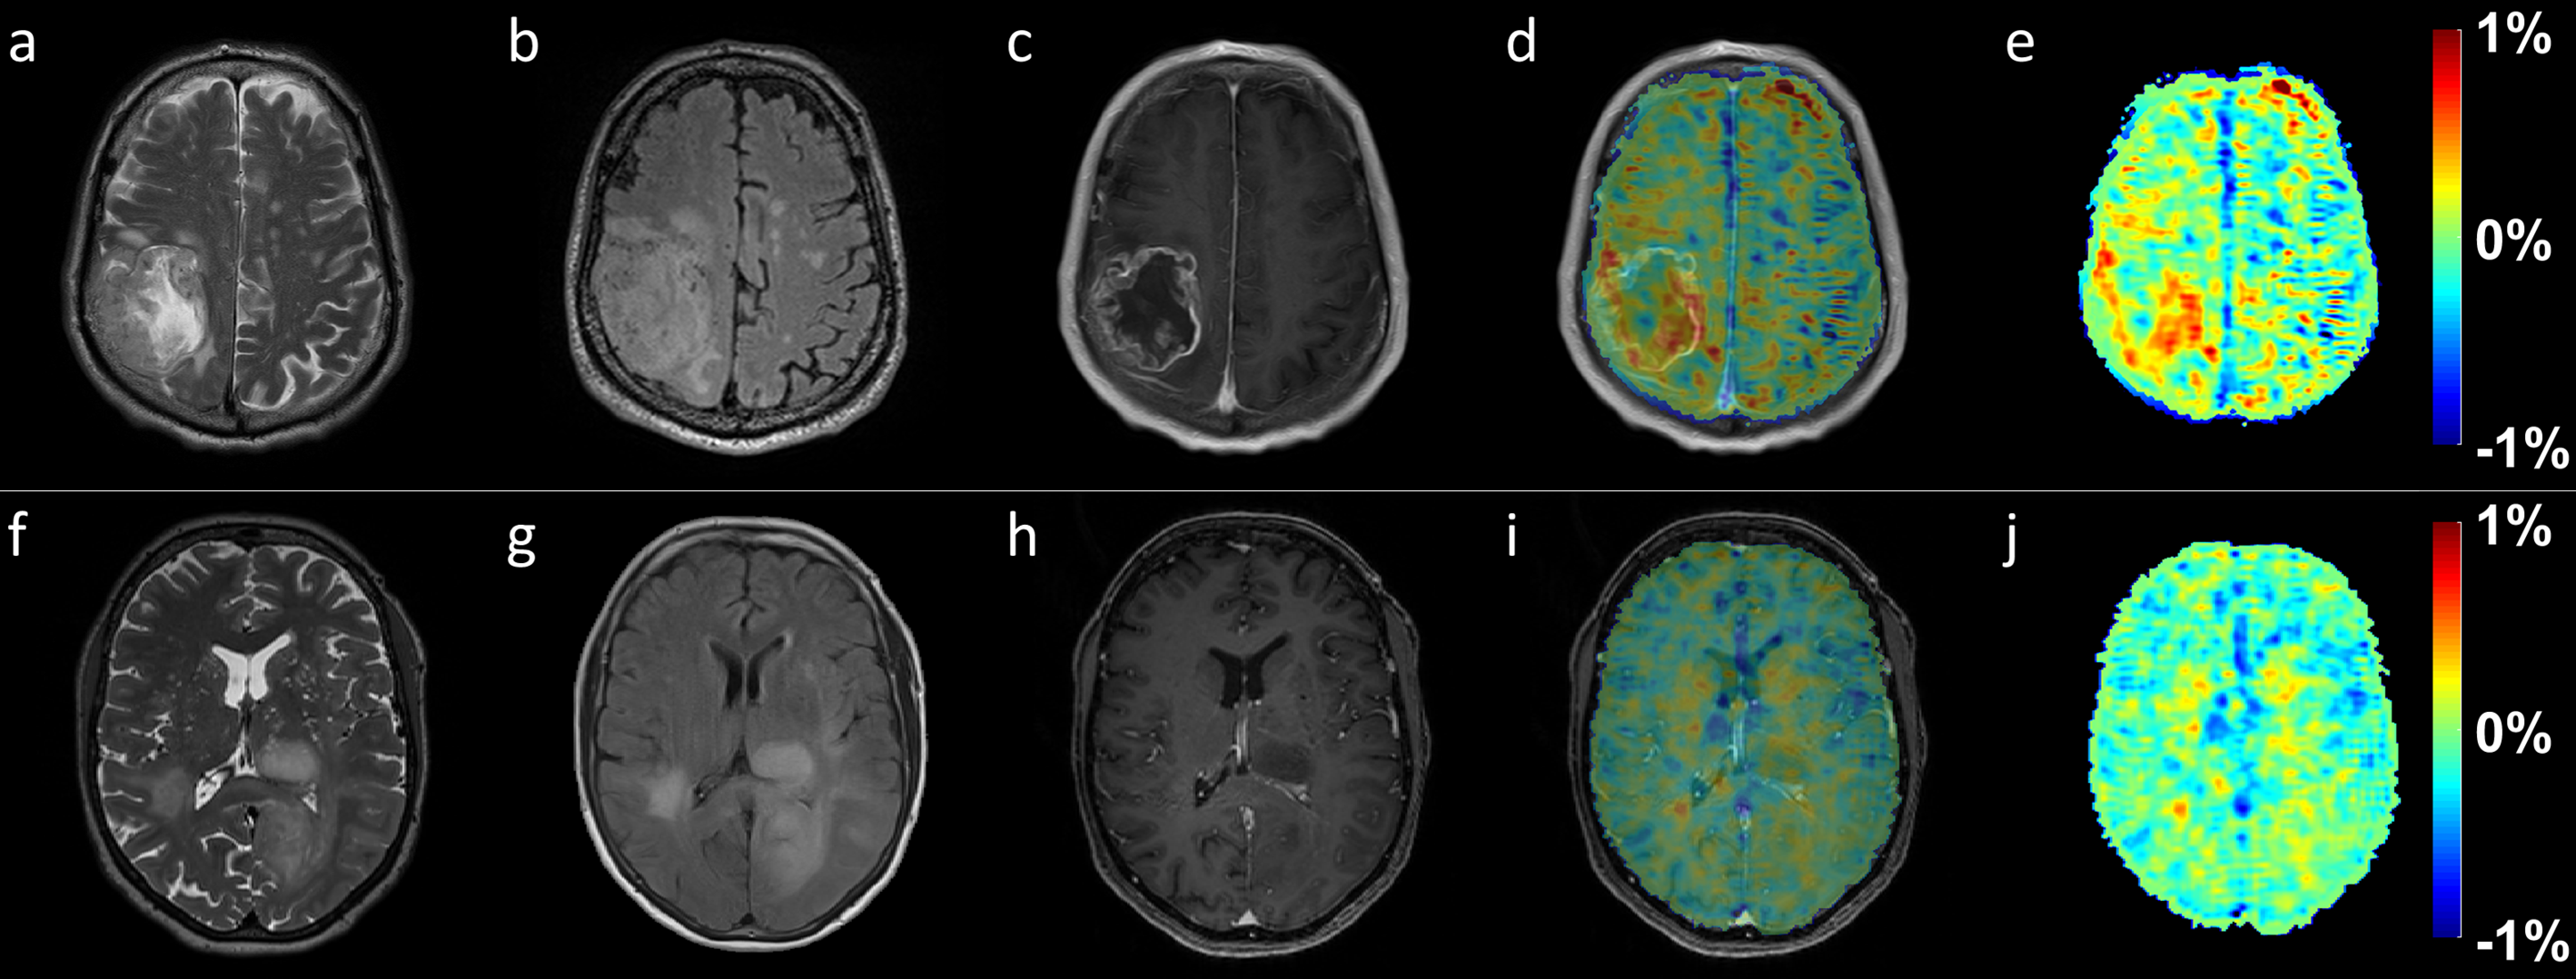
Optimal motion correction was achieved with elastix9 (Figure 2). Highest DGE signal was detected at 0.6 ppm, in accordance with previous simulations (data not shown). Therefore, following results and figures correspond to DGE(∆ω = 0.6 ppm). Patient 1 showed a maximum ∆DGE of 0.38% in a ROI corresponding to a Gadolinium (Gd) enhancing region, approximately 5 minutes post-injection (Figure 3). A ROI in normal appearing WM did not show significant uptake at the same time point (∆DGE = 0.03%). In a necrosis ROI, ∆DGE was increasing as well, but showed an earlier decrease than the Gd-enhanced region. 6 minutes post-injection, the patient had a severe head movement, which could not be retrospectively corrected. Patient 2, with the same tumor histology and grading, showed almost no gadolinium enhancement. Here, neither a normal appearing WM ROI (max. ∆DGE = 0.06%), nor a ROI in a hypointense region in a T1-ce image (max ∆DGE = 0.07%) showed significant DGE contrast (Figure 4). Figure 5 shows the clinical images and an overlaid ∆DGE-map 4 minutes post-injection for Patient 1 (a-e) and 2 (f-j). Correlation between Gd-enhancement and DGE can be seen in Figure 5d.Discussion
As shown in separately submitted Abstracts, an insufficient Motion correction can generate artifacts that can be misinterpreted as dynamic CEST effects. Investigating and correcting for motion is therefore a crucial step for a successful DGE experiment. Even with motion correction, altered coil sensitivities or slab selection due to the motion can cause contrast changes. Here, normalizing by an interleaved M0 scan can help to improve the stability of the contrast. Additionally, B0 field shifts can influence the CEST contrast, and were therefore corrected in the post-processing protocol we presented herein. All these correction methods in combination with an optimized saturation and readout phase led to a stable DGE contrast. First results indicate that the DGE contrast correlates with perfusion altered by blood-brain barrier disruption, in accordance with previous work. These preliminary results must be interpreted carefully, as the effect size was very small at 3 T, and despite all correction steps head motion can have a comparable influence on the contrast.Conclusion
We demonstrated that robust DGE experiments can be accomplished at 3 T by optimizing imaging and post-processing. A maximum effect size of approx. 0.5% could be detected in a tumor ROI and successfully distinguished from normal appearing regions in the brain. First results are promising, but must be validated in further measurements.Acknowledgements
The financial support of the Max Planck Society, German Research Foundation (DFG, grant ZA 814/2-1), and European Union’s Horizon 2020 research and innovation programme (Grant Agreement No. 667510) is gratefully acknowledged.References
1. Xu X, Yadav NN, Knutsson L, et al. Tomography. 2015;1(2):105-114
2. Schuenke P, Koehler C, Korzowski A, et al. Magn Reson Med. 2017;78(1):215-225
3. Schuenke P, Paech D, Koehler C, et al. Sci Rep. 2017;7:42093
4. Paech D, Schuenke P, Koehler C, et al. Radiology. 2017;285(3):914-922
5. Herz K, Gandhi C, Schuppert M, et al. Magn Reson Med. 2018; Epub ahead
6. Zaiss M, Ehses P, Scheffler K. NMR Biomed. 2018;31(4):e3879
7. Deshmane A, Zaiss M, Lindig T. et al. Magn Reson Med. 2018; In press
8. Windschuh J, Zaiss M, Ehses P, et al. Magn Reson Med 2018; Epub ahead
9. Klein S, Staring M, Murphy K, et al. IEEE Trans Med Imaging. 2010;29(1):196-205
10. Cox RW. Comput Biomed Res. 1996;29(3):162-173
11. Collignon, A., Maes, F., Delaere, D. et al. Information processing in medical imaging;1995:263-274
Figures