0856
Multimodal Imaging of Brain Tumors Using High-Resolution 1H-MRSI Without Water Suppression1Radiology department, The Fifth People's Hospital of Shanghai, Fudan University, Shanghai, China, 2Beckman Institute for Advanced Science and Technology, University of Illinois at Urbana-Champaign, Urbana, IL, United States, 3Department of Electrical and Computer Engineering, University of Illinois at Urbana-Champaign, Urbana, IL, United States, 4Institute for Medical Imaging Technology, School of Biomedical Engineering, Shanghai Jiao Tong University, Shanghai, China
Synopsis
The characterization and grading of brain tumors are challenging using conventional MRI technology because of its poor specificity. MRSI has been recognized as a powerful tool for mapping the metabolic fingerprints of tumors. However, existing MRSI methods have poor spatial resolution which limits their practical applications in brain tumor imaging. In this paper, we investigate the use of a high-resolution MRSI technique for multimodal imaging of brain tumors. We demonstrate the capability of performing simultaneous mapping of brain metabolites (at 2.0×2.4×2.0 mm3 nominal spatial resolution), MWF and QSM using our new MRSI technology. This capability enables us to capture metabolic changes of small brain tumors (<10mm3).
Introduction
Conventional MRI has been widely used for detection of brain tumors but its poor specificity has limited its practical utility for tumor characterization and grading1. MR spectroscopy (MRS) and MR spectroscopic imaging (MRSI) have been recognized as a powerful tool for mapping the metabolic fingerprints of tumors1-3. However, existing MRS and MRSI methods have poor spatial resolution and thus limited practical application for imaging small tumors (<10 mm3). In this paper, we investigate the use of high-resolution MRSI for multimodal imaging of brain tumors. We demonstrate a new capability to perform simultaneous mapping of brain metabolites, myelin water fractions (MWF) and iron deposition (through QSM4) by using a recently developed subspace-based imaging technique called SPICE (SPectroscopic Imaging by exploiting spatiospectral CorrElation)5-6. Our study shows that in addition to the QSM and MWF information, we are able to obtain metabolic maps of the whole brain at 2.0×2.4×2mm3 nominal spatial resolution. This capability enables us to capture metabolic changes of both small and large brain tumors.Methods
We used the latest SPICE technology to acquire MRSI, MWF and QSM data from patients recruited for the study with approval by the Institutional Review Board of the Fifth People's Hospital of Shanghai, China. The data acquisition scheme has the following novel features: a) FID acquisitions with an ultrashort-TE (1.6 ms) and very-short-TR (160 ms), b) no water/lipid suppression, c) variable density sampling of (k, t)-space, d) rapid and extended k-space coverage with EPSI trajectories, and e) incorporation of navigators for detection and correction of field drifts and subject head motions. The data acquisition scheme achieves a nominal resolution of 2.0×2.4×2.0 mm3 with whole brain coverage (FOV: 230×230×72 mm3) in a 5-minute scan.
Reconstruction of the spatiospectral function from the SPICE data was accomplished using a union-of-subspaces model, incorporating pre-learned spectral basis functions5,7,11. These spectral basis functions include the resonance structures of the detectable molecules (generated using quantum mechanical simulations) and their lineshape functions (pre-learned from training data). Spectral quantification was done using an improved LCmodel-based algorithm that incorporates both spatial and spectral priors12. QSM and MWF were estimated from the unsuppressed water spectroscopic signals collected at the same time with the MRSI data6-8. All the data were collected on a 3T scanner Siemens Skyra scanner using a 32-channel head coil.
The study includes patients with both large and small brain tumors (e.g., glioblastoma and brain metastases), who had received a combined MR and PET-CT examination before the study. As part of the study, brain structural information was also obtained using 3D MPRAGE imaging (1.0×1.0×1.0 mm3, FOV = 256 mm, TR = 2500 ms, TE = 2.26 ms, TI = 900 ms, 176 slices), and T2-weighted fluid attenuated inversion recovery (FLAIR) imaging (0.5×0.5×2.0 mm3, FOV = 240 mm, TR = 9000 ms, TE = 89 ms, 82 slices).
Results and Discussion
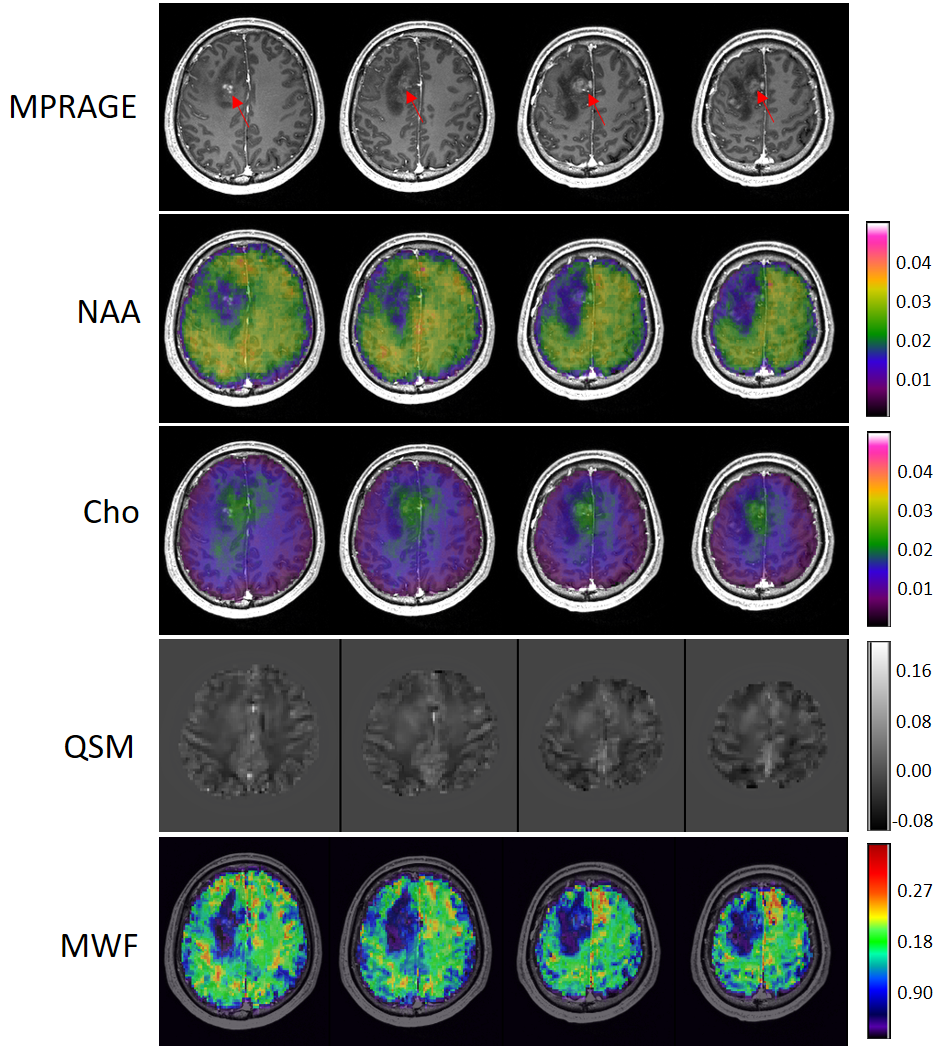
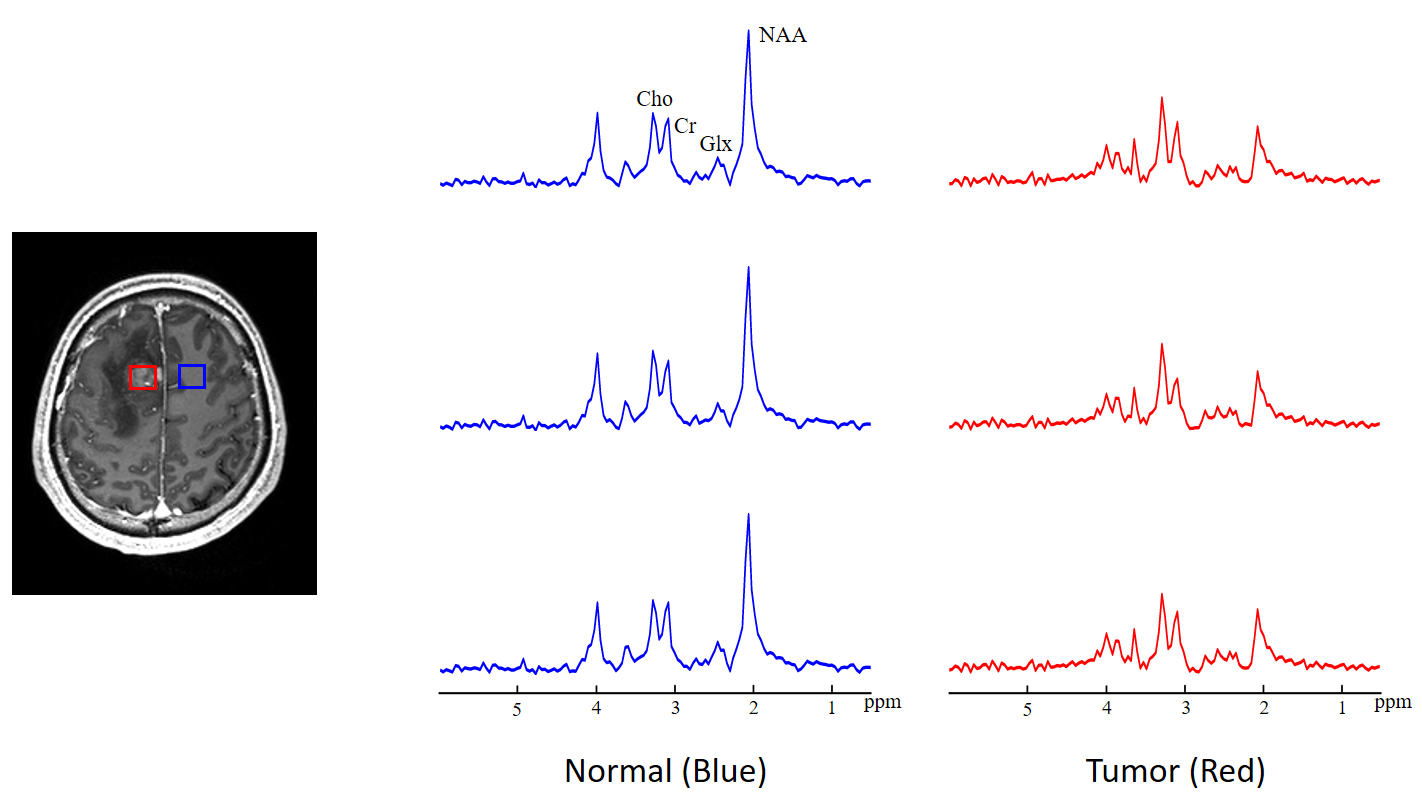
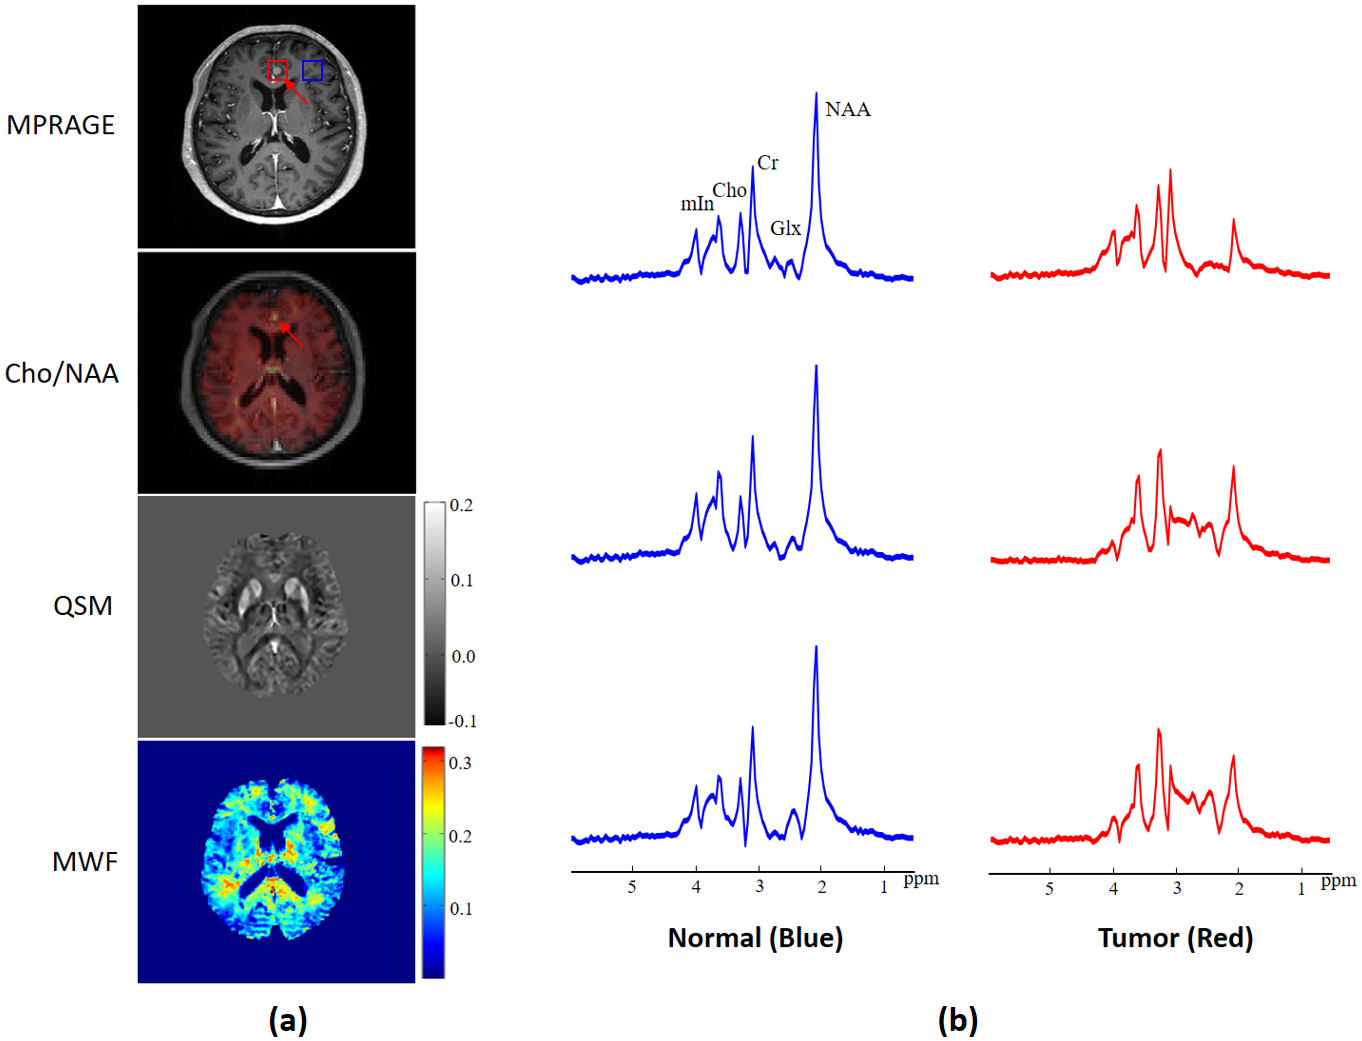
Figure 1 illustrates representative maps of NAA, Cho, QSM and MWF across the brain, obtained from a patient with a glioma. Figure 2 compares the spatially resolved spectra within the tumor and its contralateral normal region. Decreased NAA and increased Cho levels can be clearly observed within the lesion, indicating neuronal loss and cell membrane turnover1-3. We have also observed decreased MWF in the tumor, which suggests that the axonal loss occurs. Elevated QSM values can be seen as well, which may be related to decreased oxygen saturation in the tumor that leads to an increased iron deposition10. Figure 3 illustrates the results obtained from a patient with brain metastases (primary site in the breast). As can be seen, even with this small tumor (<10 mm3), elevated Cho/NAA as well as decreased MWF levels can still be detected by our ultrahigh-resolution MRSI technique. For this case, QSM does not show significant changes between lesion and normal regions.Conclusions
This work demonstrates the feasibility of multimodal imaging of brain tumors using high-resolution 1H-MRSI without water suppression. With this new technique, the data acquisition time can be shortened to 5 min to cover an FOV of 230×230×72 mm3. The nominal spatial resolution for QSM and MWF maps is 2.0×2.4×2.0 mm3 and 2.0×2.4×3.0 mm3 for the metabolic maps. Our experimental results show that this resolution capability can capture metabolic changes of small brain tumors (such as brain metastases) which are usually unobservable using conventional MRSI techniques.Acknowledgements
This work is supported by National Science Foundation of China (No.61671292 and 81871083) and shanghai municipal commission of health and family planning (No. 20154Y0094).References
1. Kauppinen RA, Peet AC. Using magnetic resonance imaging and spectroscopy in cancer diagnostics and monitoring: preclinical and clinical approaches. Cancer Biol Ther. 2011;12(8):665-679.
2. Horská A, Barker PB. Imaging of brain tumors: MR spectroscopy and metabolic imaging. Neuroimag Clin. 2010;20(3):293-310.
3. De Graaf RA. In vivo NMR spectroscopy: principles and techniques. John Wiley & Sons. 2013.
4. Deistung A, Schweser F, Wiestler B, et al. Quantitative susceptibility mapping differentiates between blood depositions and calcifications in patients with glioblastoma. PloS One. 2013;8(3):e57924.
5. Lam F, Ma C, Clifford B, et al. High‐resolution 1H‐MRSI of the brain using SPICE: data acquisition and image reconstruction. Magn Reson Med. 2016;76(4):1059-1070.
6. Peng X, Lam F, Li Y, et al. Simultaneous QSM and metabolic imaging of the brain using SPICE. Magn Reson Med. 2018;79(1):13-21.
7. Ma C, Lam F, Johnson CL, et al. Removal of nuisance signals from limited and sparse 1H MRSI data using a union‐of‐subspaces model. Magn Reson Med. 2016;75(2):488-497.
8. Du Y, Chu R, Hwang D, et al. Fast multislice mapping of the myelin water fraction using multicompartment analysis of T2* decay at 3T: A preliminary postmortem study. Magn Reson Med. 2007;58(5):865-870.
9. Wang Y, Liu T. Quantitative susceptibility mapping (QSM): decoding MRI data for a tissue magnetic biomarker. Magn Reson Med. 2015;73(1):82-101.
10. Mittal S, Wu Z, Neelavalli J, et al. Susceptibility-weighted imaging: technical aspects and clinical applications, part 2. Am J Neuroradiol. 2009;30(2):232-252.
11. Lam F, Liang, ZP. A subspace approach to high‐resolution spectroscopic imaging. Magn Reson Med. 2014;71(4):1349-1357.
12. Li Y, Lam F, Clifford B, et al. A subspace approach to spectral quantification for MR spectroscopic imaging. IEEE Trans Biomed Eng. 2017;64(10):2486-2489.
Figures