0853
Glutamine Mediated Citrate Elevation- A ‘Metabolic-Rearrangement’ for Proliferation in High Grade Tumors: In vivo MRS Studies at 3T1UT Southwestern Medical Center, Dallas, TX, United States, 2Philips Healthcare, Andover, MA, United States
Synopsis
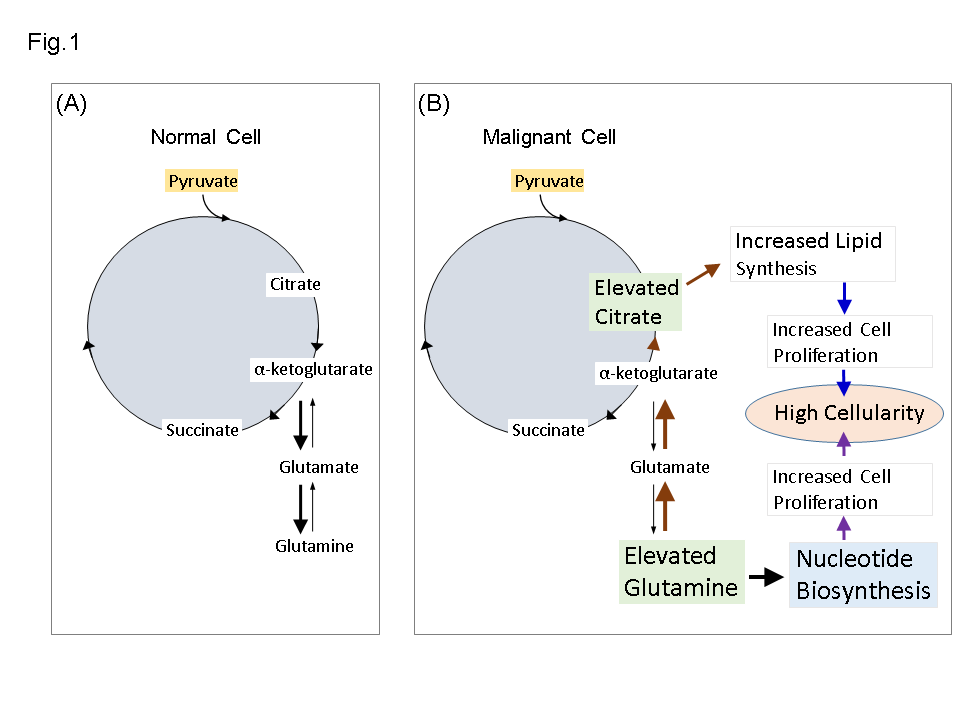
Although substantial progress has been made in deciphering genetic and histological events in cancers, metabolic rearrangements that provide building blocks to elicit uncontrolled proliferation in cancers is still not understood. Nucleotide and lipids are the basic units needed for cell proliferation and membrane synthesis. Our in vivo MRS studies at 3 T in glioma patients indicate that tumors rearrange glutamine metabolism to produce citrate for increased lipid biosynthesis for membrane formation, and nucleotide for cell-multiplication.
Introduction
Tumors may reprogram their metabolism to meet the demands of rapid cell-proliferation. Nucleotides for DNA and RNA-biosynthesis and lipids for membrane-synthesis are the major requirements of an aggressively proliferating cell. Glutamine (Gln) is the precursor for de-novo synthesis of pyrimidine-nucleotides while citrate (Cit), a TCA cycle intermediate, is a major precursor for fatty acid or lipid-synthesis. A mass-spectroscopy study in cancer-cell-lines showed increased Gln-metabolism 1. Cit has been shown to be elevated in high-grade gliomas 2. We hypothesized that a subset of malignant-gliomas will reprogram the Gln and Cit metabolism to meet the demands of rapid cell-proliferation. Reductive-carboxylation of Gln will remodel the TCA-cycle towards increased Cit production for enhanced lipid synthesis. Cit, whose resonance is centered at 2.6 ppm, is not measureable by MRS in- vivo in healthy-brain owing to its low concentration and spectral-overlap with neighboring-resonances from N-Acetylaspartate (NAA-Asp) and aspartate (Asp) around 2.6 ppm. Here, we have reliably measured Cit together with Gln, 2-Hydroxyglutarate (2HG) and other tumor relevant metabolites in glioma patients in vivo at 3T using an in house customized PRESS TE 97 ms 1H MRS-sequence. The association of Gln and Cit elevation with clinical MR-features of malignancy such as ‘enhancement on T1-weighted post gadolinium-images’ was also evaluated.Methods
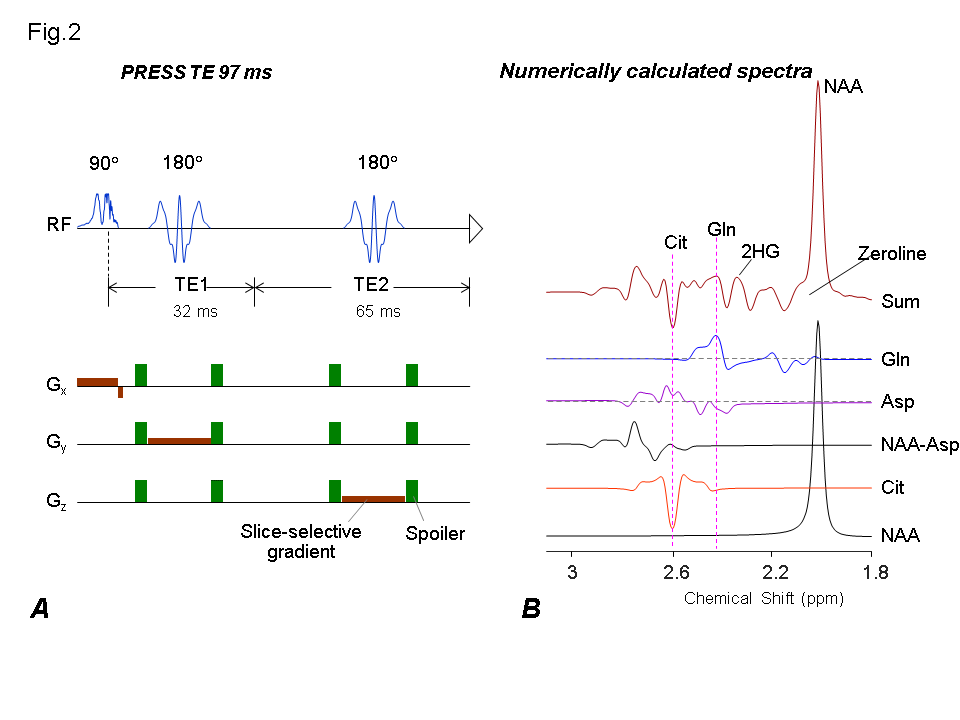
A PRESS sequence was tailored for Cit detection using volume localized density-matrix simulations 3. The PRESS sequence included a 9.8-ms 90° pulse (bandwidth, 4.2 kHz) and two 13.2-ms 180° RF-pulses (bandwidth, 1.3 kHz) at an RF field-intensity of 13.5 µT. In-vivo 1H MR measurements were performed in 20 high-grade glioma-patients on a whole-body 3T scanner (Philips Medical Systems). PRESS spectra were obtained from tumors identified by T2-weighted fluid-attenuated inversion-recovery (T2-FLAIR) imaging. The T1-weighted Post-gadolinium images were obtained at the 3T scanners at Roger’s Cancer Imaging Center. The MRS voxel-size was 3-8 mL depending on the tumor volume. MRS acquisition parameters included TR=2s, sweep width=2.5 kHz, sampling-points=2048 with signal-averages of 128-256 depending on the voxel-size. Unsuppressed-water was obtained with a short-TE (14 ms) STEAM-sequence with TR=20s as a reference for metabolite-quantification. Spectral-fitting was performed with LCModel-software 4 using numerically-calculated basis-spectra of 22-metabolites. Metabolite concentrations were calculated by setting the mean total-Creatine estimate of the medial-occipital brain from healthy-subjects at 8 mM. Proliferative-index and Isocitrate-dehydrogenase (IDH) mutations were identified through immunohistochemistry using antibodies against MIB-1 and IDH respectively as performed previously 5, 6.Results and Discussion
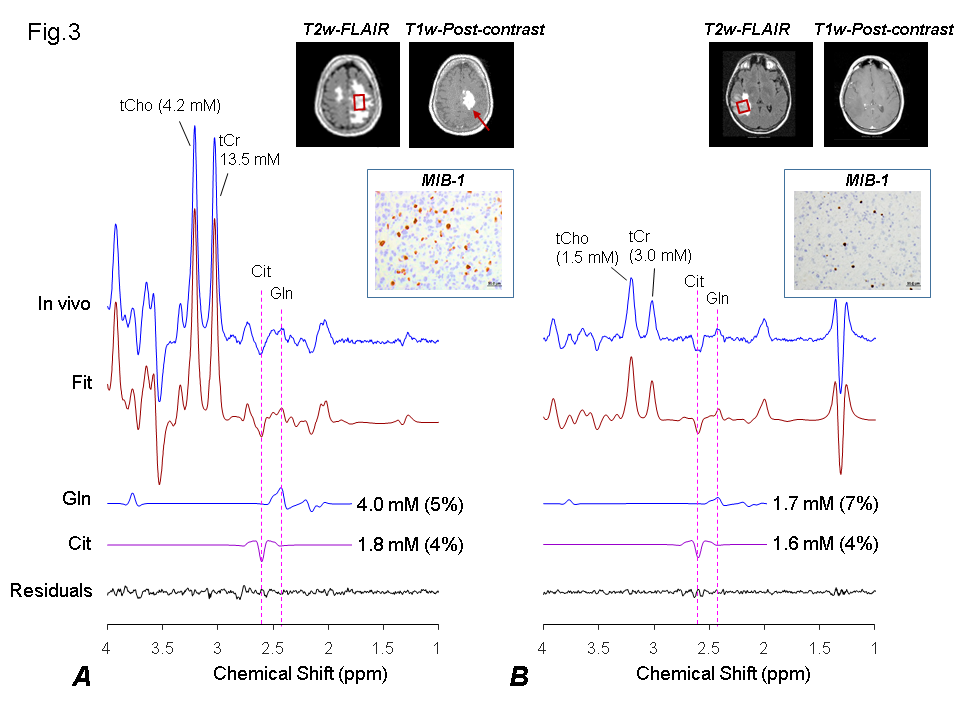
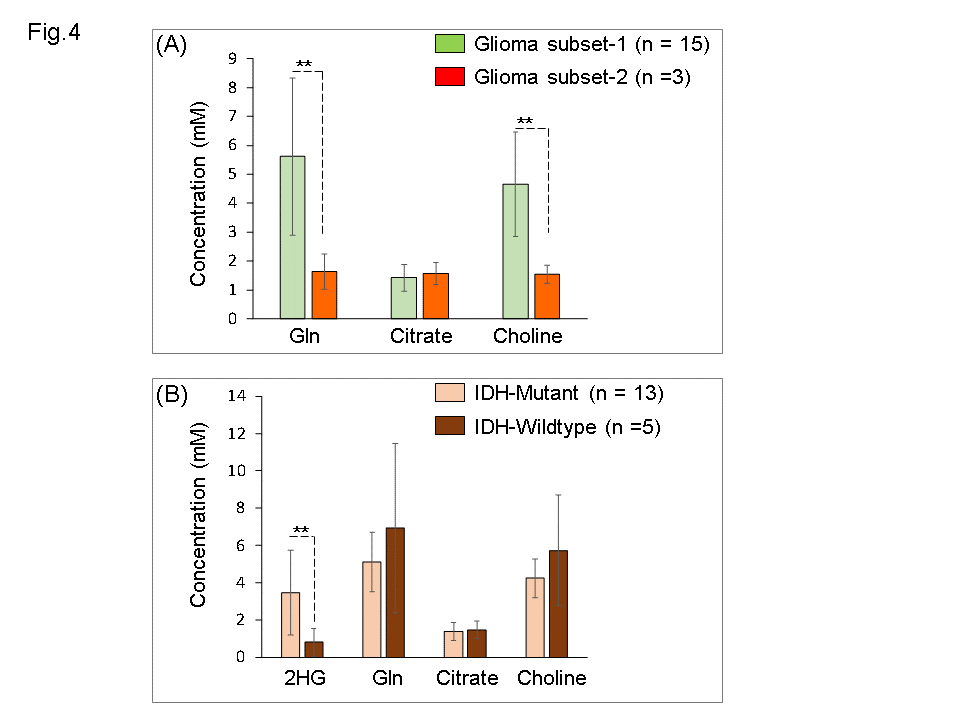
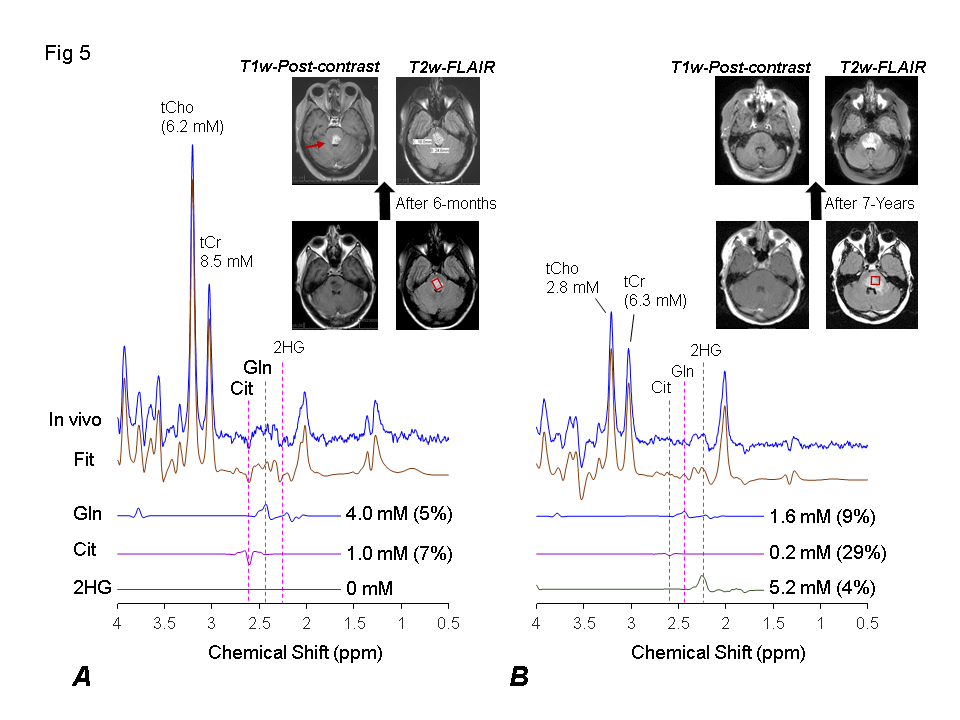
The PRESS TE 97 ms sequence provided well discernible signal of Gln at 2.4 ppm, a negative polarity signal of Cit at 2.6 ppm without overlap from adjoining positive polarity signals of NAA-Asp and Asp, and 2HG at 2.25 ppm (Fig.2). Of the 20 patients, 18 had biopsy-proven Anaplastic-gliomas (grade 3) or glioblastoma (grade 4), while the other 2 patients had brain-stem glioma. Of the 18 high-grade gliomas, concurrent elevation of Gln and Cit was estimated in 15 of the gliomas. These tumors with elevated-levels of Gln and Cit presented with enhancement on the T1-w Post contrast-image indicative of broken blood-brain-barrier (Fig. 3A). These 15 gliomas were grouped as subset-1 while the other 3 gliomas that had elevated Cit without elevation in Gln (Fig. 3B) were grouped as subset-2 (Fig. 4A). Cit was not significantly different between the two-subset of gliomas (1.4±0.5 vs. 1.6±0.4 mM). However, subset-1 had significantly high total-choline (tCho) (4.7±1.8 vs 1.6±0.3 mM, p<0.01) together with high (13%) MIB-1 labeling index of proliferation compared to subset-2. Since tCho is considered to be a cellularity marker, a finding of high tCho and high MIB-1 in the tumors with elevated Gln and Cit indicates that the tumors have high tumor-cellularity and cell-multiplication competence: typical of high-grade tumors. 13 of the 18 gliomas were IDH-mutant with high level of 2HG (Fig. 4B). Elevated levels of Gln and Cit in IDH-mutant gliomas were not significantly different compared to IDH wild-types (Fig. 4B). Noticeably, of the two brain-stem gliomas, one presented with elevated Gln and Cit while other had low Cit with normal Gln levels (Fig. 5). The brain-stem glioma with elevated Gln and Cit progressed within 6-months and showed enhancement on the T1w post-gadolinium images but the other brain-stem remained stable for almost 7-years without enhancement or progression.Conclusion
A subset of high-grade tumors undergoes a metabolic-rearrangement of concurrent elevation in Gln and Cit to attain malignant characters such as high-cellularity, uncontrolled proliferation and blood-brain-barrier breakdown. IDH mutant and wildtype gliomas may share a common metabolic rearrangement of glutamine-mediated-citrate-elevation to attain malignancy. Measurement of elevated Gln and Cit together may serve as a potential ‘imaging-biomarker’ for identifying malignant-gliomas.Acknowledgements
This study was supported by National Cancer Institute of the National Institutes of Health under Award Number R01CA184584 and by a Cancer Prevention Research Institute of Texas grant RP130427References
1. Fendt SM, Bell EL, Keibler MA, et al. Reductive glutamine metabolism is a function of the α-ketoglutarate to citrate ratio in cells. Nat Comm. 2013;4:2236-2247.
2. Choi C, Ganji SK, Madan AK, et al. In Vivo Detection of Citrate in Brain Tumors by 1H Magnetic Resonance Spectroscopy at 3T. Magn Res Med.2014;72:316-323.
3. Choi C, Ganji SK, Deberardinis RJ, et al. 2-hydroxyglutarate detection by magnetic resonance spectroscopy in IDH-mutated patients with gliomas. Nat Med. 2012;18(4):624-629.
4. Provencher SW, et al. Estimation of metabolite concentrations from localized in vivo proton NMR spectra. Magn Res Med.1993;30:672-679.
5. Daoud EV, Rajaram V, Cai C et al. Adult brainstem gliomas with H3K27M mutation, Pathology, and Prognosis. J. Neuropathol Exp Neurol. 2018;77(4):302-311
6. Choi C, Raisanen JM, Ganji SK et al. Prospective longitudinal analysis of 2-Hydroxyglutarate: Magnetic Resonance Spectroscopy Identifies Broad Clinical Utility for the Management of Patients with IDH-Mutant Glioma. J. Clin Oncol. 2016;34(33):4030-4039
Figures