0851
Association between tumor acidity and hypervascularity within human gliomas using pH-weighted amine chemical exchange saturation transfer echoplanar imaging (CEST-EPI) and dynamic susceptibility contrast (DSC) perfusion MRI at 3T1Department of Radiology, People’s Liberation Army General Hospital, Beijing, China, 2Brain Tumor Imaging Laboratory (BTIL), Center of Computer Vision and Imaging Biomarker, David Geffen School of Medicine, University of California, Los Angeles, Los Angeles, CA, United States, 3Department of Bioengineering, Henry Samueli School of Engineering and Applied Science, University of California, Los Angeles, Los Angeles, CA, United States, 4Department of Radiological Sciences, David Geffen School of Medicine, University of California, Los Angeles, Los Angeles, CA, United States, 5Department of Neurosurgery, David Geffen School of Medicine, University of California, Los Angeles, Los Angeles, CA, United States, 6UCLA Brain Research Institute (BRI), David Geffen School of Medicine, University of California, Los Angeles, Los Angeles, CA, United States, 7Department of Neurology, David Geffen School of Medicine, University of California, Los Angeles, Los Angeles, CA, United States, 8Physics and Biology in Medicine, David Geffen School of Medicine, University of California, Los Angeles, Los Angeles, CA, United States, 9Department of Psychiatry and Biobehavioral Sciences, David Geffen School of Medicine, University of California, Los Angeles, Los Angeles, CA, United States
Synopsis
In the current study, we employed a fast pH-weighted molecular MRI technique using amine chemical exchange saturation transfer echoplanar imaging (CEST-EPI) and compared to dynamic susceptibility contrast (DSC) perfusion MRI, in order to examine the association between tumor acidity and vascularity in 82 patients with histologically confirmed gliomas. We observed colocalized regions of altered vascularity and acidity in tumors within individual patients, and significant positive correlation between median magnetization transfer ratio asymmetry (MTRasym) at 3ppm and relative cerebral blood volume (rCBV) within T2 hyperintense lesions. But areas of contrast enhancement were more complex and did not show a strong, predictable relationship.
INTRODUCTION
Glioma is the most aggressive form of primary brain tumors, affect on average of 7.2 per 100,000 adults and 0.8 per 100,000 children every year1. Metabolic reprogramming is a critical characteristic of cancer. Tumor cells often inefficiently shunt glucose, glutamine, and other substrates down the glycolytic pathway regardless of the presence of oxygen (Warburg effect)2. This results in acidification of the tumor microenvironment through lactic acid accumulation and inefficient elimination of metabolic byproducts at a rate proportional to the degree of aggressiveness3 and invasion4. In addition to increased metabolic activity, tumor angiogenesis is critical for malignant transformation5, either through neovascularization or cooption of existing vasculature6. As tumors grow larger and growth rates are accelerated by this increased vascularity, regions of the tumor can become hypoxic as metabolic demands outpace nutrient delivery7. This decreased oxygen tension increases the acidity of interstitial space through carboxylic acid buildup and further increases in the rate of lactic acid accumulation from glycolysis. Thus, we hypothesized gliomas with a high degree of angiogenesis may also have a high level of acidity.
In the current study we employed a fast pH-weighted molecular MRI technique using amine chemical exchange saturation transfer echoplanar imaging (CEST-EPI)8 and compared to dynamic susceptibility contrast (DSC) perfusion MRI in order to examine the association between tumor acidity and vascularity in patients with histologically confirmed gliomas with various levels of malignancy.
METHODS
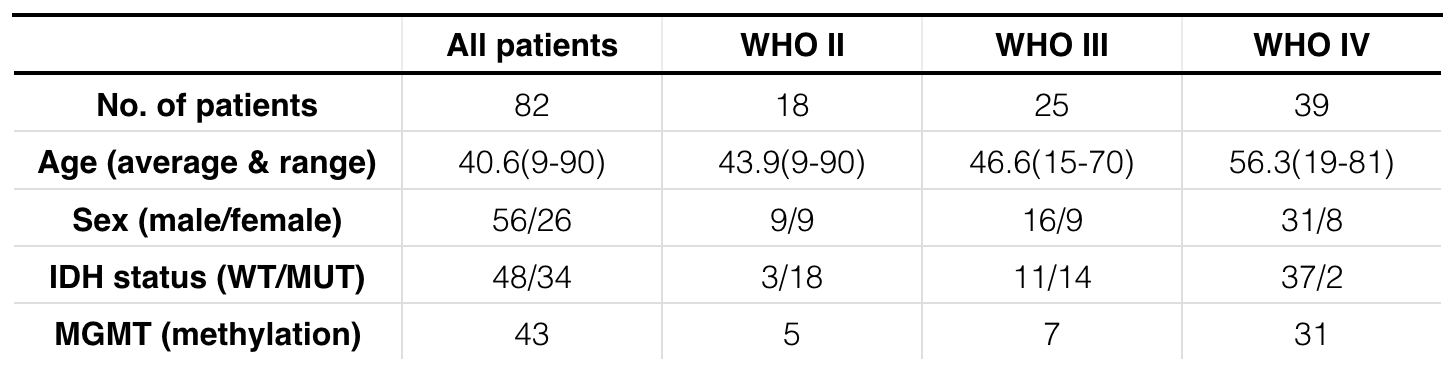
Patient: A total of 82 histologically confirmed glioma patients (World Health Organization WHO II, N=18; WHO III, N=25; WHO IV, N=39) were enrolled in this retrospective study. A detailed patient demographics is in Table 1. Amine CEST-MRI: pH-weighting amine CEST images were collected with CEST-EPI sequence. Off-resonance saturation was applied using a pulse train of 3x100ms Gaussian pulses with peak amplitude of 6µT. Post processing of CEST data consists of motion correction, z-spectra based B0 correction9, followed by the calculation of magnetization transfer ratio asymmetry (MTRasym) at amine proton resonance frequency (3.0ppm) as the metric of CEST contrast. DCS-MRI: DSC-MRI images were collected with 0.1mmol/kg dose of gadopentate dimeglumine (Gd-DTPA; Magnevist, Bayer Schering Pharma, Leverkusen,Germany), in which 0.025 mmol/kg was used as preload dosage. Calculation of relative cerebral blood volume (rCBV) was performed by a bi-directional contrast agent leakage correction algorithm10, normalized by the average CBV value in contralateral, normal appearing white matter (NAWM). Data Analysis: The correlation between median MTRasym at 3ppm and rCBV was evaluated in regions of contrast enhancement, T2 hyperintensity, and macroscopic necrosis, with Pearson’s correlation analysis. We used Spearman’s correlation to test the difference in MTRasym and rCBV across the tumor grades, and Mann-Whitney u-test to evaluate the difference comparing IDH1 mutant and IDH1 wild-type gliomas, or MGMT methylated and unmethylated gliomas.RESULTS
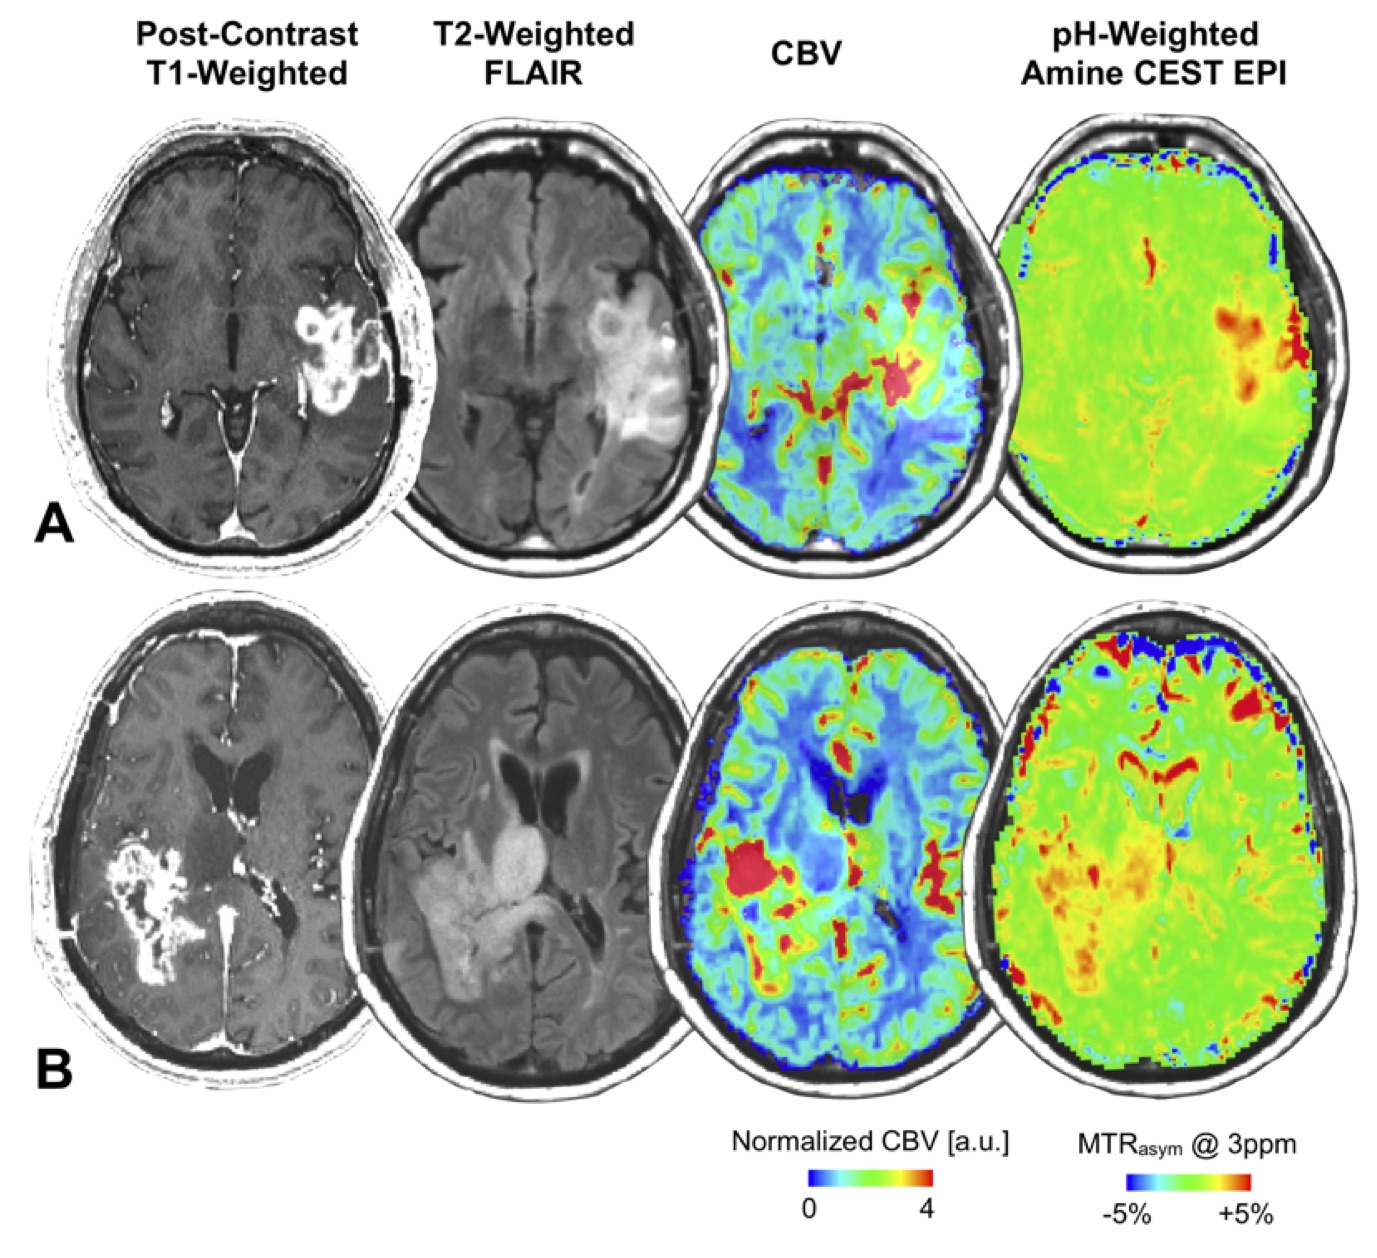
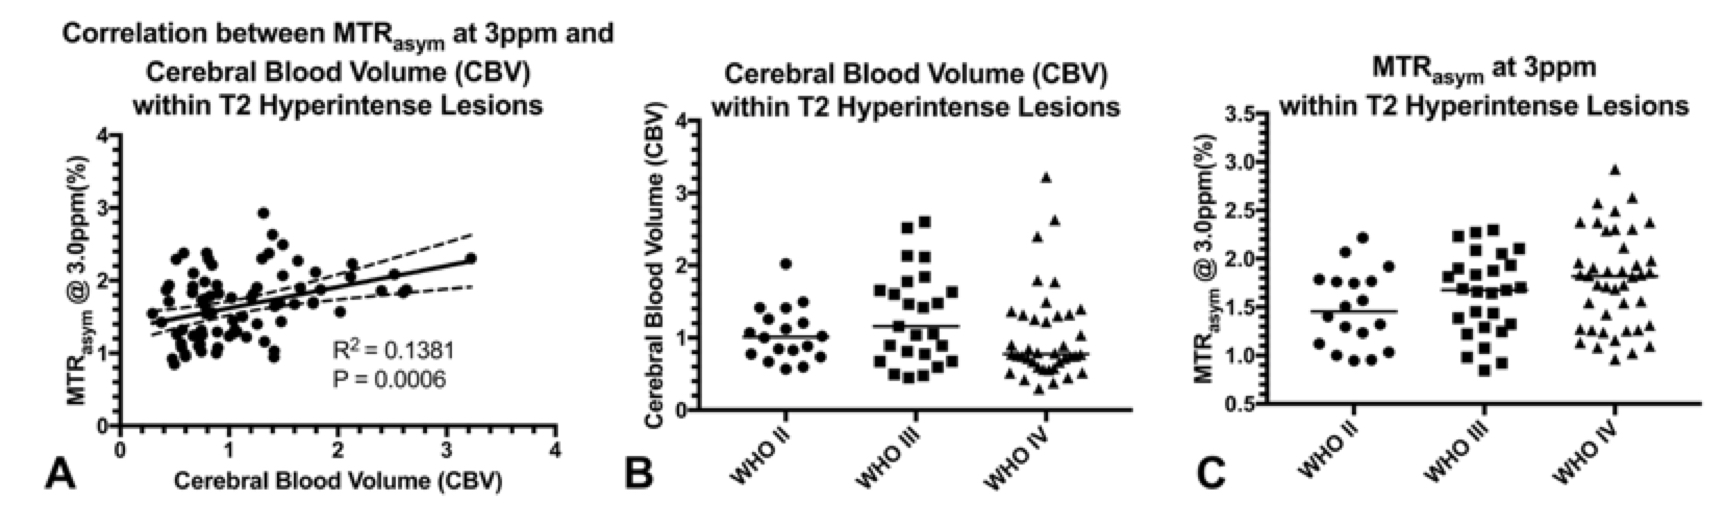
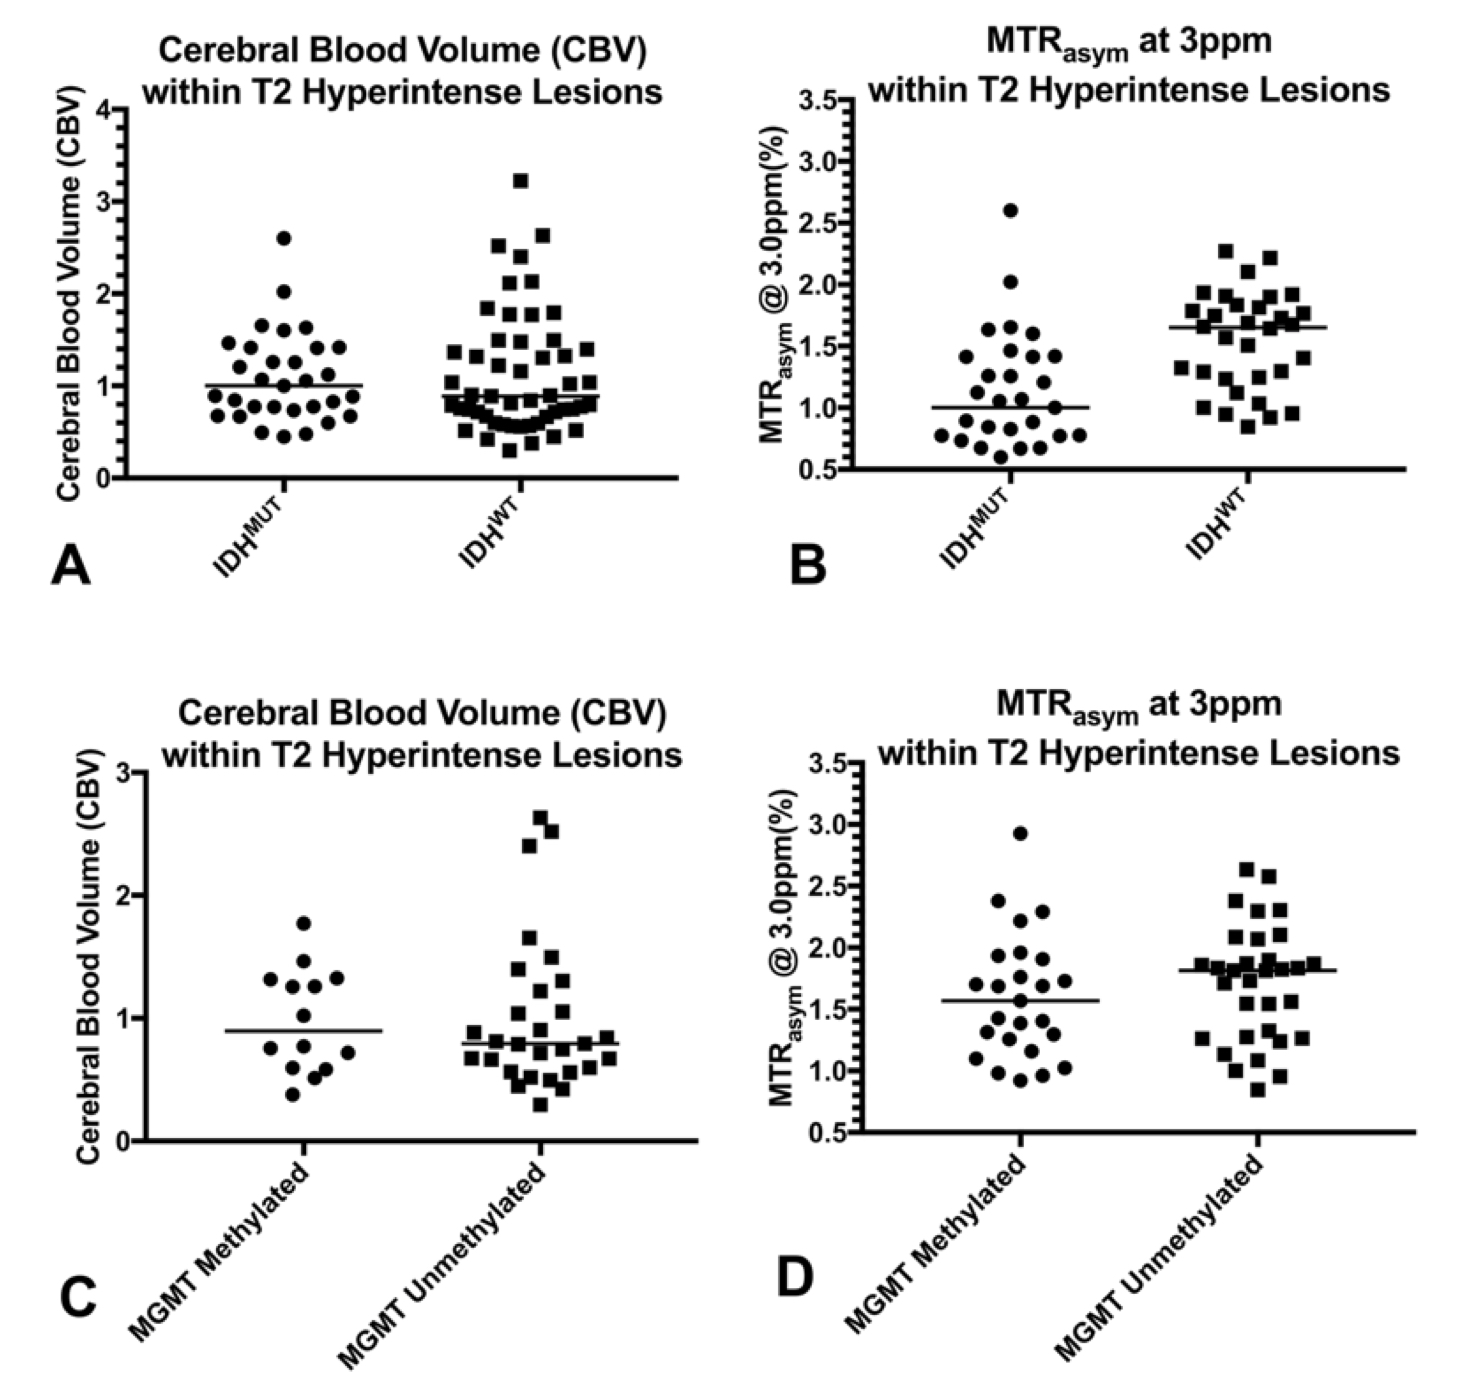
Colocalized regions of altered vascularity and acidity were observed in tumors within individual patients (Figure 1), but no statistically significant association was observed between median rCBV and MTRasym at 3ppm in areas of contrast enhancement (p = 0.30) or necrosis (p = 0.60). Median rCBV and MTRasym at 3ppm within T2 hyperintense lesions were significantly correlated (p = 0.0006, Figure 2 (A)). MTRasym at 3ppm increased with increasing WHO grade for both contrast enhancing (p = 0.0428) and T2 hyperintense tumor (p = 0.0209). However, the same trend was not observed in rCBV (Figure 2 (B-C)). IDH1 mutant gliomas had a lower level of acidity compared with IDH1 wild type gliomas in T2 hyperintense areas (p < 0.0001, Figure 3 (B)). rCBV was not significantly different within T2 hyperintensity lesions when comparing IDH1 mutant gliomas and IDH1 wild-type gliomas (p = 0.711, Figure 3 (A)), but rCBV within contrast-enhancing tumor were higher in IDH1 wild-type gliomas (p = 0.0395). No significant difference was observed between MGMT methylated and unmethylated gliomas, with either rCBV or MTRasym (Figure 3 (C-D)).DISCUSSION AND CONCLUSION
Gliomas exhibit spatial colocalized altered vascularity and acidity. Median measurements within tumor regions across a large number of patients demonstrated a positive linear association between blood volume and tumor acidity in areas of T2 hyperintense, non-enhancing tumor, but areas of contrast enhancement were more complex and did not show a strong, predictable relationship. These observations suggest tumor acidity, oxygen consumption, and neovascularity are complex processes and potentially spatially heterogenous, consistent with the known genetic, histopathologic, proteomic, and metabolic spatial heterogeneity11.Acknowledgements
No acknowledgement found.References
1. Sturm D, Bender S, Jones DTW, Lichter P, Grill J, Becher O, et al. Paediatric and adult glioblastoma: multiform (epi)genomic culprits emerge. Nat Rev Cancer. 2014; 14: 92-107.
2. Warburg O. The metabolism of tumours: investigations from the Kaiser Wilhelm Institute for Biology. Berlin-Dahlem. (London, UK: Arnold Constable); 1930.
3. Gatenby RA, Vincent TL. An evolutionary model of carcinogenesis. Cancer Res 2003;63:6212-6220.
4. Martinez-Zaguilan R, Seftor EA, Seftor RE, et al. Acidic pH enhances the invasive behavior of human melanoma cells. Clin Exp Metastasis 1996;14:176-186.
5. Russell SM, Elliott R, Forshaw D, et al. Glioma vascularity correlates with reduced patient survival and increased malignancy. Surg Neurol 2009;72:242-246; discussion 246-247.
6. Jain RK, di Tomaso E, Duda DG, et al. Angiogenesis in brain tumours. Nat Rev Neurosci 2007;8:610-622.
7. Rampling R, Cruickshank G, Lewis AD, et al. Direct measurement of pO2 distribution and bioreductive enzymes in human malignant brain tumors. Int J Radiat Oncol Biol Phys 1994;29:427-431.
8. Harris RJ, Cloughesy TF, Liau LM, et al. Simulation, phantom validation, and clinical evaluation of fast pH-weighted molecular imaging using amine chemical exchange saturation transfer echo planar imaging (CEST-EPI) in glioma at 3 T. NMR Biomed 2016;29:1563-1576.
9. Yao J, Ruan D, Raymond C, Liau LM, Salamon N, Pope WB, Nghiemphu PL, Lai A, Cloughesy TF, Ellingson BM. Improving B0 Correction for pH-Weighted Amine Proton Chemical Exchange Saturation Transfer (CEST) Imaging by Use of k-Means Clustering and Lorentzian Estimation. Tomography. 2018 Sep;4(3):123.
10. Leu K, Boxerman JL, Lai A, Nghiemphu PL, Pope WB, Cloughesy TF, Ellingson BM. Bidirectional Contrast agent leakage correction of dynamic susceptibility contrast (DSC)‐MRI improves cerebral blood volume estimation and survival prediction in recurrent glioblastoma treated with bevacizumab. Journal of Magnetic Resonance Imaging. 2016 Nov;44(5):1229-37.
11. Sottoriva A, Spiteri I, Piccirillo SGM, et al. Intratumor heterogeneity in human glioblastoma reflects cancer evolutionary dynamics. Proceedings of the National Academy of Sciences of the United States of America 2013;110:4009-4014
Figures