0849
7T high-resolution arterial spin labeling reveals layer dependent cerebral blood flow1Laboratory of FMRI Technology (LOFT), Mark & Mary Stevens Neuroimaging and Informatics Institute, Los Angeles, CA, United States
Synopsis
The microcirculation of cerebral cortex has been investigated by anatomical studies in animals and human brain tissue. For the first time, we applied high resolution (0.5x0.5x1.4mm3) pulsed and pseudo-continuous ASL (pCASL) with inner-volume GRASE readout at 7T to measure CBF in the superficial, middle and deep layers of human cerebral cortex. Our results show higher perfusion in the middle layer using pCASL, while perfusion in the superficial layer of PASL may be affected by pial artery signals. In vivo imaging of layer dependent CBF opens door to investigating neurovascular coupling in a laminar fashion.
Background
Due to high demand of energy supply and lack of substantial energy storage capacity in brain, activation of neurons is precisely coupled with the vascular supply, which was reported to be layer dependent on monkey cortex.1 The capillary density has been reported to be higher in the middle layers of cerebral cortex than superficial and deep layers.2 In this study, we propose to measure cerebral blow flow (CBF) in the superficial, middle and deep layers of human cerebral cortex with high spatial resolution arterial spin labeling (ASL) at 7T. To the best of our knowledge, this is the first attempt to investigate layer dependent perfusion in a live human brain.Method
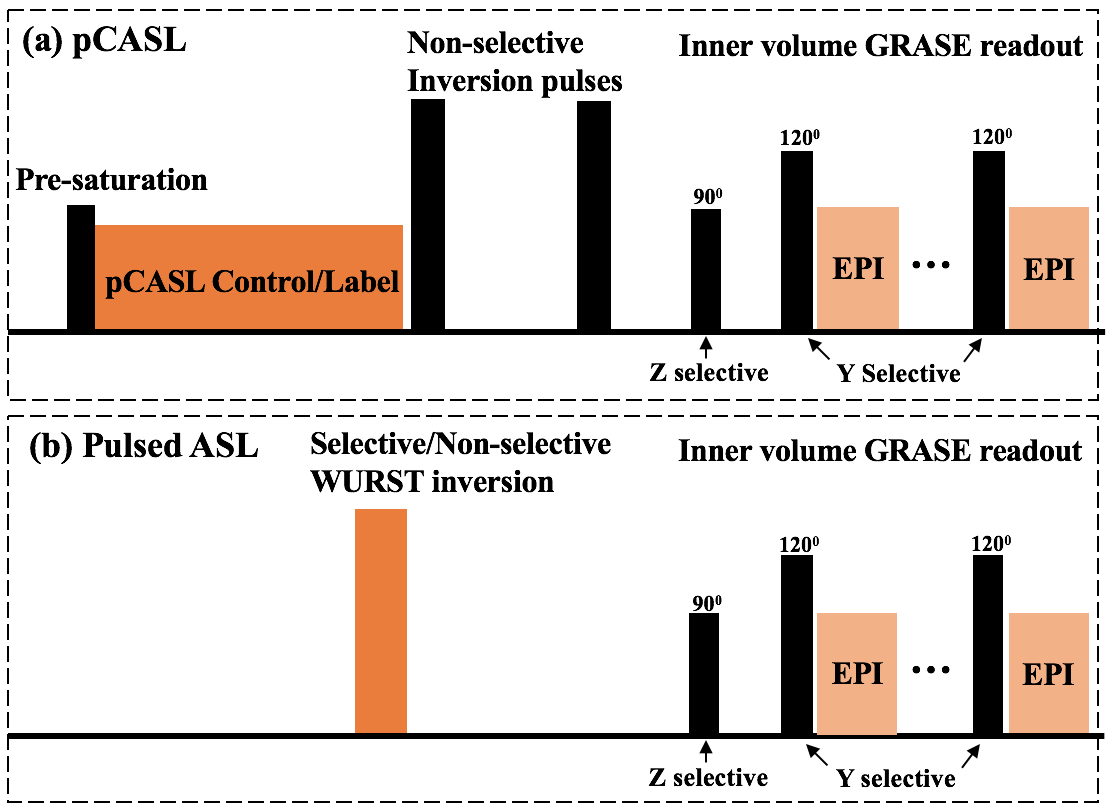
MR scans were performed on a 7T Siemens Terra scanner with a NOVA 1Tx/32Rx head coil. Figure 1 shows the pulse sequence diagram and inner-volume GRASE was employed to selectively image a 3D volume. Both pulsed ASL (PASL) and pseud-continuous ASL (pCASL) were performed on one healthy subject (Male, age=27 yrs). PASL used the FAIR scheme with an optimized WURST pulse (duration=15.36ms, k=1.72±10^6, n=2, bandwidth=4.2kHz) for 7T. CSF signal was nulled by optimizing: 1. the timing of the background suppression pulses in pCASL;3 2. PLD and TR in PASL:
$$PLD=-T_{1,CSF}\times log(\frac{1+e^{\frac{-TR}{T_{1,CSF}}}}{2}) ...[1]$$
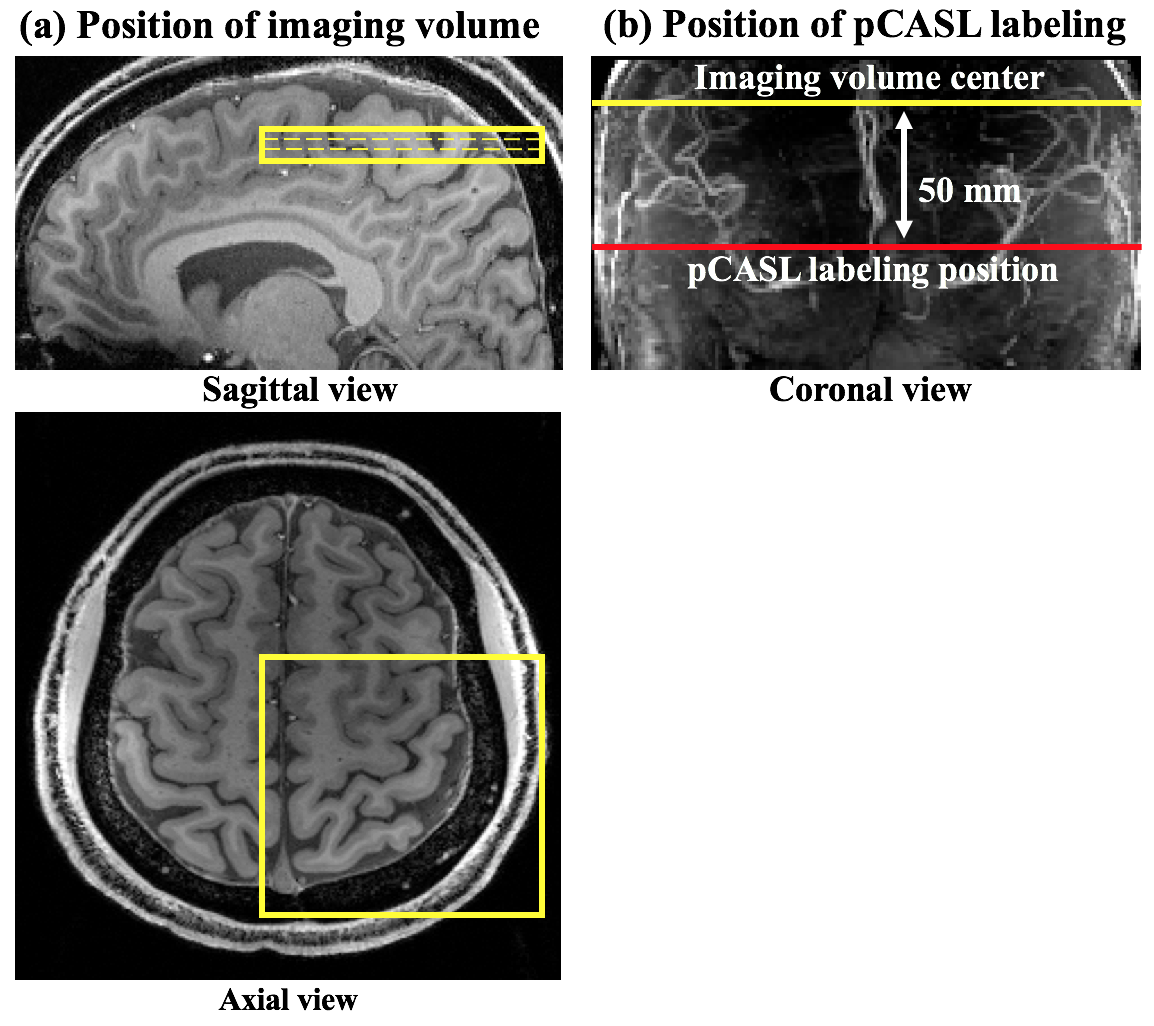
Figure 2(a) shows the position of the imaging volume, which covers the left motor cortex. Figure 2(b) shows the position of the labeling plane of pCASL, which is above the circle of Willis and 50mm below the center of imaging volume. The specific absorption rate (SAR) of RF power was monitored by FDA approved vendor software and was within the first level (3.2W/kg on head).
Imaging parameters were: FOV=100mm, matrix size=96×96, 8 slices (20% oversampling), resolution=0.5×0.5×1.4mm3 (in-plane interpolation), 4 segments (2 partition, 2 phase), bandwidth=1488Hz/pixel, TE=34.5ms. For pCASL, labeling duration/PLD=1500 ms, TR=5000ms, TA=6m40s for 9 measurements and M0 scan. For PASL, PLD=1541ms, TR=4000ms, TA=10m44s for 20 measurements. CBF was calculated according to Alsop D C, et al.,4 assuming labeling efficiency=0.98/0.75 for PASL/pCASL, λ=0.9g/ml. The labeling efficiencies of pCASL were derived by Bloch equation simulations assuming flow velocity of 20 cm/s in the middle cerebral artery. Rigid head motion correction was performed off-line using SPM. Three layers of gray matter (superficial, middle, deep) were manually segmented based on co-registered T1w MP-RAGE images (0.7mm isotropic) using ITK-SNAP.5
Results and discussion
Figure 3 shows the inner-volume GRASE image (a) and corresponding CBF maps generated from PASL (b) and pCASL (c), respectively. PCASL CBF map shows higher SNR and reveals the underlying cortical structure. High focal perfusion signals were observed in PASL CBF maps which was assumed to originate from pial arteries in the superficial layer and organized into microvascular lobules.1
Figure 4 shows the thresholded pial artery signals (CBF>120ml/100g/min), which were distributed along the superficial layer of the cortex in PASL. As for pCASL, majority of the labeled signal enters into the capillary space and minimal signal in pial artery space was observed.
Figure 5 (a,b) shows the co-registered MP-RAGE image and manually segmented three cortical layers, respectively. Figure 5 (c) shows the mean CBF values in three layers. Average CBF in superficial, middle and deep layer = 53.0±21.3, 51.0±20.9 and 37.3±18.9 ml/100g/min in PASL, 46.5±15.8, 46.4±15.8 and 36.5±15.4 ml/100g/min in PASL when pial artery signal was excluded and 42.1±22.7, 49.4±21.8 and 40.3±20.2 ml/100g/min in pCASL, respectively. CBF was significantly higher in the middle layer in pCASL (P<0.0001, pair-wise two-sample t-test), which corresponds to the highest capillary density in the middle layers reported in anatomical studies in animals and specimen of human brain tissue.2 CBF of PASL in the superficial and middle layers were both higher than the CBF in deep layer (P<0.0001) due to remaining pial artery signals. In the future, an inferior saturation pulse can be applied after the PASL inversion pulse to minimize intravascular signals.
Conclusion
For the first time, laminar CBF and pial arteries were revealed in vivo by high resolution PASL/pCASL with inner-volume GRASE readout at 7T. Separation of CBF in cortical layers allows many opportunities to understand the regional blood supply and neurovascular coupling in a laminar fashion. Furthermore, our ASL pulse sequences may be adapted for concurrent measurements of ASL, T2 BOLD and VASO signals to derive the laminar metabolic activities of human brain.Acknowledgements
This work was supported by National Institute of Health (NIH) grant UH2-NS100614.References
[1] Adams D L, Piserchia V, Economides J R, et al. Vascular supply of the cerebral cortex is specialized for cell layers but not columns[J]. Cerebral Cortex, 2014, 25(10): 3673-3681.
[2] Lauwers F, Cassot F, Lauwers-Cances V, et al. Morphometry of the human cerebral cortex microcirculation: general characteristics and space-related profiles[J]. Neuroimage, 2008, 39(3): 936-948.
[3] Shao X, Wang Y, Moeller S, et al. A constrained slice‐dependent background suppression scheme for simultaneous multislice pseudo‐continuous arterial spin labeling[J]. Magnetic resonance in medicine, 2018, 79(1): 394-400.
[4] Alsop D C, Detre J A, Golay X, et al. Recommended implementation of arterial spin‐labeled perfusion MRI for clinical applications: A consensus of the ISMRM perfusion study group and the European consortium for ASL in dementia[J]. Magnetic resonance in medicine, 2015, 73(1): 102-116.
[5] Paul A. Yushkevich, Joseph Piven, Heather Cody Hazlett, Rachel Gimpel Smith, Sean Ho, James C. Gee, and Guido Gerig. User-guided 3D active contour segmentation of anatomical structures: Significantly improved efficiency and reliability. Neuroimage 2006 Jul 1;31(3):1116-28.
Figures