0847
Joint measurement of perfusion and apparent oxygenation in the human placenta (PERFOX)Jana Hutter1,2, Anita A Harteveld3, Laurence Jackson1,2, Suzanne L Franklin4, Clemens Bos3, Matthias J van Osch4, Jonathan O'Muircheartaigh1,2, Alison Ho5, Laura McCabe1, Lucy Chappell5, Joseph V Hajnal1,2, Mary A Rutherford1,2, and Enrico De Vita1
1Biomedical Engineering, School of Biomedical Engineering & Imaging Sciences, King's College London, London, United Kingdom, 2Centre for the Developing Brain, School of Biomedical Engineering & Imaging Sciences, King's College London, London, United Kingdom, 3Department of Radiology, University Medical Center Utrecht, Utrecht, Netherlands, 4C.J. Gorter Center for high field MRI, Department of Radiology, Leiden University Medical Center, Leiden, Netherlands, 5Academic Women's Health Department, King's College London, London, United Kingdom
Synopsis
Novel insight into placental oxygenation and perfusion was achieved by integrating velocity-selective arterial spin labeling and T2* mapping into one scan. Quantitative values can be obtained dynamically and geometrically fixed, allowing both separation of effects and joint visualization.
Introduction
Optimal placental function is crucial for any successful pregnancy. Major maternal and fetal complications are linked with placental insufficiency. Current clinical screening however, is unable to visualize the core of placental function - the exchange of oxygen and nutrients from the maternal blood perfusing the placenta to the fetal blood in the villous trees. Lack of a suitable in-vivo observation window hampers early diagnosis. Promising recent placental MRI studies successfully used relaxometry (mainly T2* mapping)1-3, velocity selective arterial spin labeled (VSASL)4-5 perfusion and diffusion MRI6-7 to differentiate between healthy and diseased placentas. However, most studies focused on individual contrasts only, while the complex disease aetiology calls for a multi-modal assessment. This study proposes an integrated assessment of perfusion and oxygenation (PERFOX): combining two independent quantitative MRI techniques, T2* relaxometry and VSASL, to allow assessment of the interaction between fetal oxygen uptake and maternal perfusion.Methods
A joint acquisition, consisting of a VSASL module placed before a multi-echo gradient echo (MEGE) EPI readout, was developed to integrate perfusion and T2* measurements in one joint PERFOX scan (Figure 1). VSASL “labeling” saturates magnetisation of fluid flowing above a set cut-off velocity; control acquisition without motion sensitizing gradients has the same T2-weighting but no saturation. Label-control pairs are interleaved and repeated to permit averaging. The multiple-echo EPI readout allows T2* and proton density measurements. Fifteen pregnant women (median/range gestational age (GA) 28.9/21.9-38.2 weeks) were scanned on a 3T-MRI scanner (Philips Achieva) with a 32-channel cardiac coil. T2-weighted 2D TSE and B0 maps were acquired in maternal-coronal orientation and enabled image-based shimming9 and planning of the PERFOX scan. Coronal PERFOX used the following parameters: TR=3500ms, TE=[20,56,93]ms, 8 slices, resolution=(4mm)3, SENSE 2.5, VSASL-module duration=50ms, Gmax=13mT/m, Cut-off velocity=1.55cm/s, BGS=50,1150ms, PLD=1600ms, inter-slice-spacing=115ms, 25 label-control pairs, maternal to fetal slice acquisition order, acquisition time=2:30min. Double inversion recovery background suppression (BGS) of static tissue was used 5 (timings determined from T1 maps obtained with ZEBRA8. The first label-control pair was acquired without BGS to normalize the perfusion-weighted images (M0). In addition, 8 patients had a higher resolution (3mm)3 axial scan (PERFOX-HiRes) to explore the ability of the proposed PERFOX technique to visualize even finer details following the physiological pathway - from maternal basal plate to fetal chorionic plate. In three subjects, the PERFOX scan was repeated in different scan sessions to study repeatability. Nonrigid motion correction was performed10 to align the acquired volumes. T2* fitting used Levenberg-Marquart optimization. Perfusion analysis involved pairwise control-label subtraction and averaging, then division by the non-BGS control volume to remove the effect of T2* weighting. A whole-placenta region-of-interest (ROI) was manually drawn for quantification.Results and Discussion
Joint visualization of perfusion and oxygenation was achieved successfully with the optimised integrated PERFOX protocol in all subjects. Fig. 2 illustrates separate MEGE/VSASL (a,b) and joint PERFOX (c) acquisitions of perfusion and oxygenation data. T2* maps from PERFOX-HiRes in the axial plane (Fig. 3) show - in line with previous results1-3,11- circular regions of variable size with long T2* in the middle, smoothly decreasing towards the region borders. The perfusion weighted images show areas of high perfusion close to the basal plate. Consistently across patients, a shift between the centres of T2* and perfusion peaks can be observed - with high-perfusion peaks closer to the maternal basal plate and the T2*-peaks closer to the fetal chorionic plate (see Fig. 3c-d, note inverted colour map for T2*). Quantitative results from both anterior and posterior placentas (Fig. 4) show decreasing T2* and perfusion signal over GA; the repeated scans show good agreement. The joint acquisition furthermore allows visualization of the perfusion results after removing T2* weighting, by calculating the perfusion maps from label and control images separately corrected for T2* decay (proton-density maps). A perfusion map from the 1st echo time and from the proton density maps are displayed in Fig. 5, together with their difference.Conclusion
Simultaneous, integrated measurement of T2* and perfusion was successfully demonstrated. The joint acquisition does force compromises on key parameters such as echo times and coverage - drawbacks compensated by its ability to provide truly simultaneous and co-registered estimates of local T2* and perfusion. Geometrically joint data can be particularly useful for dynamic effects – it alleviates registration issues and allows visualizing of e.g. uterine contractions. In the future, a joint fitting approach might be valuable. The PERFOX data is well suited for future integration of more complex models. This successful integrated acquisition of two essential contrast mechanisms opens a new avenue to elucidate the relationship between events at the centre of placental function and dysfunction. This joint assessment allows us to study compensatory mechanisms. Furthermore the proposed joint PERFOX sequence might find applications in other highly perfused organ systems (kidney, liver).Acknowledgements
We thank the midwives, obstetricians and radiographers who played a key role in obtaining the data sets. We would also like to thank all participating mothers. This work received funding from the NIH (Human Placenta Project - grant 1U01HD087202-01), the Wellcome Trust (Sir Henry Wellcome Fellowship, 201374/Z/16/Z), and the EPSRC (grants N018702 and M020533). This work was also supported by the Wellcome/EPSRC Centre for Medical Engineering [WT 203148/Z/16/Z]. This work is part of the research programme Drag and Drop ASL with project number NWO-TTW 14951, which is (partly) financed by the Netherlands Organisation for Scientific Research (NWO).References
1 Sorensen, USOG 2013 2 Schabel, MRM 2016 3 Sinding, Placenta 2018 4 Zun, ScriRep 2018 5 Wong, MRM 2006 6 Bonel, Radiology 2010 7 Slator P, MRM 2018 8 Hutter, SciRep, 2018 9 Gaspar, MRM2018 10 Avants, MEDIA 2008 11 Hutter, MRM 2018Figures
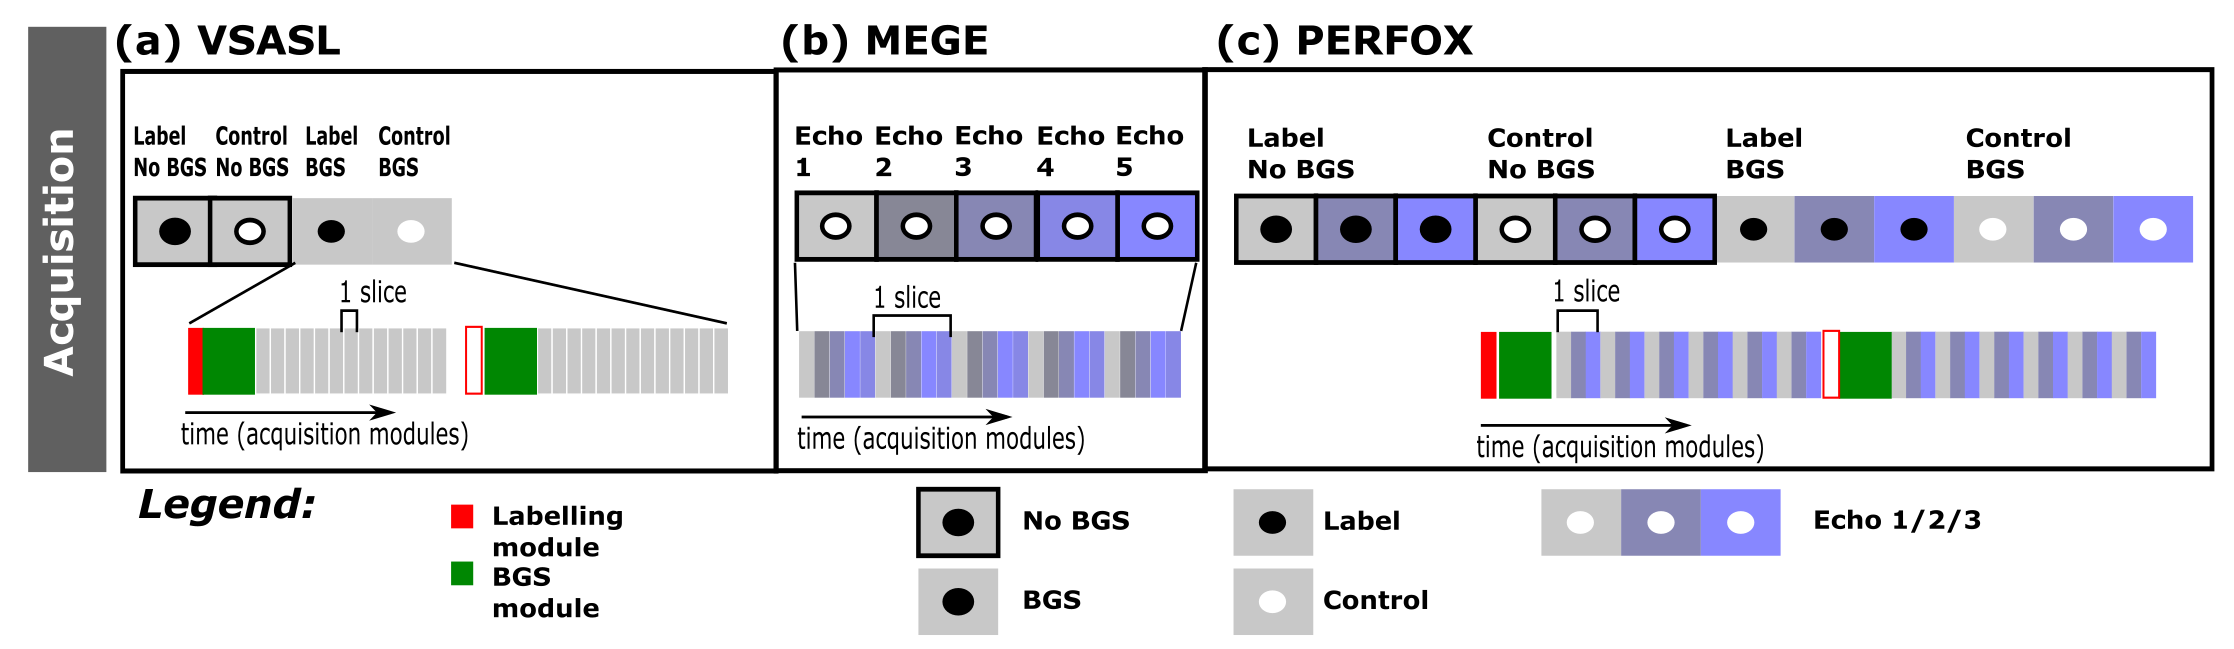
Figure 1: The
acquisition strategy is schematically depicted. (a) The acquired
volumes are shown for the VSASL acquisition: the first non-background
suppressed volumes in dark grey, followed by the background
suppressed volumes in light grey. The interleaving of label and
control volumes is illustrated by the white and dark circles and gets
repeated multiple times per acquisition (b) The subsequent echoes are
shown for the separate MEGE acquisition in different shades of blue
but with white circles as these are all acquired without perfusion
weighting. (c) For PERFOX both acquisitions are combined.
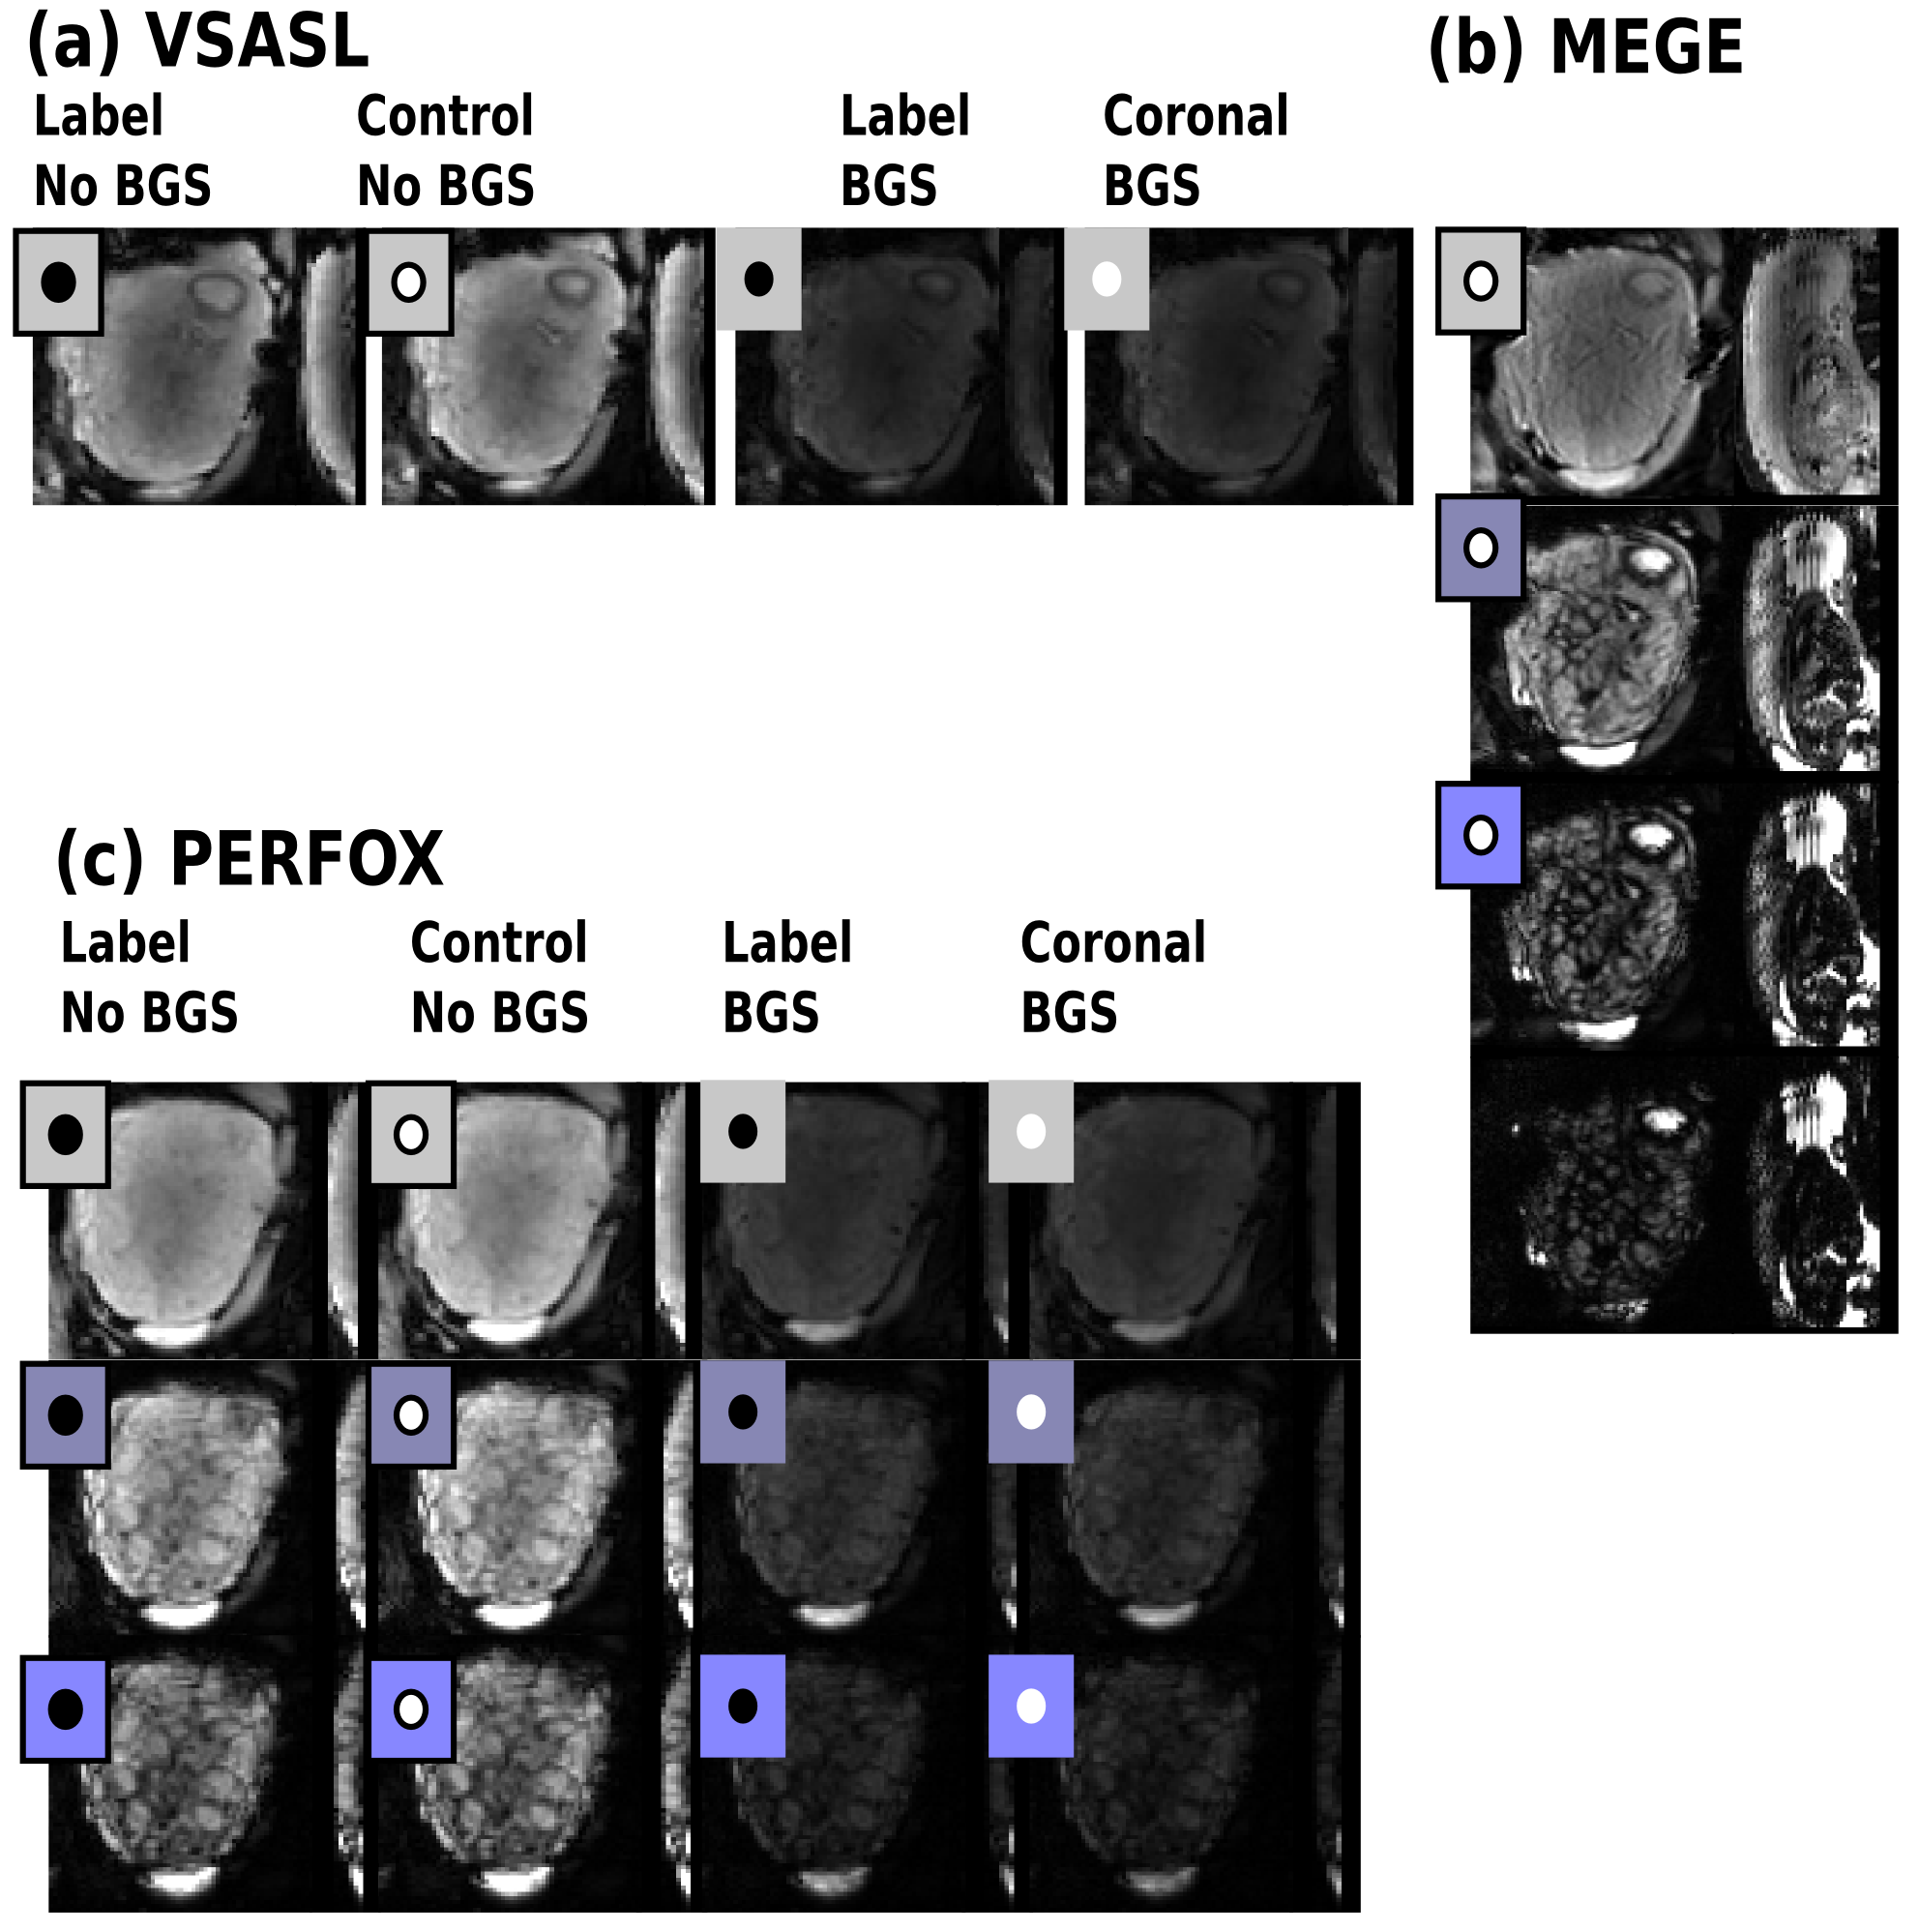
Figure 2: Depiction
of exemplary unprocessed datasets for separated and joint PERFOX
acquisition on the same participant. (a-b) Illustrates the VSASL and
MEGE acquisition. (c) Illustrates the joint PERFOX scan. All volumes
are shown in a mid parenchymal native coronal plane.
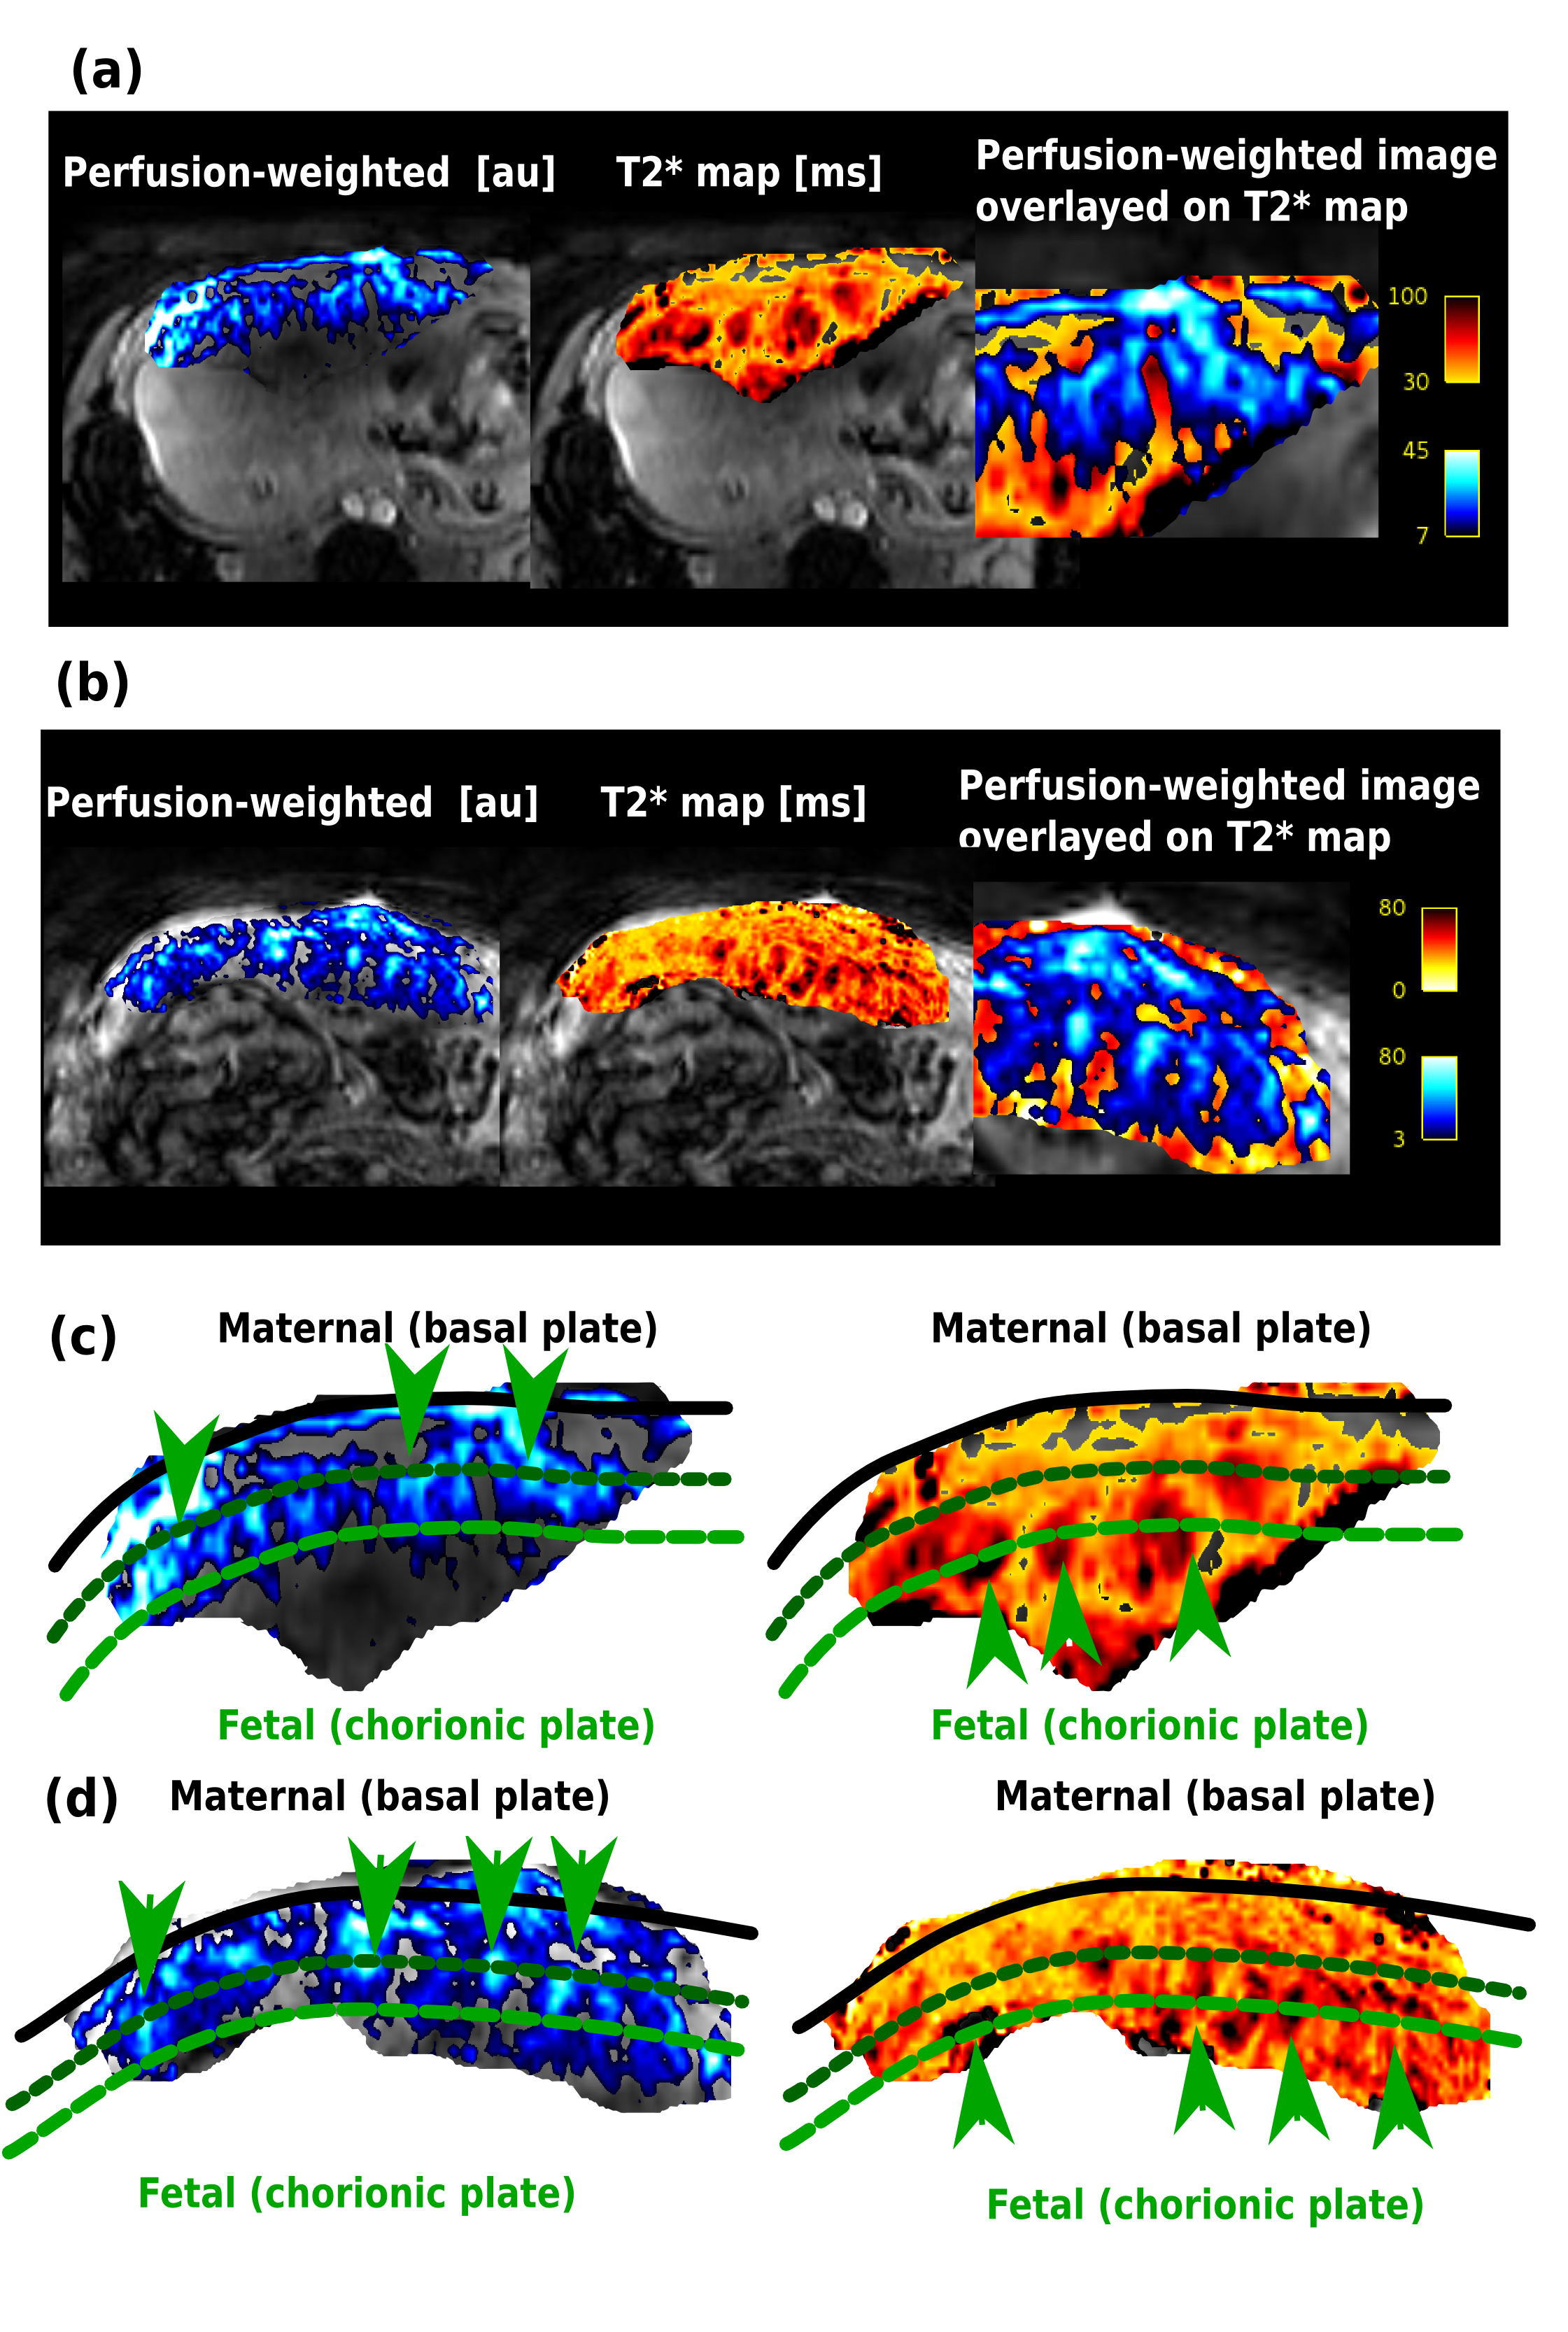
Figure 3: Perfusion
and T2* maps of the placenta obtained from the combined joint
PERFOX-HiRes acquisition, in the axial plane, are shown of exemplary
subjects. (a) GA=25+3 and (b) GA=38+1 weeks. The maps are shown
separately overlayed on a Gradient-echo EPI image and then combined
with the perfusion map overlayed on the T2* map. In (c-d) a zoom into
the placental region is shown, the three lines illustrate the
maternal basal plate (black), the location of the high perfusion
peaks (dark green) and the location of the high T2* peaks (light
green). The arrows indicate some of the areas of high T2* and high
perfusion.
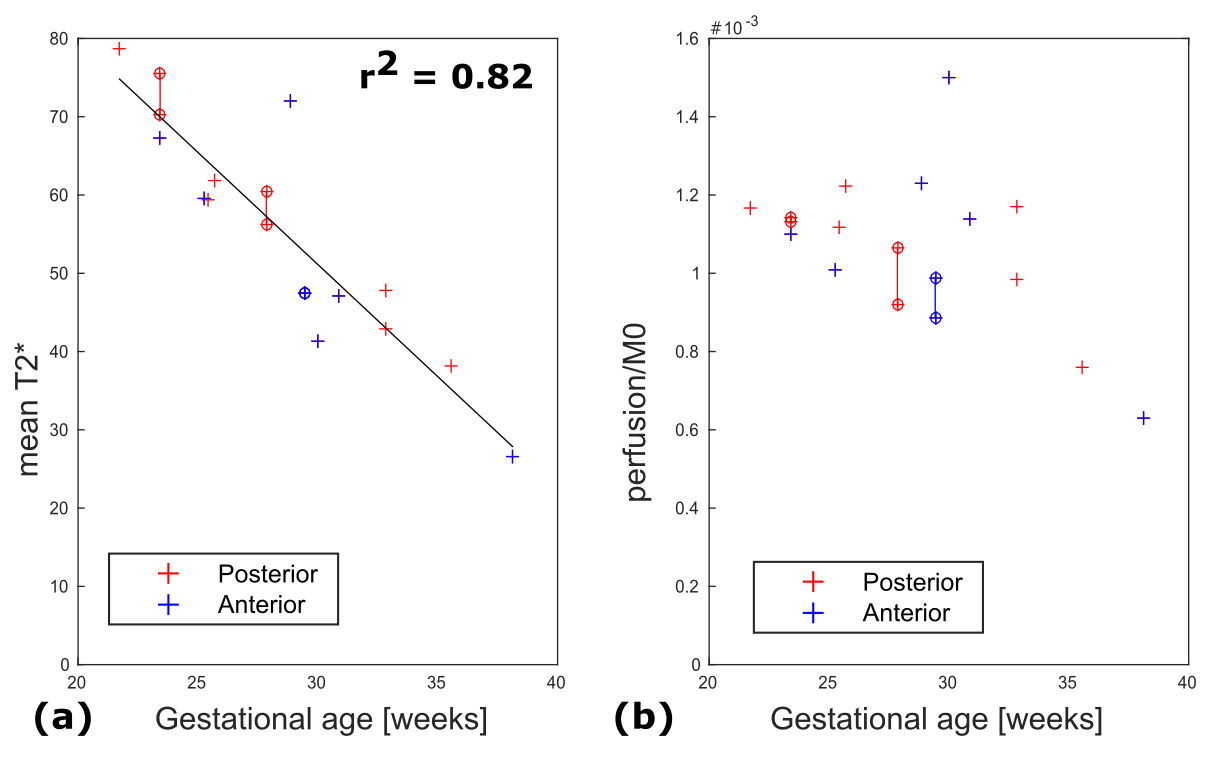
Figure 4: Quantitative
results obtained from all PERFOX scans. The mean T2* (a) and the
dM/M0 (%) - here calculated from the first TE - (b) are depicted. The
results from posterior placentas are shown in red, from anterior
placentas in blue. No systematic difference between anterior and
posterior placentas is apparent. Three subjects had repeat scans in
the same session; these are highlighted by connected circles; the
mean coefficient of variation for these repeated datasets is
4.6+-1.5% (T2*) and 9.8+-6.3% (perfusion).
Both
T2* and perfusion decrease over gestation, however only the T2* decay
is significant (r2=0.82).
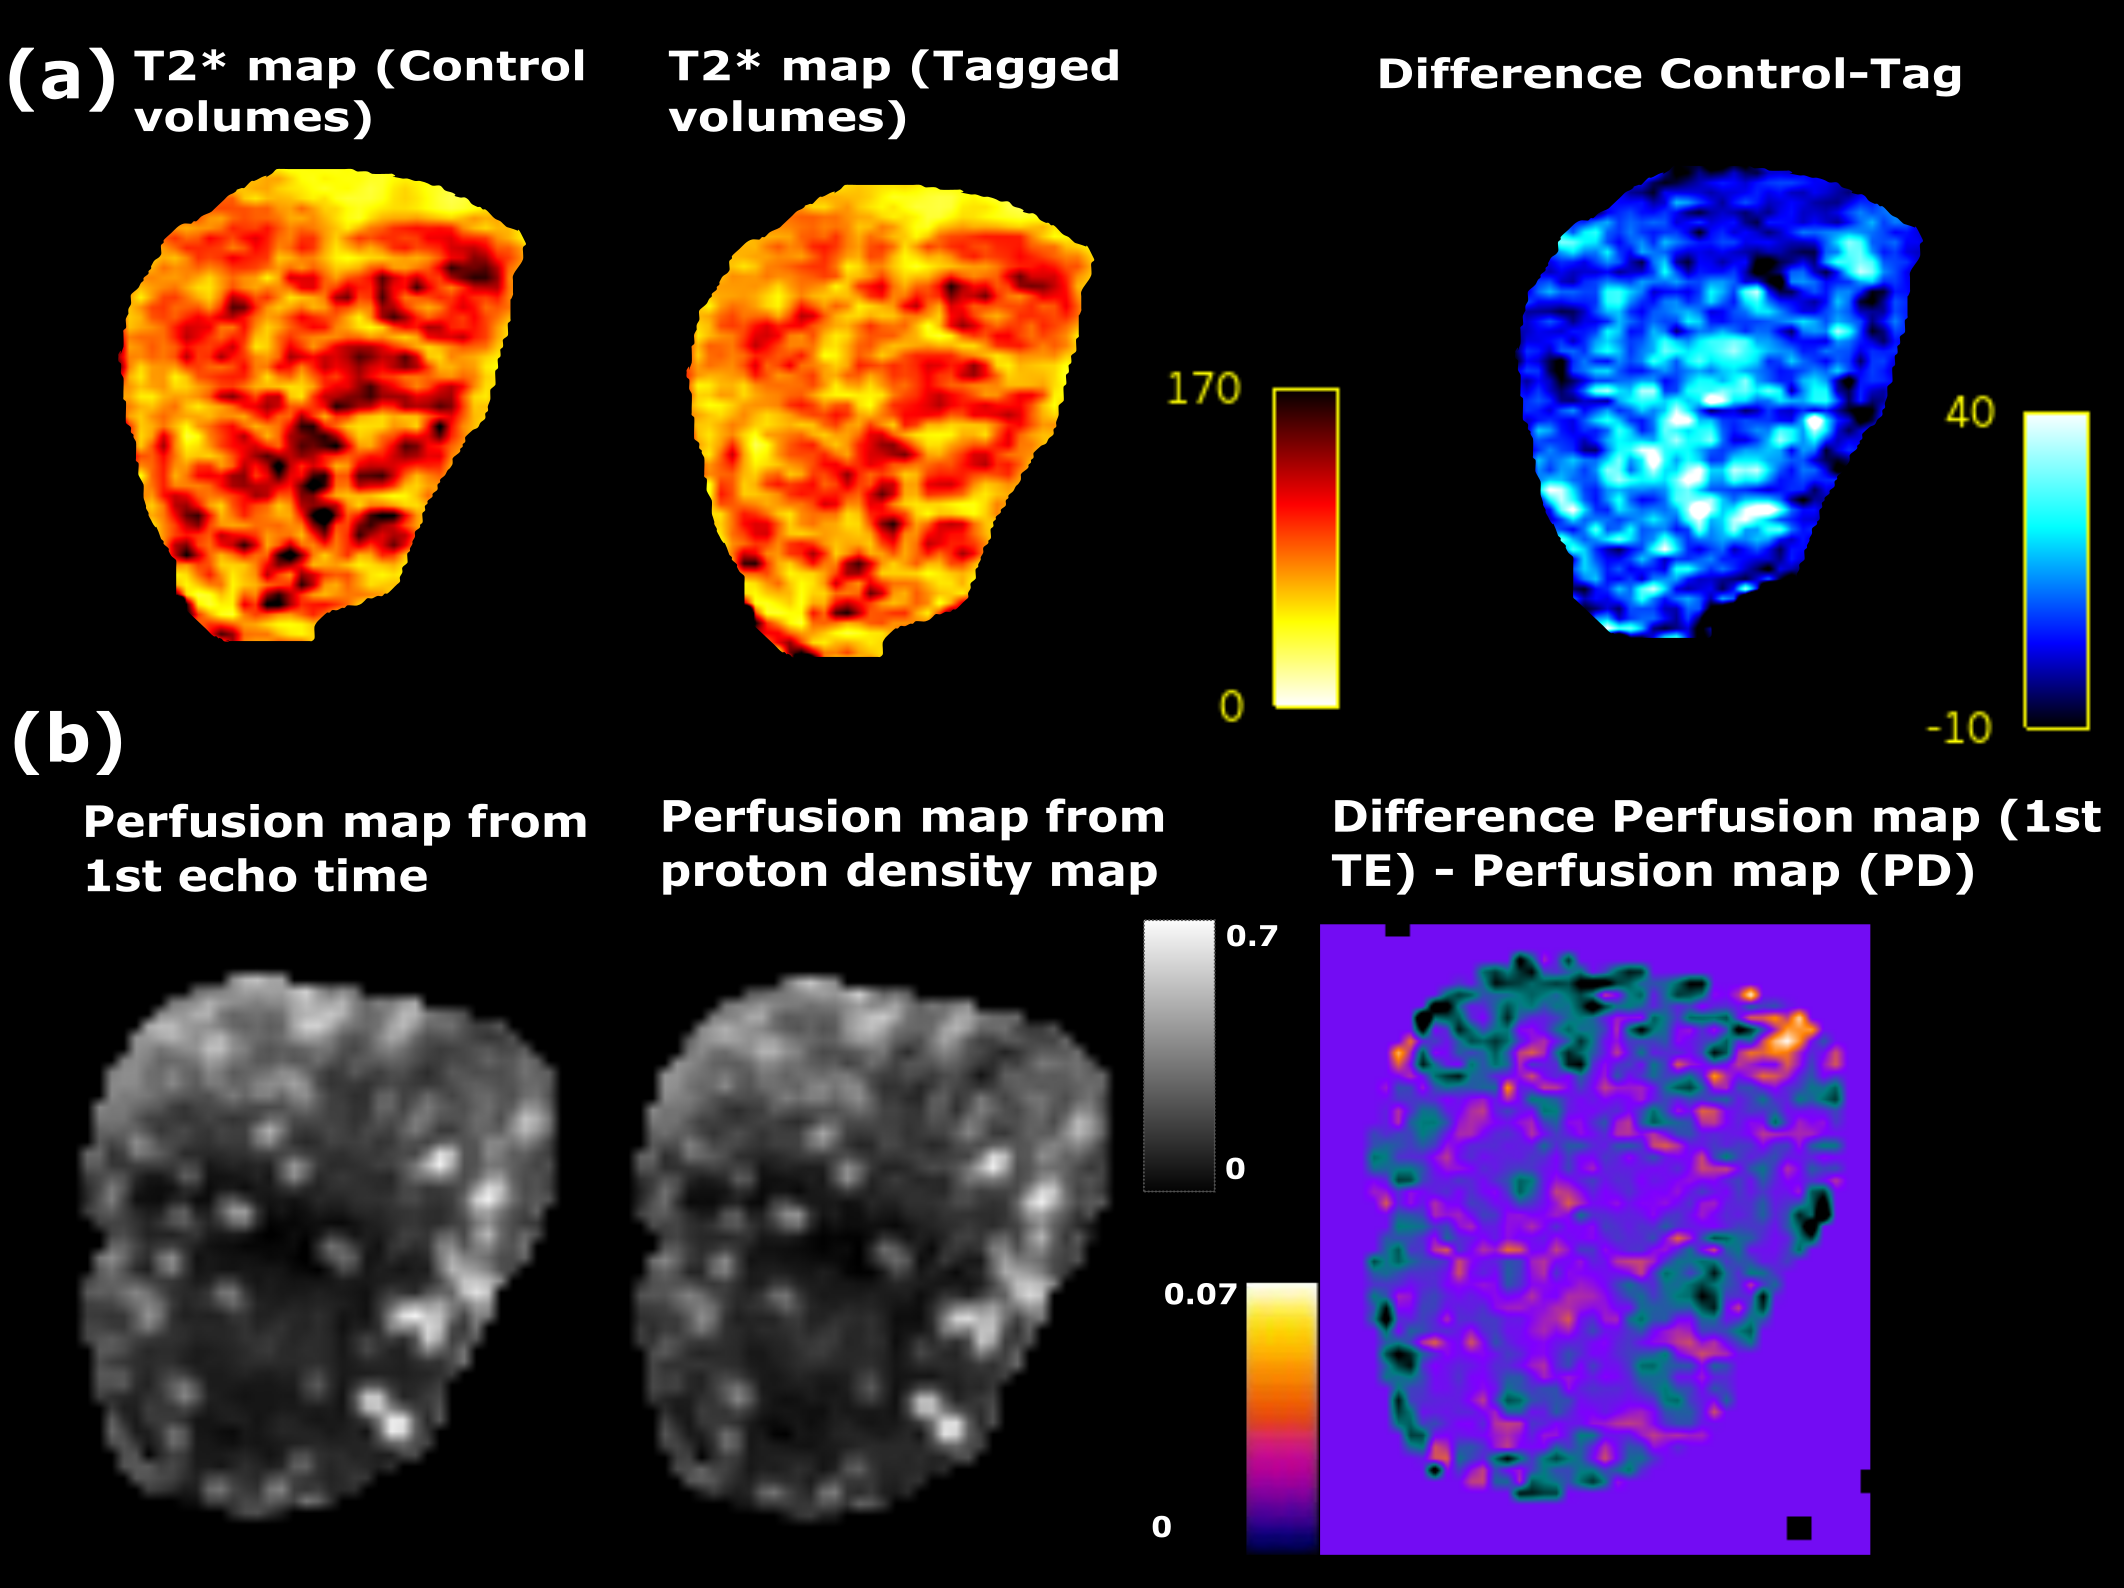
Figure 5: (a)
T2* maps calculated from the control volumes, tagged volumes and
difference in T2* between the two (top right). (b) Perfusion maps
(dM0/M0 [%]) obtained from the proton density maps and from the data
from the 1st echo time, together with difference image
(bottom right).