0845
Assessment of renal perfusion in transplanted kidney patients using multi-delay pseudo‑continuous arterial spin labeling1Department of Bio & Brain Engineering, Korea Advanced Institute of Science and Technology (KAIST), Daejeon, Korea, Republic of, 2Department of Radiology, Bio medical Research Institute of Chonbuk National University Hospital, Jeonju, Korea, Republic of
Synopsis
There has been no systemic evaluation for transplanted kidney patients using 3T MRI system with pseudo-continuous ASL (pCASL). In this study, we presented multi-parametric renal perfusion imaging on transplanted kidney patients using multi-delay pCASL with bSSFP readout. Influence of background suppression on temporal signal stability was investigated and two different perfusion quantification models were compared. Multi-parametric perfusion signals including mean renal perfusion and arterial transit time were measured for transplanted kidney patients. The current study would be helpful for applying multi-delay pCASL to routine clinical diagnosis of transplanted kidney patients.
Introduction
Kidney is an important organ for regulating body fluids and level of electrolytes. The level of blood flow is a key determinant for evaluating renal function. Recently, many studies have been proposed to assess the blood perfusion in kidney using arterial spin labeling (ASL) perfusion MRI1. These ASL methods enabled non-invasive, reliable, and longitudinal assessment of kidney function, especially in patients with kidney transplantation who carry potential risks of contrast agent-induced nephropathy2,3. However, most of the previous ASL studies for transplanted kidney patients are conducted on 1.5T MRI system and there has been no systemic evaluation in 3T MRI system with pseudo-continuous ASL (pCASL). In this study, we measured renal perfusion in transplanted kidney patients using 3T MRI with pCASL, and balanced steady state precession (bSSFP) readout. Effect of background suppression (BS) was investigated, and multi-parametric perfusion images were evaluated with multi-delay pCASL.Methods
Acquisition
MR examinations were performed in 4 patients (2M2F, 42±8.1Y) who underwent kidney transplantation within a week before experiment on a 3T MRI scanner (MAGNETOM Verio Siemens, Erlangen, Germany) with 12-ch coil. Patients were instructed to breathe freely during data acquisition. The labeling plane was set 80mm above the center of imaging slice. The labeling duration was 1.5s. Following parameters were used for 2D bSSFP readout: TR/TE=4.43/2ms; flip angle=30°; FOV=300×225mm2; matrix size=128×96; slice thickness=8mm; single sagittal slice; temporal resolution of each label/control scan=5.5s. BS with one slice-selective saturation pulse before labeling and two non-selective inversion pulses after labeling was used. Each inversion pulse was timed to suppress background signal(<30%) at T1=500ms and 1000ms. ASL scans were repeated to acquire 26 labeling/control pairs for subtraction, and additional 14 sets without labeling/control preparation were acquired to get the image. For multi-delay acquisition, scans were repeated with different post labeling delay (PLD) times (0.5/1.0/1.5/2.0s). For each PLD, scan time was 3:28 min for the acquisition of label/control pairs and 56s for the M0 acquisition. Total scan time for the multi-delay experiments were 14:48 min. From one patient, an additional scan without background suppression, PLD=1.0s was performed.
Analysis
In order to measure renal perfusion for each scan, the standard single-compartment model4 was adopted:
$$f(i)=\frac{\lambda}{2\alpha{T}_{1b}}\cdot\frac{\Delta{M}(i)}{M_0}\cdot\frac{{e}^{{w(i)}/{T_{1b}}}}{1-e^{{\tau}/{T_{1b}}}}\cdots(1)$$
where λ=0.9mL/g denotes the blood-tissue partition coefficient, ΔM is the signal difference between label and control scans, w(i) is the PLD(=0.5/1.0/1.5/2.0s), α=0.85*0.8 (considering imperfection of BS inversion pulses6) is the labeling efficiency, T1b =1650msis the longitudinal relaxation rate of blood, and τ=1.5s is the labeling duration.
Eq.1 is valid under the assumption that PLD is longer than the arterial transit time (ATT). From this reason, images from multi-delay scans were used to calculate a weighted delay (WD) following Eq.2 and based on the simulation (Fig.1), and then the calculated WD was converted into ATT5.
$${WD}=\frac{\sum_{i=1}^{4}{w(i)\Delta{M(i)}}}{\sum_{i=1}^{4}{\Delta{M(i)}}}\cdots(2)$$
By considering ATT, single-compartment model(Eq.1) can be modified into the following two-compartment model4.
$$f(i)=\frac{\lambda}{2\alpha{T_{1b}}[e^{(\min{(\delta-w(i),0)}-\delta)/T_{1b}}-e^{-(\tau+w(i))/T_{1b}}]}\cdot\frac{\Delta{M(i)}}{{M_0}}\cdots(3)$$ where δ is the ATT. The final perfusion map was generated by averaging the maps from all the PLDs.
For statistical analysis, the f-test was conducted to compare the PSC images with/without background suppression. The Wilcoxon signed rank test was used to compare the two different quantification models.
Results and Discussion
The standard deviation in percent signal change (PSC) was significantly reduced with background suppression for the transplanted kidney patients as shown in Fig.2 (BS=3.44±.33%; non-BS=3.93±2.26%, p<0.01). In renal cortex, the single-compartment model and the ATT‑corrected multi-PLD model showed no significant difference when PLD≥1.5s. In renal medullar, however, the single-compartment model showed mean perfusion estimates slightly lower than those of the two-compartment model, regardless of PLD. The results indicate that for transplanted kidney patients PLD with ≥1.5s may be sufficient for measuring perfusion in renal cortex, single-PLD measurements can estimate perfusion level in renal cortex accurately, but single-PLD measurements may slightly underestimate perfusion in renal medulla.
PSC and renal perfusion maps for each PLD, and multi-parametric perfusion maps (mean renal perfusion and ATT) are displayed for a representative subject in Fig.4. All the maps show clearly distinguishable perfusion distributions in cortex and medulla, consistent with previously reported renal perfusion estimates (264.8±25.7mL/100g/min)3.
Conclusion
We presented preliminary results for the renal ASL perfusion measurements in transplanted kidney patients using multi-delay pCASL with bSSFP readout in 3T MRI system. The background suppression significantly enhanced the data consistency. Single-delay pCASL measurements may be applicable to transplanted kidney patients with PLD≥1.5s for measuring perfusion signals in renal cortex. However, care should be taken for single-PLD pCASL measurement since it may slightly underestimate perfusion in renal medulla. Multi-delay ASL would be desirable not only for accurate quantification of the renal perfusion but also for acquisition of additional perfusion information of arterial transit time. Further studies are necessary to increase number of subjects with more transplanted kidney patients.Acknowledgements
No acknowledgement found.References
[1] Heusch, Philipp, et al. "Functional evaluation of transplanted kidneys using arterial spin labeling MRI." Journal of Magnetic Resonance Imaging 40.1 (2014): 84-89.
[2] Martirosian, Petros, et al. "Fair True‐Fisp Perfusion Imaging of the Kidneys." Magnetic resonance in medicine 51.2 (2004): 353-61.
[3] Artz, Nathan S, et al. "Arterial Spin Labeling Mri for Assessment of Perfusion in Native and Transplanted Kidneys." Magnetic resonance imaging 29.1 (2011): 74-82.
[4] Buxton, Richard B., et al. "A general kinetic model for quantitative perfusion imaging with arterial spin labeling." Magnetic resonance in medicine 40.3 (1998): 383-396.
[5] Dai, Weiying, et al. "Reduced Resolution Transit Delay Prescan for Quantitative Continuous Arterial Spin Labeling Perfusion Imaging." Magnetic resonance in medicine 67.5 (2012): 1252-65.
[6] Ye, Frank Q, et al. "Noise Reduction in 3d Perfusion Imaging by Attenuating the Static Signal in Arterial Spin Tagging (Assist)." Magnetic Resonance in Medicine: An Official Journal of the International Society for Magnetic Resonance in Medicine 44.1 (2000): 92-100.
Figures
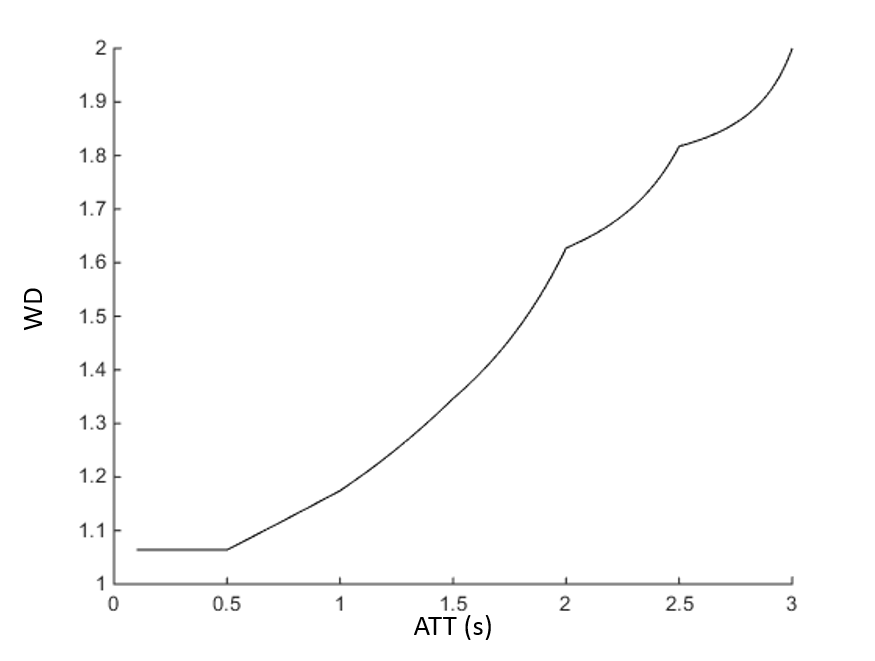
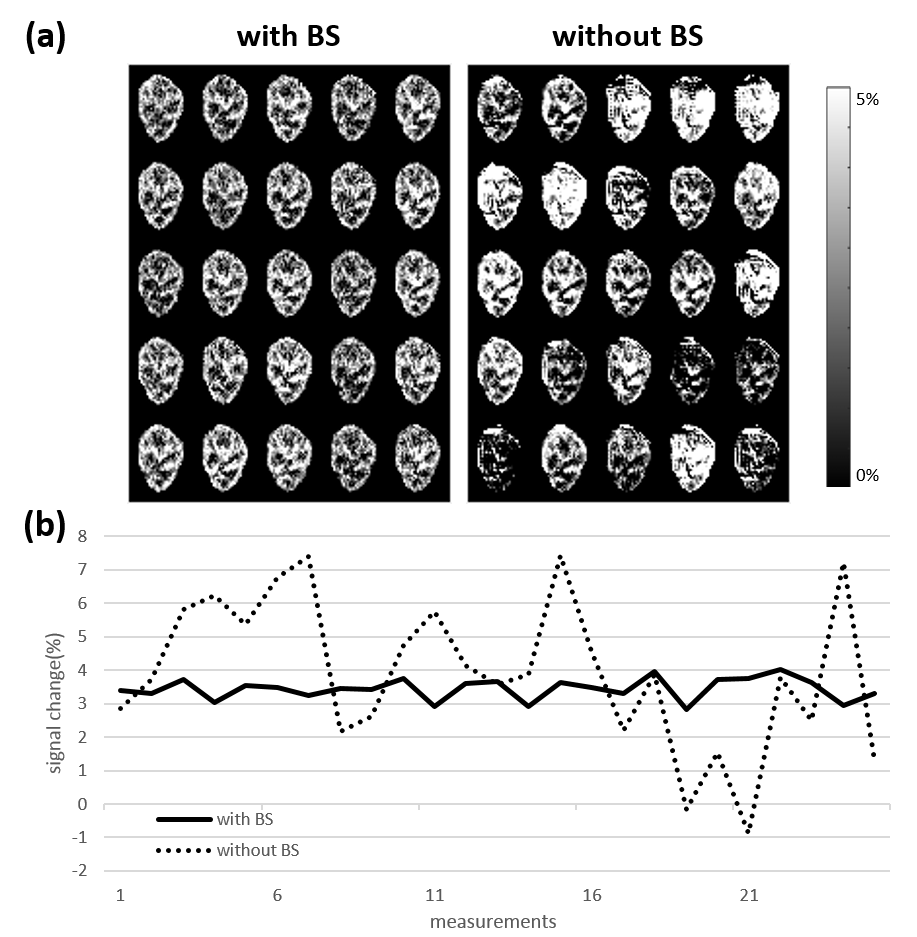
Figure 2. (a) Percent signal change map of the acquired perfusion image with/without background suppression. Temporal resolution of each measurement is 11s.
(b) Mean percent signal change of each measurement at renal cortex with/without background suppression.
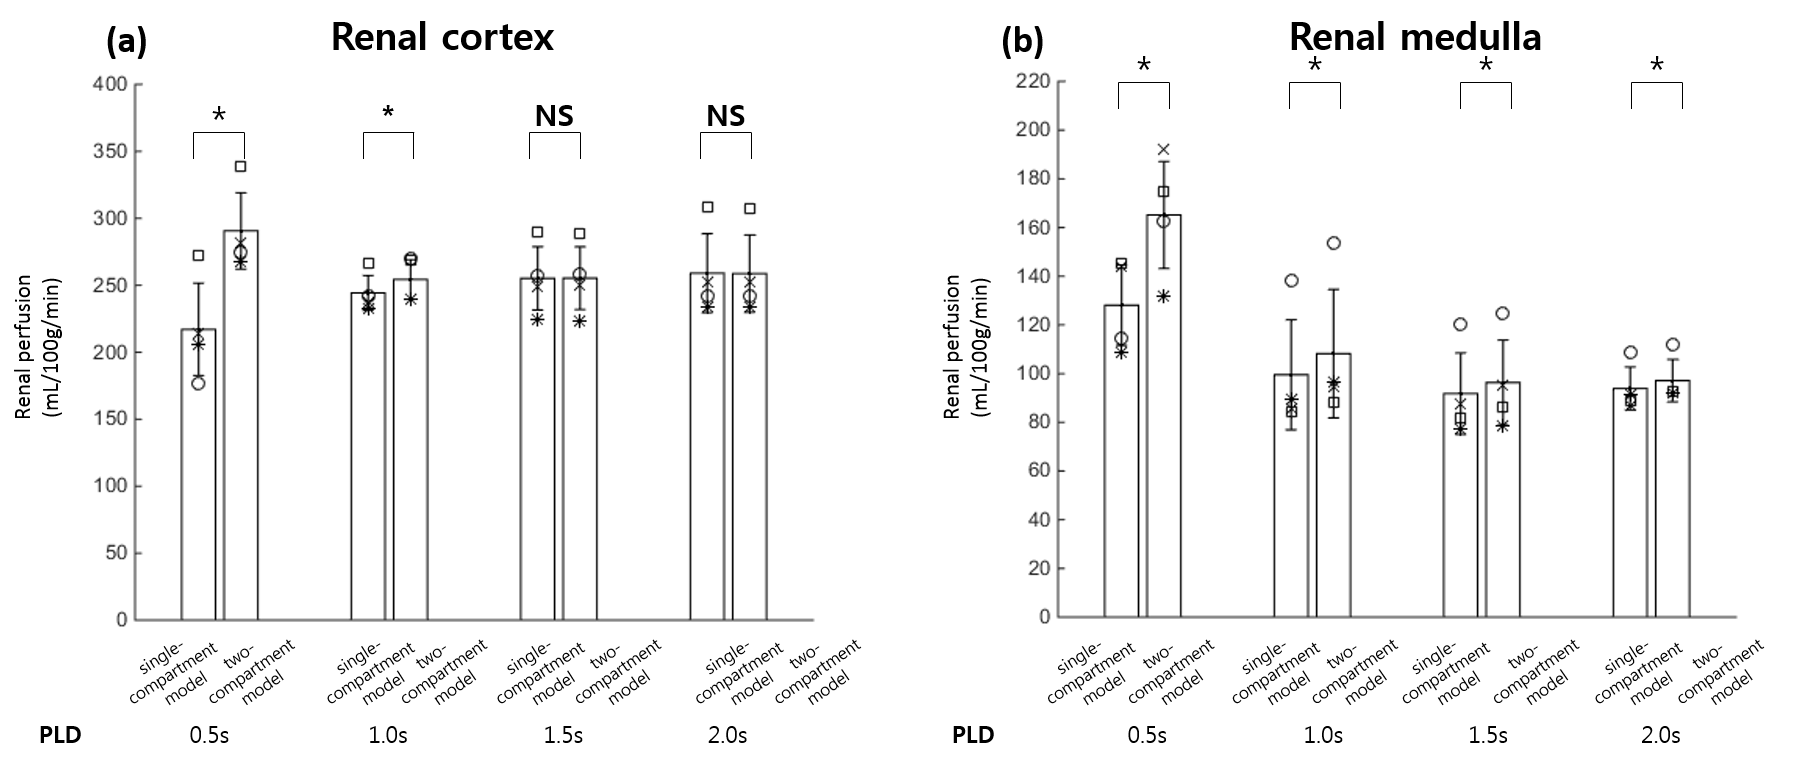
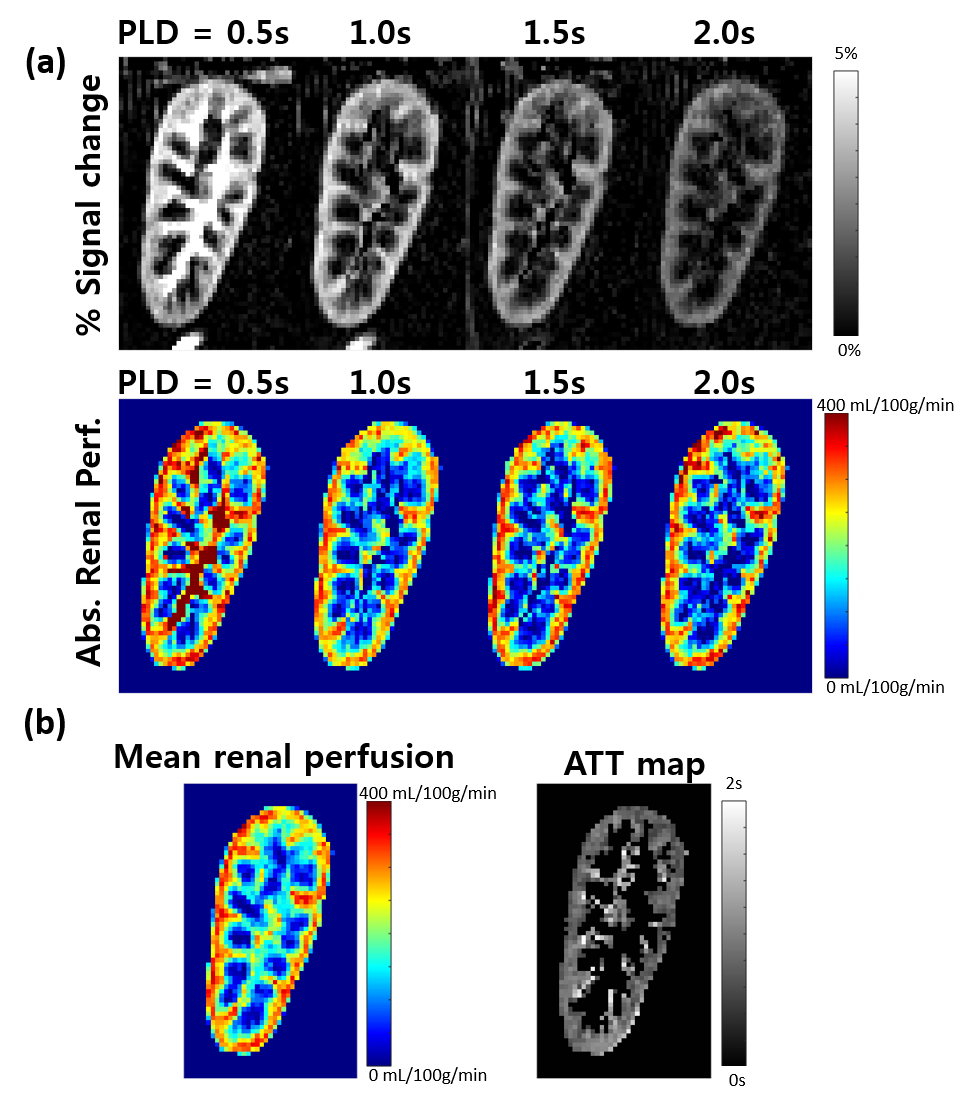
Figure 4. (a) Percent signal change and absolute renal perfusion of the transplanted kidney at each PLD time of 0.5, 1.0 1.5, and 2.0s.
(b) Mean renal perfusion and ATT maps of a transplanted kidney.