0843
Comparison of MR Fingerprinting ASL with Gd-based DSC MRI: validation and direct parametric mapping with deep learning1The Russell H. Morgan Department of Radiology and Radiological Science, Johns Hopkins University School of Medicine, Baltimore, MD, United States, 2Graduate School of Biomedical Sciences, University of Texas Southwestern Medical Center, Dallas, TX, United States, 3F. M. Kirby Research Center for Functional Brain Imaging, Kennedy Krieger Research Institute, Baltimore, MD, United States, 4Department of Neurosurgery, Johns Hopkins University School of Medicine, Baltimore, MD, United States, 5Department of Neurology, Johns Hopkins University School of Medicine, Baltimore, MD, United States, 6Physical Medicine and Rehabilitation, Johns Hopkins University School of Medicine, Baltimore, MD, United States, 7Cognitive Science, Johns Hopkins University, Baltimore, MD, United States
Synopsis
MR Fingerprinting (MRF)-based Arterial-Spin-Labeling (ASL) has been recently proposed as a new approach to measure multiple hemodynamic parameters in a single scan. However, the previous implementation of MRF-ASL lacks the comparison with clinical standard techniques such as dynamic-susceptibility-contrast (DSC). Therefore, in this work, we validated MRF-ASL by comparing with DSC MRI. The results showed that these two methods provided visually comparable and quantitatively correlated perfusion estimations. Furthermore, we sought to directly estimate DSC-equivalent parameters from the MRF-ASL raw data using a deep-learning (DL) approach. DL-derived maps show better quality and are more consistent with DSC maps, compared to dictionary-matching results.
Purpose
MR Fingerprinting (MRF)-based Arterial-Spin-Labeling (ASL) has been recently proposed as a new approach to measure multiple hemodynamic parameters in a single scan1,2. However, the previous implementation of MRF-ASL lacks the comparison with clinical standard techniques such as dynamic-susceptibility-contrast (DSC) MRI. Therefore, in this work, we validated MRF-ASL hemodynamic maps by comparing its results with those from DSC MRI. Furthermore, we sought to directly estimate DSC-equivalent parameters from the MRF-ASL raw data using a deep-learning (DL) approach.Methods
MR Experiment:
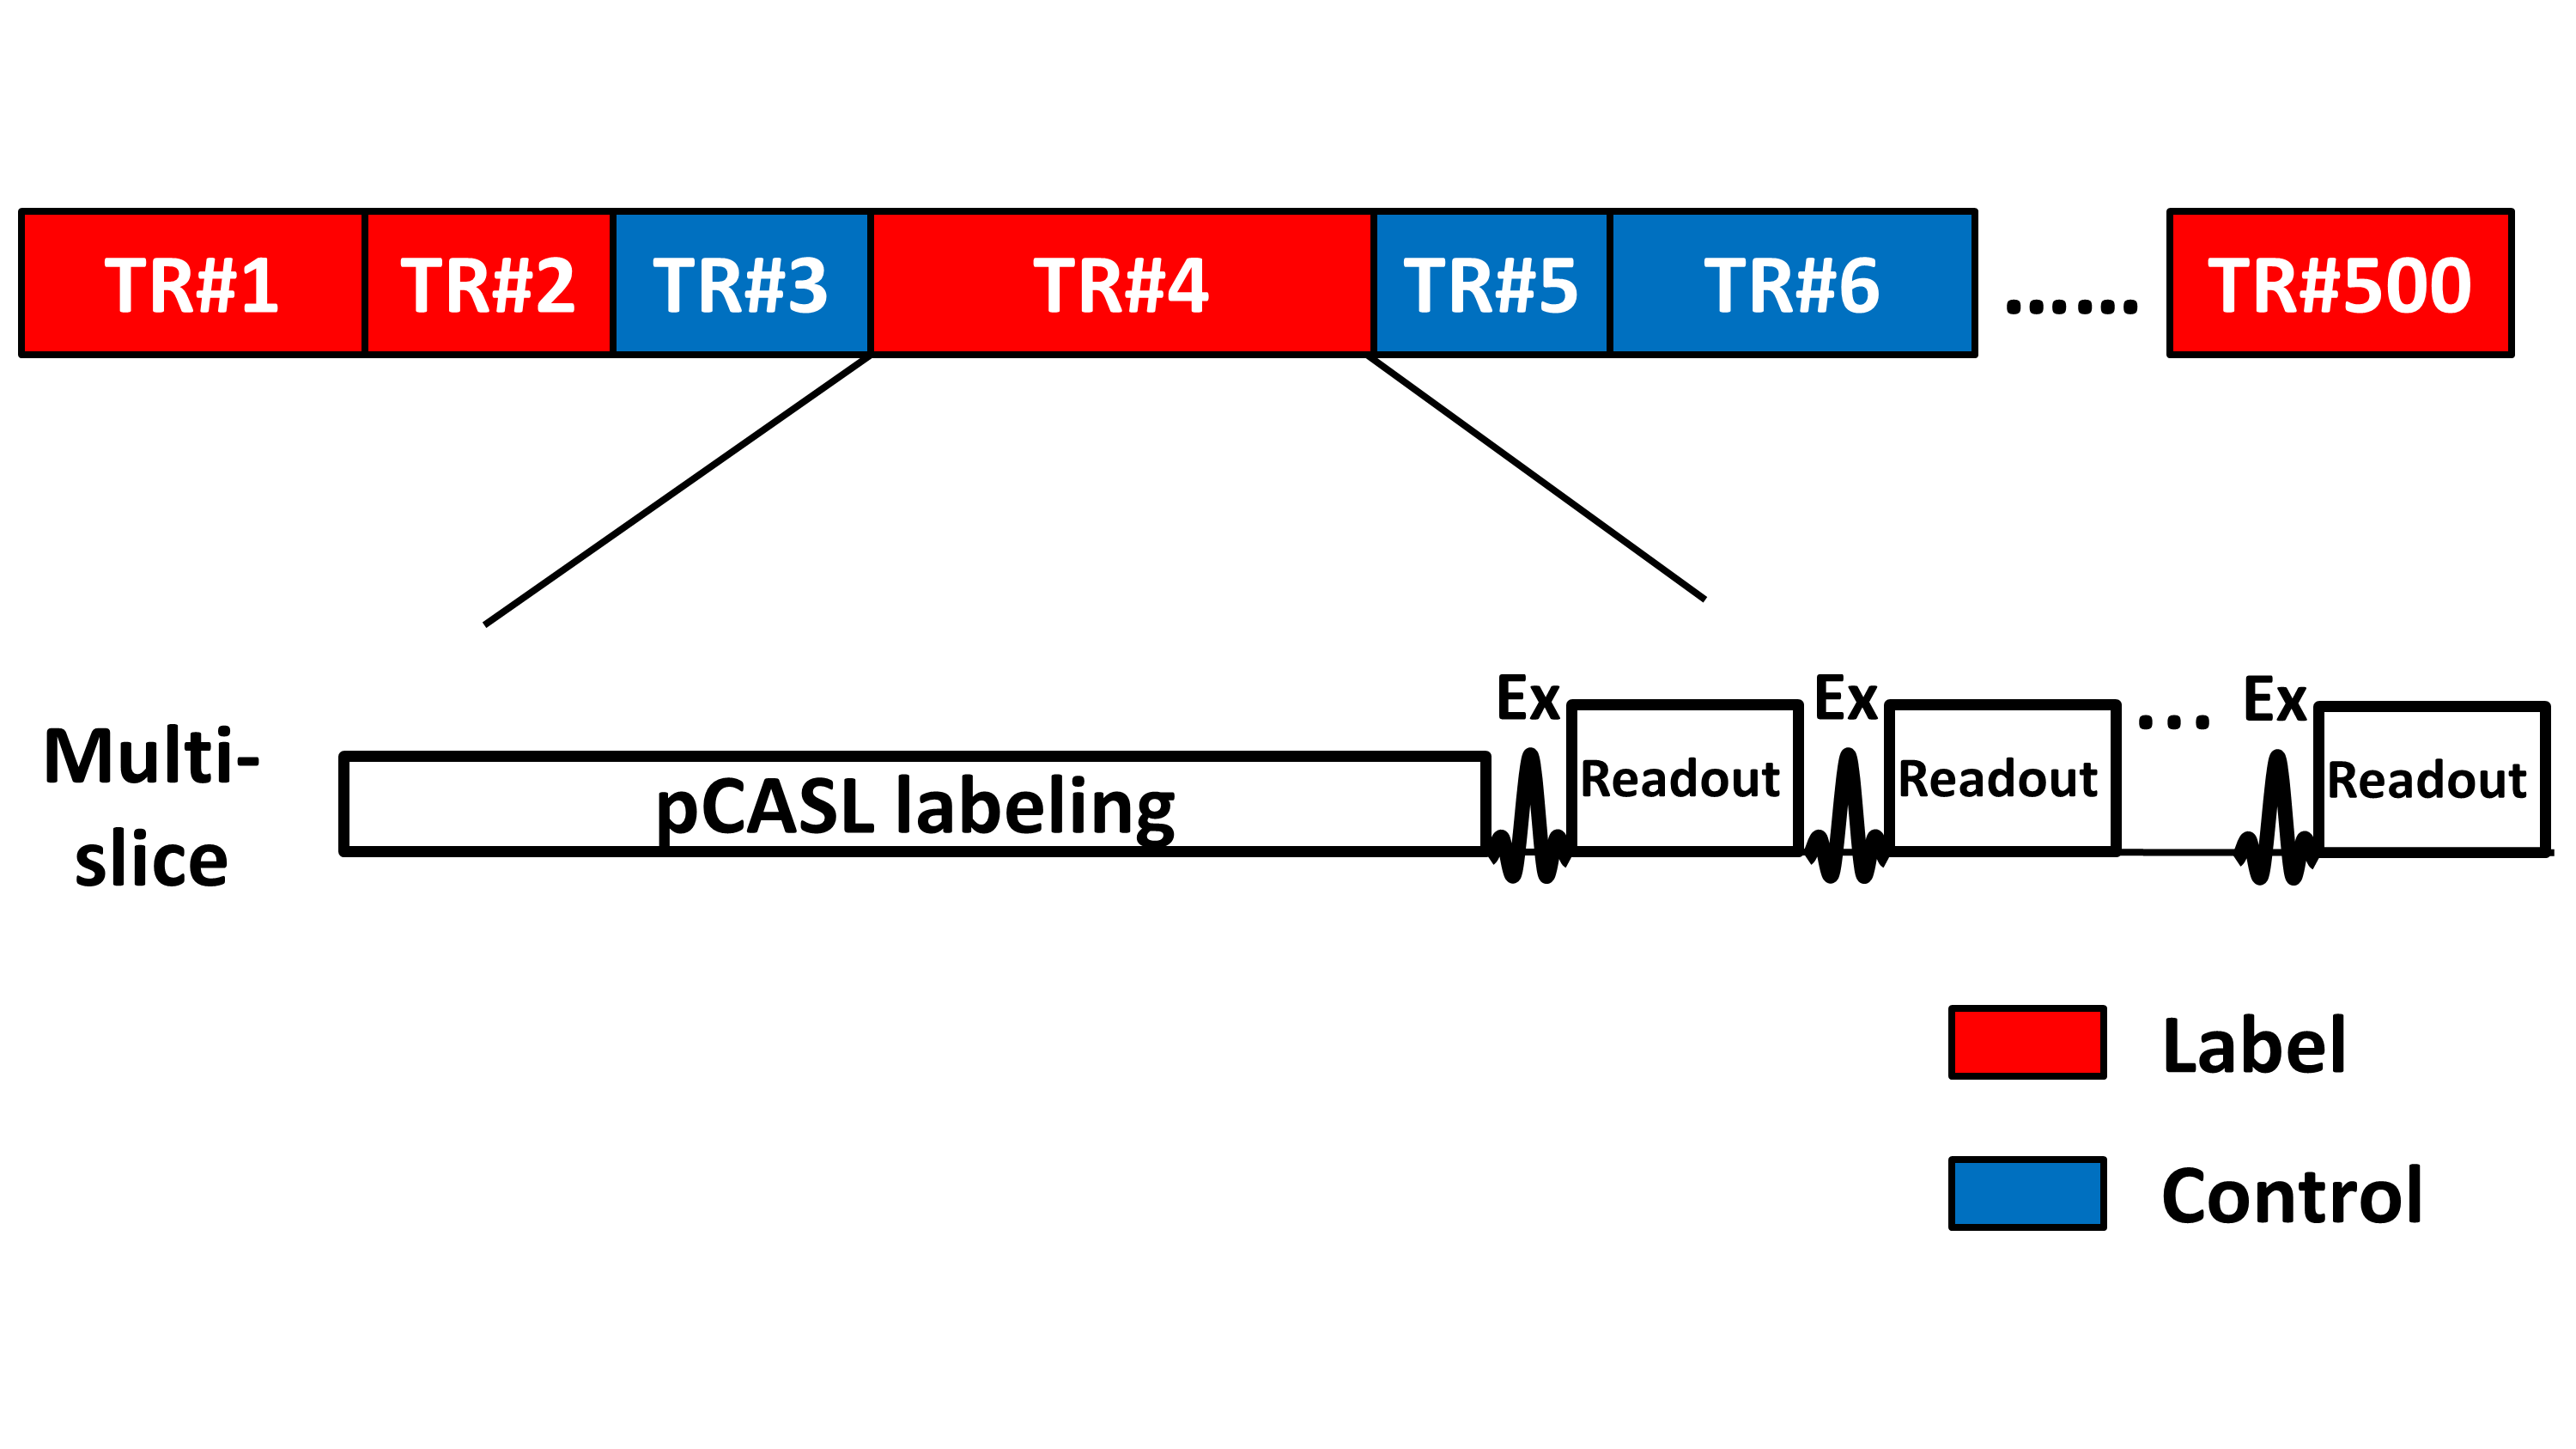
Eight healthy subjects (26±4yo, 4F) were studied on 3T. The MRF-ASL sequence has been described previously1 (Figure 1). This technique can simultaneously quantify up to 7 parameters in a single scan. Imaging parameters of MRF-ASL: multi-slice EPI; matrix size=64×64; voxel size=2.8mm×2.8mmx10mm; 500 dynamics; scan duration=3.7min. DSC scan was also performed: TE/TR=30/1000ms, Gd contrast agent (ProHance), dosage 0.1 mmol/kg, injection rate: 5 ml/s, resolution=2.8×2.8×5 mm, scan duration=1.2min. T1-MPRAGE was also performed.
In addition, MRF-ASL and DSC data were collected in a patient with an arteriostenotic condition, Moyamoya disease, to demonstrate the clinical utility of this technique.
Data Analysis:
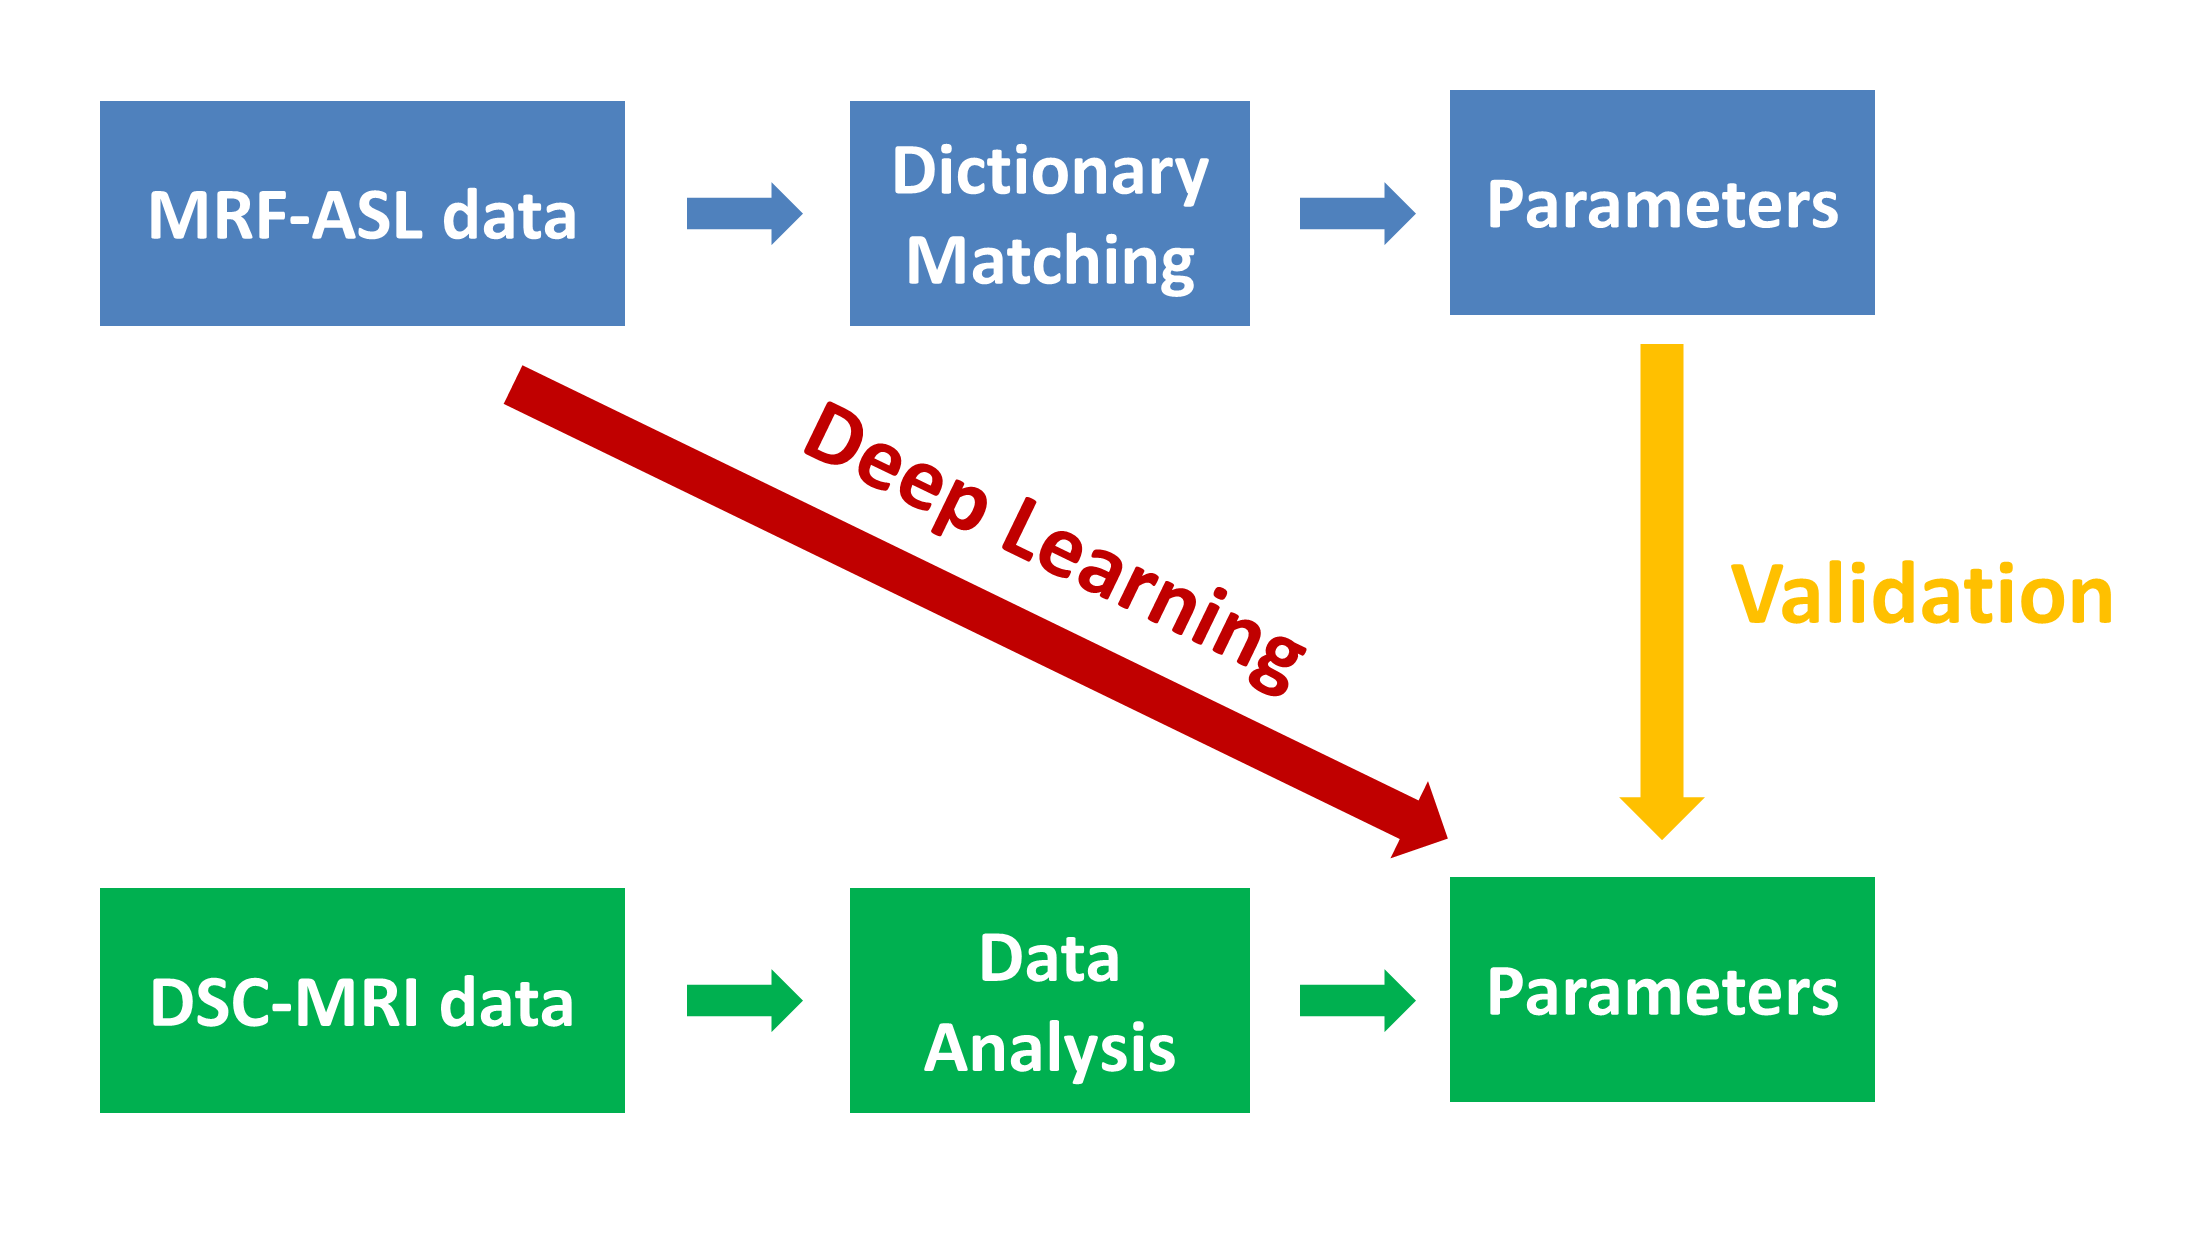
The MRF-ASL raw data, i.e. dynamic signal curve of 500 time points, were analyzed through two pipelines, in accordance with the two goals of the study (Figure 2), i.e. validation and direct parametric estimation.
Validation: In this analysis (yellow arrow in Figure 2), MRF-ASL data were processed to obtain parametric maps using dictionary matching1. The DSC data were analyzed to obtain CBF and time-to-peak (TTP) maps using an FDA-approved software (Olea Sphere). Both MRF-ASL and DSC images were transformed to MNI space. Group averaged parametric maps were then generated by averaging the maps in MNI space from all eight subjects.
ROI analysis was based on the parcellation of MPRAGE using MRICloud3, which parcellates the entire brain into 53 regions. Averaged CBF and BAT values within each region were calculated. Correlation coefficient was calculated for CBF and bolus-arrival-time (BAT) ROI values between MRF-ASL and DSC.
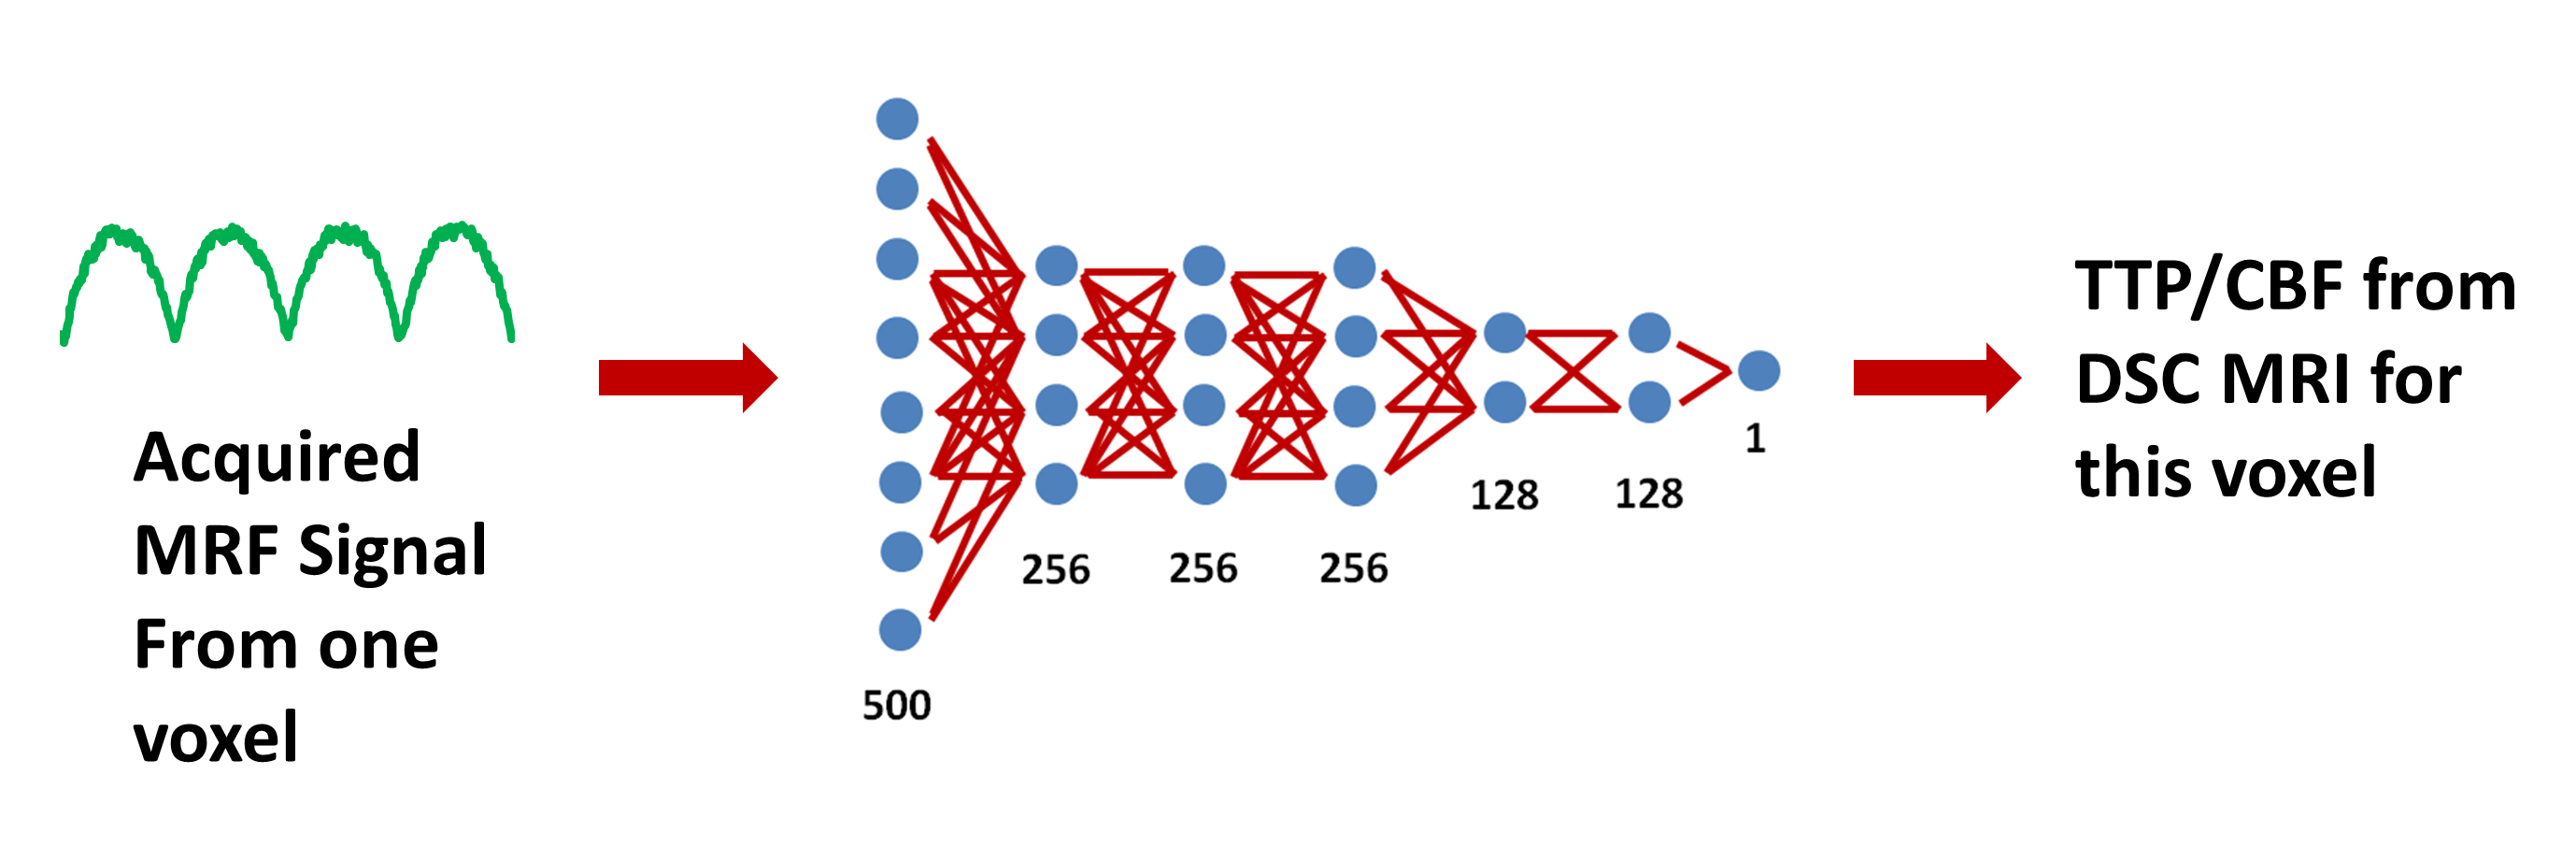
Direct parametric estimation with DL: The goal of this analysis is to use MRF-ASL raw data to directly estimate parameters that are typically measured with DSC MRI. In this pipeline (red arrow), we first used neural-network algorithms to determine the nonlinear mapping from the MRF-ASL raw data as input to DSC hemodynamic parameters as output, using training data. The trained neural-network was then applied to testing data. A seven layer fully-connected neural network was defined, consisting of input/output layers and five hidden layers (Figure 3). The input layer has 500 nodes, corresponding to 500 dynamics MRF-ASL signal evolution; the output layer has one node, corresponding to either CBF or TTP that is usually the outcome of DSC processing. Data from the 8 subjects were divided into two groups, 6 as training and 2 as testing dataset. The network was trained on Tensorflow using the ADAM algorithm4 and mean square error as loss function.
Results and Discussion
Validation of MRF-ASL results with DSC-MRI
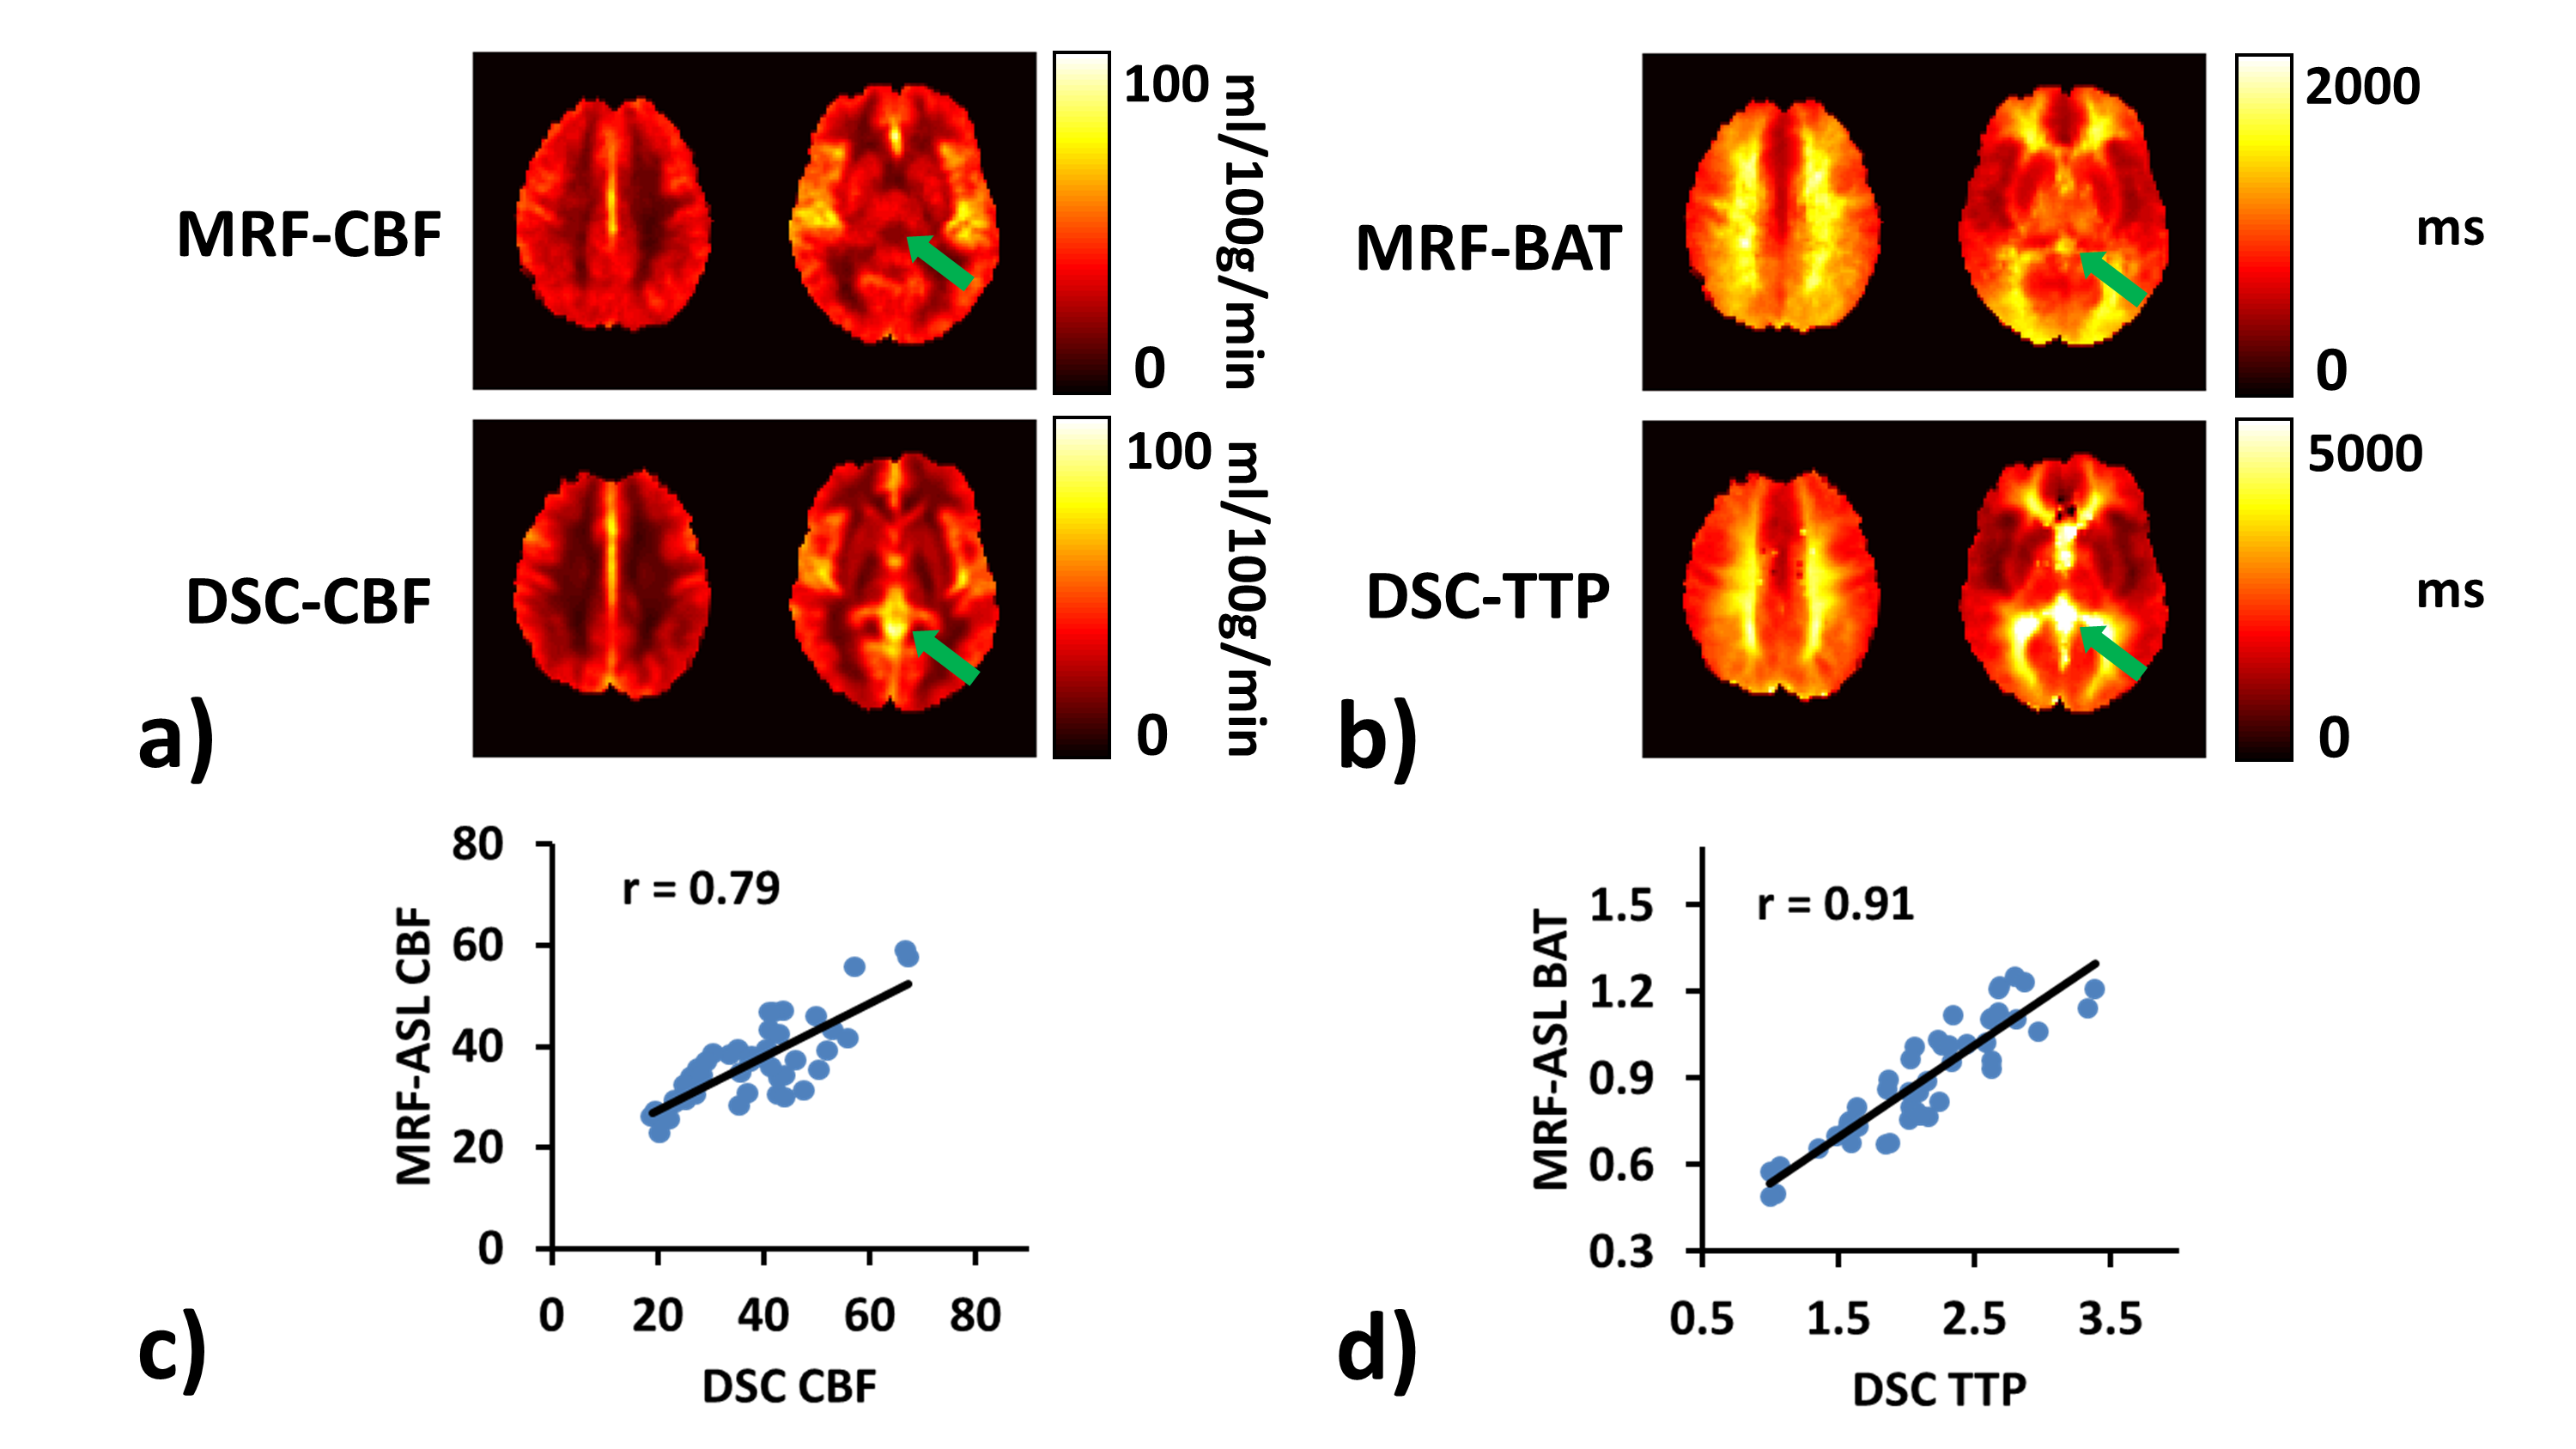
Figures 4a and b show group-averaged (N=8) CBF and BAT/TTP maps using MRF-ASL and DSC, respectively. It can be seen that maps obtained with MRF-ASL show excellent consistency with those from DSC.
Certain differences between the maps can also be seen. One is that the value range of DSC TTP (5s) is generally larger than that of MRF-ASL BAT (2s). This is likely because the bolus in DSC-MRI has more dispersion than MRF-ASL, as the Gd contrast agent was injected in the vein. Bolus dispersion can result in an over-estimation of TTP. On the other hand, MRF-ASL uses a short half-life tracer (i.e. T1 of blood is only 1.5-2s at 3T); thus its ability to estimate BAT longer than 4 seconds may be limited, and may result in an under-estimation of TTP and CBF. This is most obvious in the ventricle regions (green arrows).
Figures 4c and d show scatter plots between region-of-interest (ROI) values measured with MRF-ASL and DSC-MRI. A strong correlation is observed for both parameters (p<0.001).
Direct estimation of DSC hemodynamic parameters from MRF-ASL data
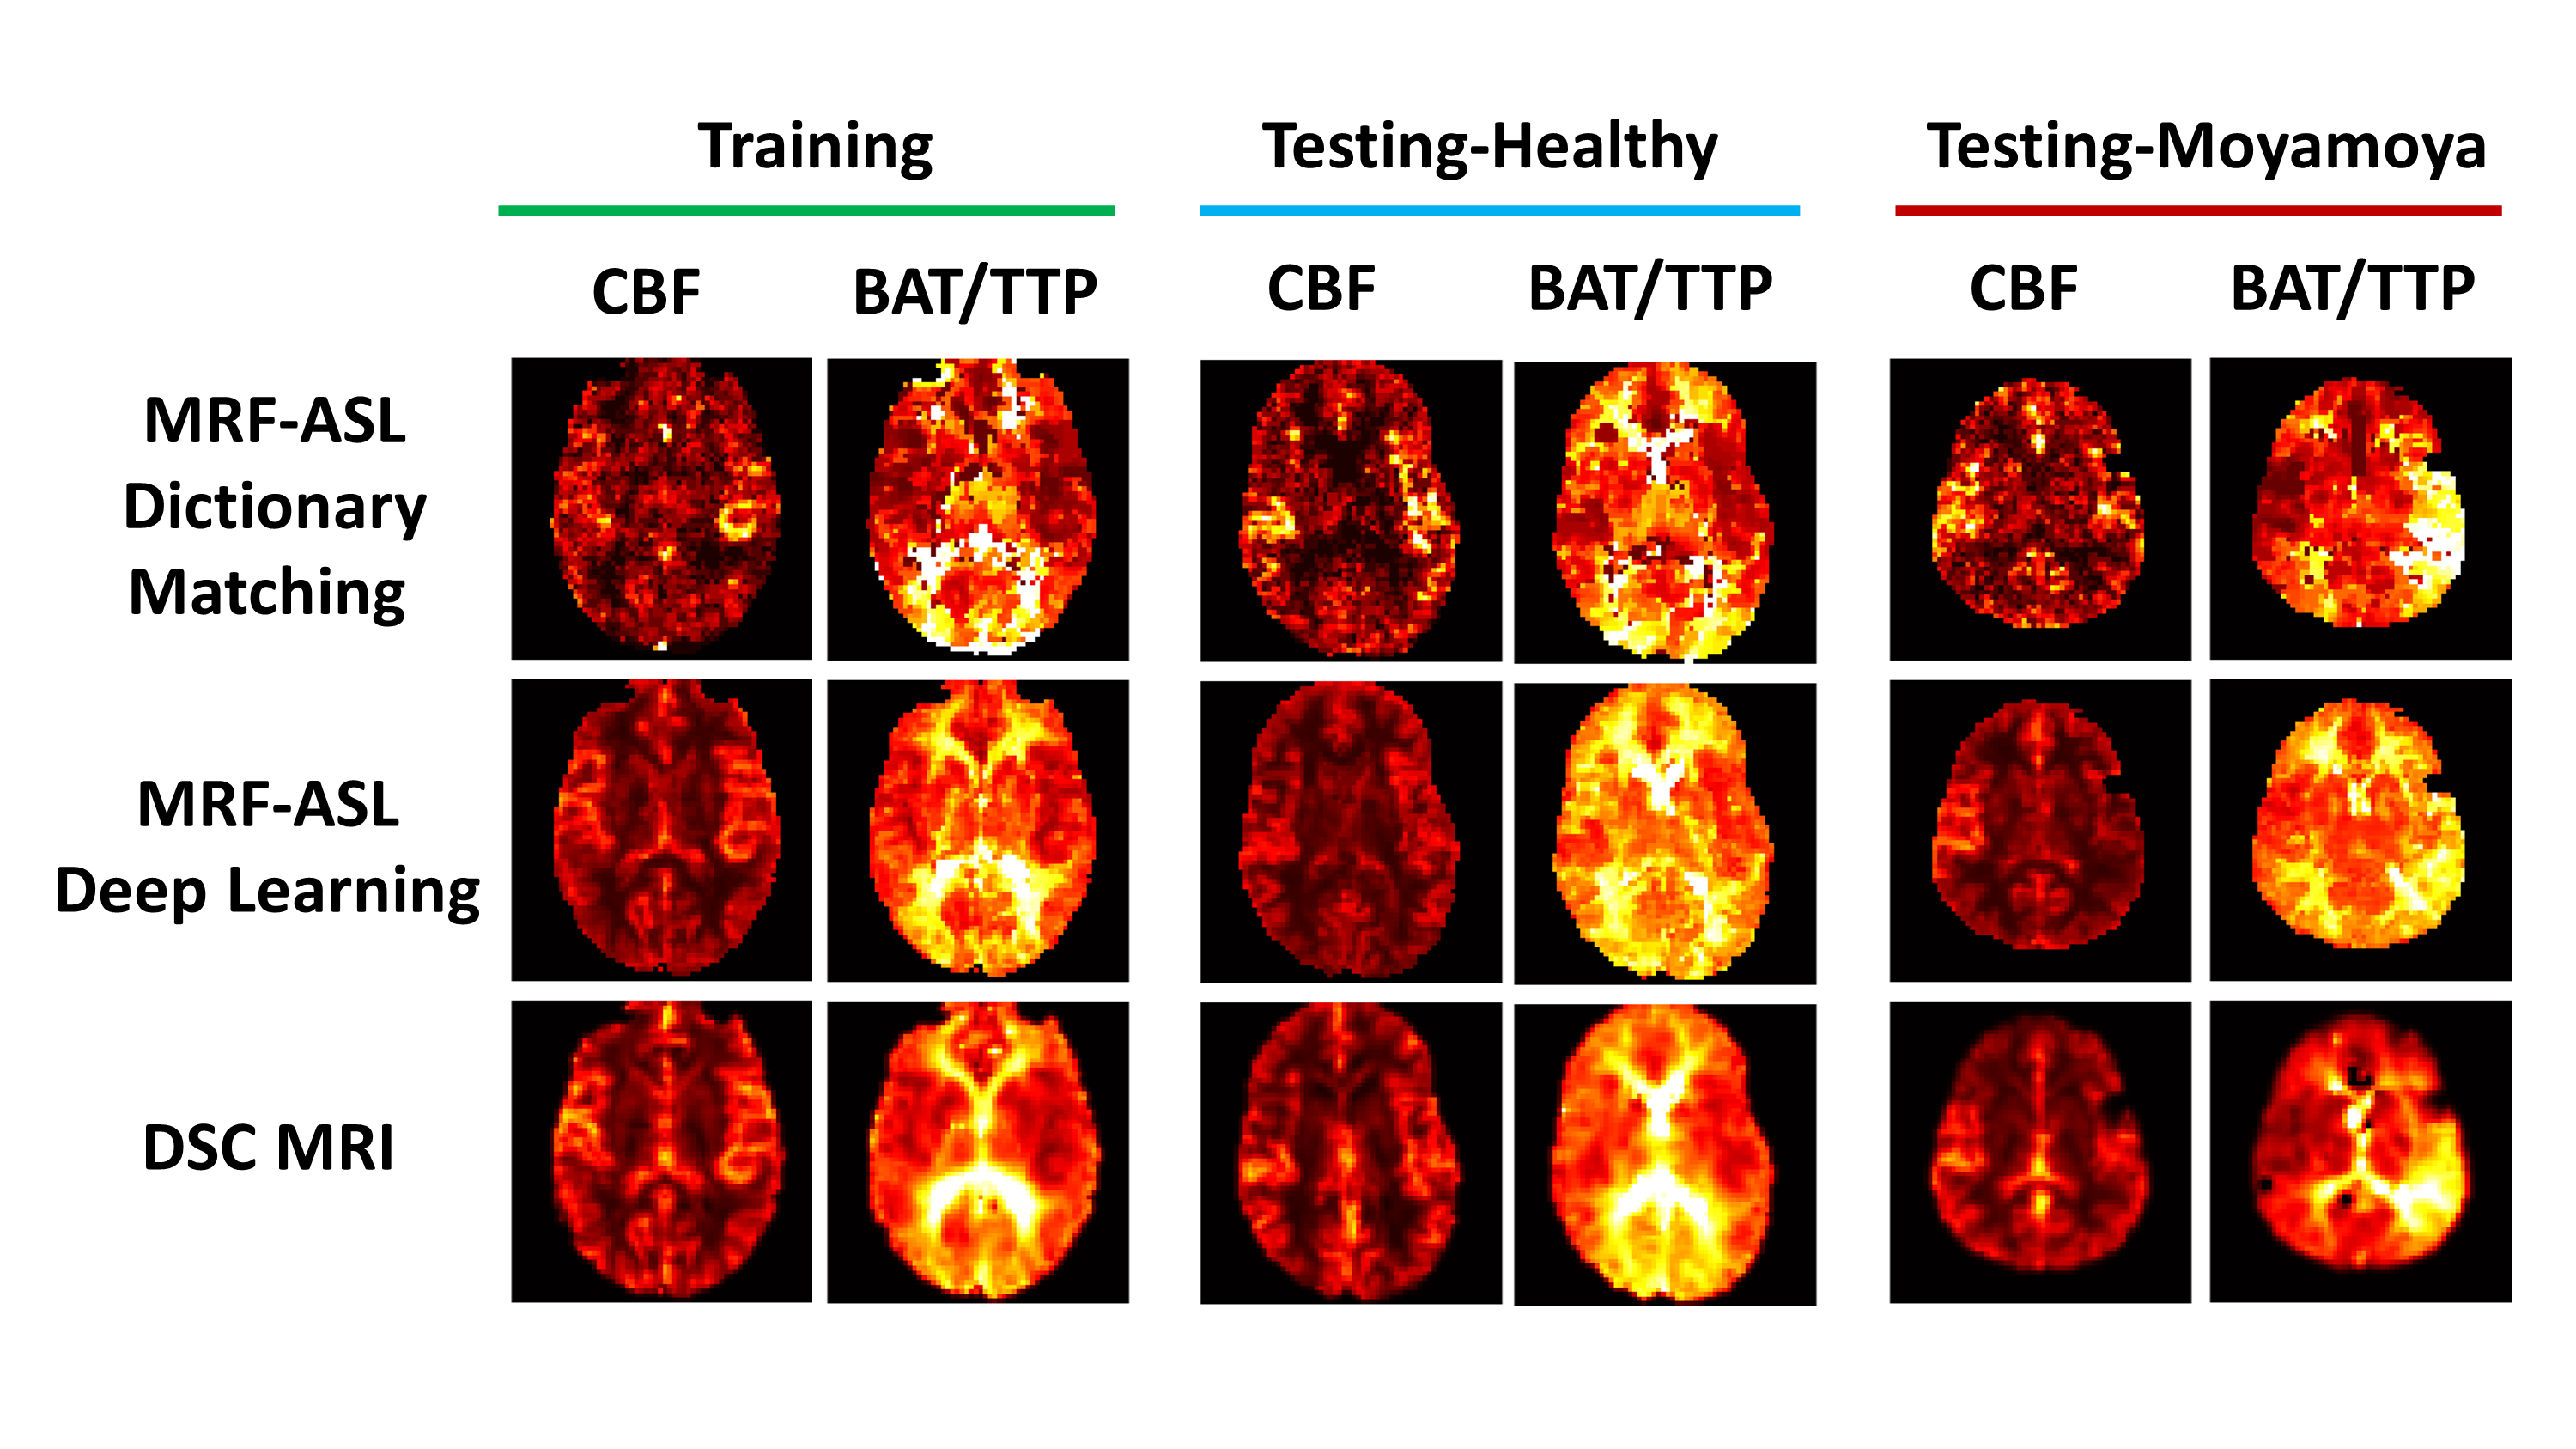
Figure 5 shows DSC parameters (i.e. CBF and TTP) derived directly from MRF-ASL data (middle row), in comparison with dictionary-matching derived parameters (top row) and DSC-MRI results (bottom row). Results from three individual subjects, corresponding to training subject (left column), testing healthy subject (middle column), and testing Moyamoya patient are also shown. It can be seen that DL-derived maps show better quality and are more consistent with DSC maps, compared to dictionary-matching results.
Conclusion
MRF-ASL can provide validated hemodynamic perfusion maps and, furthermore, can be directly used to estimate DSC-equivalent parameters.Acknowledgements
No acknowledgement found.References
1. Su P, Mao D, Liu P, Li Y, Pinho MC, Welch BG, Lu H. Multiparametric estimation of brain hemodynamics with MR fingerprinting ASL. Magn Reson Med 2017;78:1812-1823.
2. Wright KL, Jiang Y, Ma D, Noll DC, Griswold MA, Gulani V, Hernandez-Garcia L. Estimation of perfusion properties with MR Fingerprinting Arterial Spin Labeling. Magn Reson Imaging 2018;50:68-77.
3. Mori S, Wu D, Ceritoglu C, Li Y, Kolasny A, Vaillant MA, Faria AV, Oishi K, Miller MI. MRICloud: Delivering High-Throughput MRI Neuroinformatics as Cloud-Based Software as a Service. Comput Sci Eng 2016;18:21-35.
4. Kingma D, Ba J. Adam: A method for stochastic optimization.2014. arXiv preprint. arXiv1412.6980.
Figures