0835
Radiomic features from enhancing tumor on pre-treatment multiparametric MRI scans are predictive of response to chemo-radiation therapy in Glioblastoma and are associated with histological phenotypes1Case Western Reserve University, Cleveland, OH, United States, 2Cleveland Clinic, Cleveland, OH, United States
Synopsis
We presented the initial results of employing 3D radiomic descriptors from pre-treatment MP-MRI scans for tumor risk stratification based on patient’s response to chemo-radiation treatment. We demonstrated that the CoLlAGe (captures tumor heterogeneity) and Laws (captures Levels, waves, and ripple appearances) features from the enhancing region were most predictive of response to CRT. These features were also found to be associated with histologic attributes including cellular tumor, infiltrating tumor, and hyperplastic blood vessels, each of which is known to contribute to treatment resistance in the tumor microenvironment
Purpose
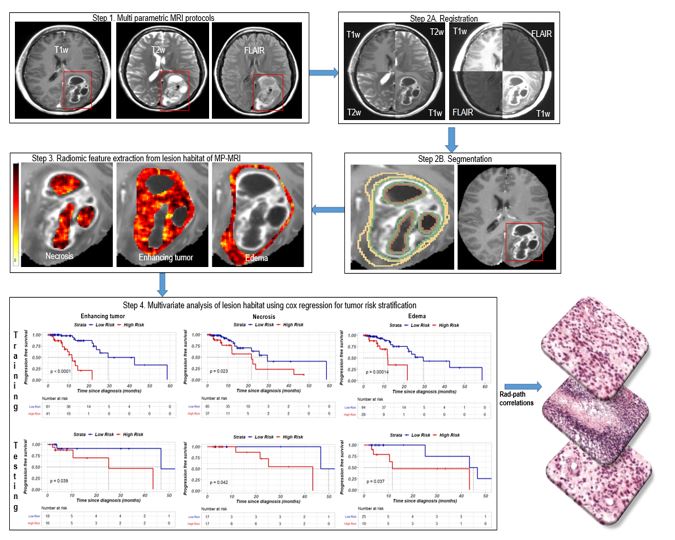
Purpose: Glioblastoma (GBM) is the most aggressive brain tumor with a median survival of 14 months. Unfortunately, the standard-of-care treatment therapy (CRT) treatment fails in > 40% of all patients within 6-months of treatment;. likely on account of highly infiltrative and heterogeneous nature of the disease. Consequently, there is a need to identify patients who might benefit from CRT from the ones who may not respond.. Recently, radiomics (computerized feature extraction from radiological images) has provided a surrogate mechanism to non-invasively characterize the tumor by capturing local macro and micro-scale morphologic changes in texture patterns (e.g. roughness, image homogeneity, regularity, edges). In this work, we analyzed the lesion heterogeneity on routine multi-parametric MRI (MP-MRI) by interrogating radiomic features from the “lesion habitat" (comprising enhancing tumor, necrotic core, edema) to determine if we could predict response to CRT. Further, in an attempt to provide a mechanistic understanding of the radiomic features, we correlated the most predictive features with the corresponding histologic attributes that are known to impact response to CRT.Methods
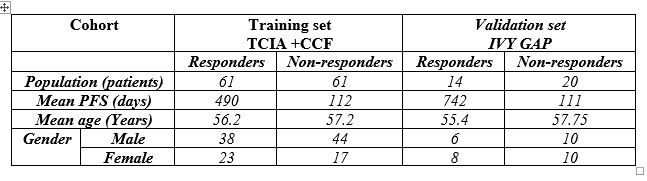
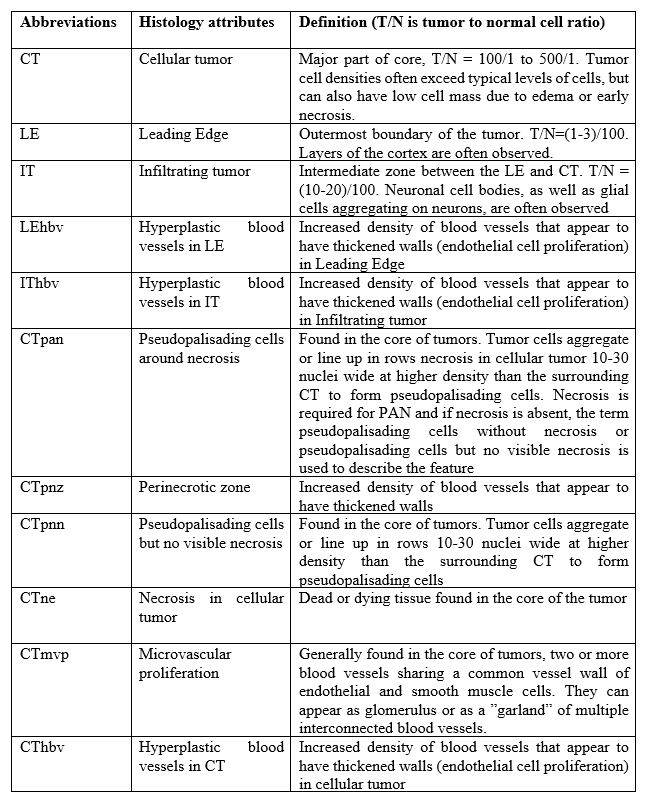
A total of 156 MP-MRI studies (Gd-T1w, T2w, FLAIR) were obtained from TCIA (N=90), Ivy-GAP (N=34), and Cleveland clinic (CCF, N=32). While TCIA and CCF studies were used for training, Ivy-GAP studies were used for validation. A total of 11 histological attributes as measured on digitized surgical specimens were also available for every study in the validation cohort (Table 2). Criteria for determining response to CRT was based on the median progression-free survival (PFS) obtained from the training cohort, such that patients with less than 6.7 months of PFS were defined as non-responders, while patients with more than 6.7 months of PFS were defined as responders to CRT[1]. The demographics and clinical characteristics of patients in discovery and validation cohort are shown in Table 1. Our workflow (Figure 1) involved co-registration of the 3 MRI sequences using MNI atlas [2,3], followed by pre-processing involving skull stripping [4], bias correction [5] and intensity standardization [6],and expert delineation of enhancing tumor, and necrotic core and edema. A total of 1008 3D radiomic features including gradient, Haralick, CoLlAGe, and LAWS were extracted on a per-voxel basis for every region (edema, necrosis, enhancing tumor), for each of the MRI protocols.. Following feature pruning, we performed multivariable cox proportional hazard model and survival analysis to stratify patients according to their treatment response for each compartment. The difference in the survival curves of the high-risk and low-risk groups was evaluated by using a weighted log-rank test (the G-rho rank test, rho = 1) and quantification of discrimination performance of each compartment was assessed by Harrell concordance index [7]. Further, the most predictive radiomic features from each compartment were correlated with the 11 histological attributes using Spearman correlation analysis with 5% false discovery rate.Results & Discussion
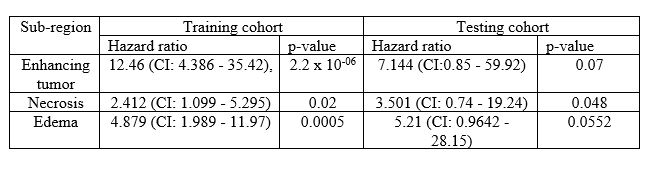
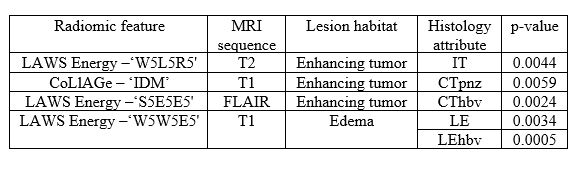
The most predictive features belong to LAWS and CoLlAGe feature families, extracted from the enhancing lesion, across the training (concordance index =0.8) and validation cohort (0.71). The concordance index using the most predictive features from the necrotic region was 0.67 and 0.65 on the training and validation cohorts, while from the edema region was 0.69 and 0.68, respectively. The corresponding Hazard ratios or each of the compartments are provided in Table 3 The predictive features from enhancing tumor were identified as CoLlAGe inverse difference moment (IDM) which captures image heterogeneity via gradient orientations and LAWS features which capturelevels, edges, spots, waves, or ripples appearances. These radiomic features were found to be associated with the extent of cellular tumor, infiltrating tumor, hyperplastic blood vessels in cellular tumor, while the Laws features from the edema region were found to be associated with the extent of leading edge and hyperplastic blood vessels in leading edge respectively as shown in Table 4.Conclusion
We identified a set of radiomic features from the enhancing lesion on pre-treatment MRI that may be predictive of response to CRT. These features were also identified to be associated histology attributes that are known to impact response to CRT. For instance, Laws features were found to be associated with the extent of cellular tumor, and infiltrating tumor, both of which are known to contribute to CRT resistance in the tumor microenvironment. Similarly, radiomic features from edema, were found to be associated with the presence of hyperplastic blood vessels in the leading edge, which is similarly known to contribute in angiogenesis and cause CRT resistance in tumor cells.Acknowledgements
No acknowledgement found.References
1. Rosen BS, Wahl DR, Cao Y, Balter J, Parmar H, Kim MM, et al. Radiomic Signature to Predict Response to Chemoradiation in Postoperative GBM Patients. International Journal of Radiation Oncology • Biology • Physics [Internet]. 2017 [cited 2018 Jul 10];99:S81. Available from: https://www.redjournal.org/article/S0360-3016(17)31246-4/fulltext
2. Co-Planar Stereotaxic Atlas of the Human Brain: 3-Dimensional Proportional System: An Approach to Cerebral Imaging. :3.
3. Fedorov A, Beichel R, Kalpathy-Cramer J, Finet J, Fillion-Robin J-C, Pujol S, et al. 3D Slicer as an image computing platform for the Quantitative Imaging Network. Magnetic Resonance Imaging [Internet]. 2012 [cited 2018 Oct 16];30:1323–41. Available from: http://www.sciencedirect.com/science/article/pii/S0730725X12001816
4. Bauer S, Fejes T, Reyes M. A Skull-Stripping Filter for ITK. The Insight Journal [Internet]. 2012 [cited 2018 Oct 11];859. Available from: http://hdl.handle.net/10380/3353
5. Tustison NJ, Avants BB, Cook PA, Zheng Y, Egan A, Yushkevich PA, et al. N4ITK: Improved N3 Bias Correction. IEEE Transactions on Medical Imaging. 2010;29:1310–20.
6. Madabhushi A, Udupa JK. New methods of MR image intensity standardization via generalized scale. In: Fitzpatrick JM, Reinhardt JM, editors. San Diego, CA; 2005 [cited 2018 Oct 16]. p. 1143. Available from: http://proceedings.spiedigitallibrary.org/proceeding.aspx?doi=10.1117/12.595925
7. Gönen M, Heller G. Concordance probability and discriminatory power in proportional hazards regression. Biometrika [Internet]. 2005 [cited 2018 Oct 23];92:965–70. Available from: http://academic.oup.com/biomet/article/92/4/965/389449/Concordance-probability-and-discriminatory-power
Figures