0830
Dual Contrast MRI for Visualization of Whole Brain Macro and Microvascular Remodeling in Rat Ischemic Stroke Model1Department of Biomedical Engineering, Ulsan National Institute of Science and Technology (UNIST), Ulsan, Korea, Republic of
Synopsis
Because of therapeutic and prognostic significance, the visualizations and quantifications of vascular remodelings are crucial for ischemic stroke brains. In this work, dual contrast MRI was implemented on tMCAO rats as an ischemic stroke model to visualize whole-brain macro- and micro-vascular remodeling. In additional to R1 based UTE-MRA, which showed macrovascular remodeling, simultaneously acquired VSI, Q and MVD metrics from ΔR2-ΔR2*-MRI showed microvascular remodeling in ischemic reperfused rat brains.
Introduction
Ischemic stroke occurs when blood supply to part of the brain is obstructed1. Reduction of blood flow results in two-phase of vascular remodeling, which are often referred as arterio-genesis and angiogenesis2,3. Each occur at macro- and micro-vascular level, respectively. Thus, MR method of longitudinally monitoring arterio-genesis and angiogenesis of ischemic brain is of particular importance for the prognosis and therapeutic measures. In this work, using a superparamagnetic iron-oxide nanoparticles (SPION) as a single contrast agent, dual contrast MRI was performed on transient middle cerebral artery occlusion (tMCAO) rat model to visualize macro- and micro-vascular remodeling after ischemic stroke. R1 based Ultrashort-TE (UTE)-MRA was combined with R2-R2*-MRI.Methods
Normal male Wistar rats (body weight 250~310g) underwent one hour of MCAO. Using 7 T MR scanner (Bruker, Ettlingen, Germany), dual contrast MRI was acquired. Imaging parameters for UTE sequence were as follows: TR/TE = 22/0.012 ms; FA = 40 °; FOV = 30×30×30 mm3; matrix size = 512×512×512. Imaging parameters for Multiple Gradient Echo (MGE) and Multi Slice Multi Echo (MSME) sequences were as follows: TR = 6000 ms; TE (MGE) = 3-59 ms (echo spacing = 4 ms); TE (MSME) = 8-160 ms (echo spacing = 8 ms); FA = 90 °; matrix size = 256×256; FOV = 30×30 mm2. SPION was injected at a dose of 360 μmol Fe/kg for UTE, MGE and MSME sequences. Vessel size index (VSI), microvascular density (Q and MVD) are calculated from following equations4-6:
$$VSI(mm) = 0.425(D/\gamma \triangle\chi B_{0})^{1/2}(\triangle R_2^*/\triangle R_{2})^{3/2}, Q(s^{-1/3}) \equiv \triangle R_{2}/(\triangle R_2^*)^{2/3}, MVD(mm^{-2}) \approx Q^{3}/(4.725D)$$
(D : local diffusion coefficient, Δχ : blood magnetic susceptibility due to SPION, γ : gyromagnetic ratio, ΔR2-ΔR2* : transverse relaxation rates)
Results
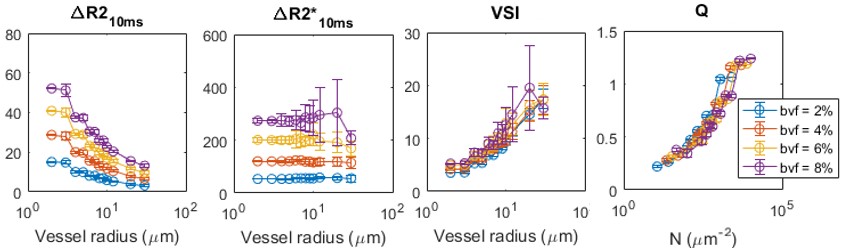
Figure 1 shows correlations between VSI and Q with respect to vessel size and vessel density, respectively. As BVF changes, various radius of cylinder shape vessels are generated, and signal intensity change due to injection of SPION was simulated. Then, VSI and Q are calculated from ΔR2 and ΔR2*. VSI and Q show linear relationship with true vessel size and true vessel density, respectively.
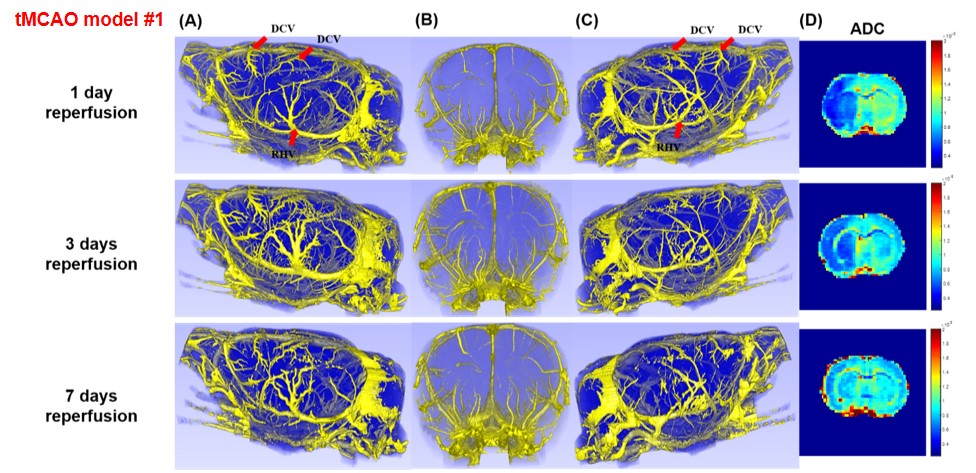
tMCAO rat brain UTE-MRAs and ADC are shown in figure 2. At 1 day reperfusion, RHV in lateral view of ipsilateral hemisphere (A) shows different structure when compared to that of lateral view of contralateral hemisphere (C). Dilated DCV and RHV are apparent in 3 days reperfusion (A), when compared to those of 1 day reperfusion (A). As reperfusion time goes from 3 days to 7 days, DCV and RHV in (A) are getting thinner, and RHV shows tortuous structure. According to (D), ADC of ipsilateral hemisphere goes to normal range at 7 days reperfusion.
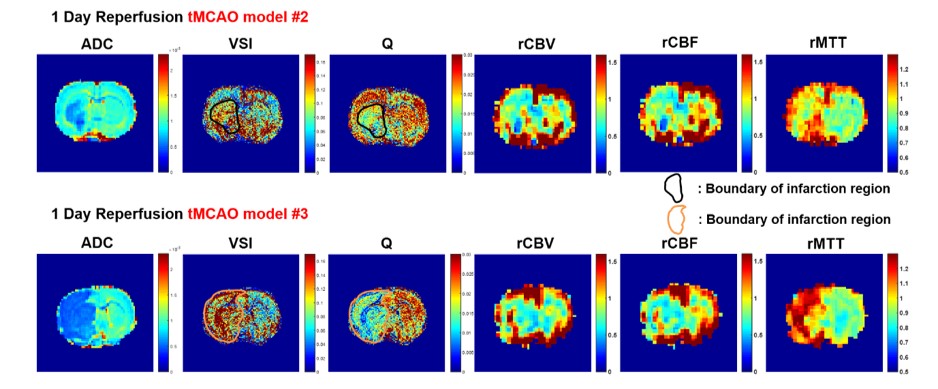
Figure 3 shows ADC, VSI, Q, rCBV, rCBF, and rMTT of 1 day reperfusion tMCAO models. Two tMCAO models show different infarction size in ipsilateral hemisphere. The location of abnormal ADC, and VSI and Q values appears co-localize as marked with boundary line of infarction region. DSC-MRI provides rCBV, rCBF and rMTT information of tMCAO models, but those changes were less related to abnormal ADC/VSI/Q regions.
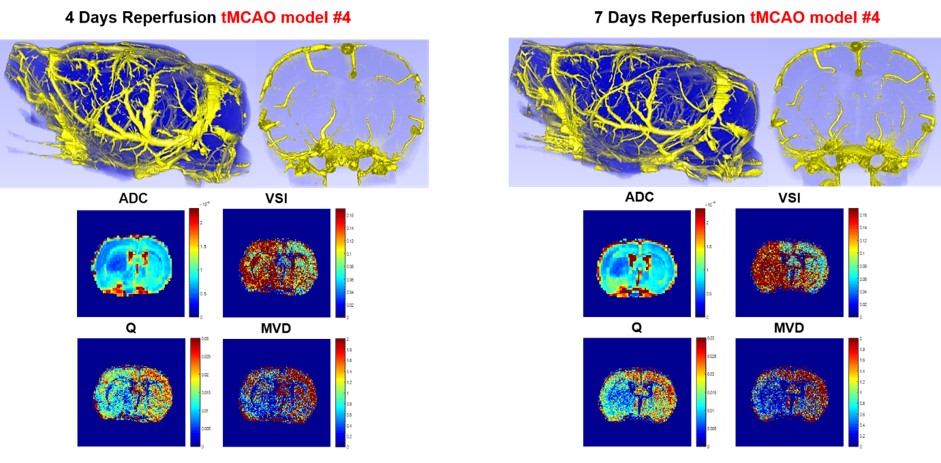
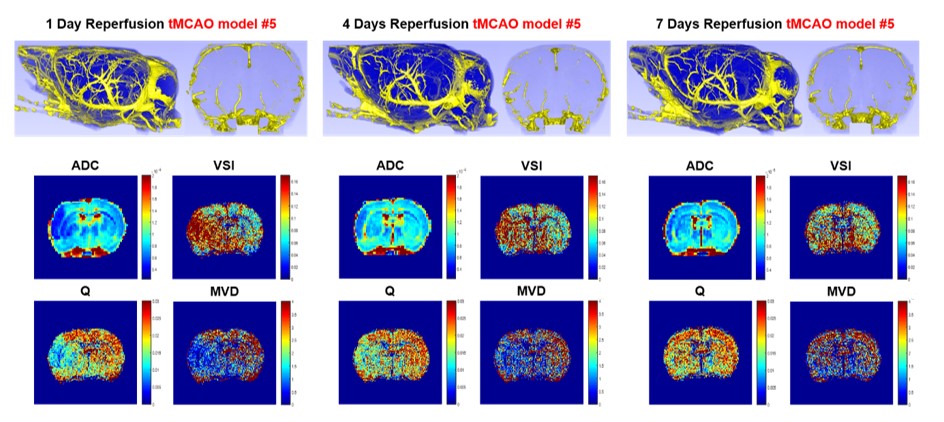
As reperfusion time goes from 4 days to 7 days, alternations in UTE-MRA, ADC, VSI, Q and MVD are shown in figure 4. Anterior-to-posterior view of UTE-MRA shows macrovascular in tMCAO rat brain. Slice thickness and slice position are same with ADC, VSI, Q and MVD. After 7 days of reperfusion, UTE-MRA shows thinner (normal) diameter of DCV and RHV in lateral view of ipsilateral hemisphere than those of 4 days reperfusion. However, microvascular size in VSI of ipsilateral hemisphere is getting thicker and microvascular density in Q and MVD of ipsilateral hemisphere is getting sparser than those of 4 days reperfusion. It is clearly observed that the behavior of macro- and micro-vasculature can be different in certain cases, which warrants the necessity of simultaneous monitoring of arterio- and angio-genesis.
In figure 5, RHV and DCV in UTE-MRAs of lateral view of ipsilateral hemisphere and VSI in infarction region show thinner macro- and micro-vascular size and Q and MVD in infarction region show denser microvascular density as reperfusion time goes from 1 day to 7 days. However, ADC of ipsilateral hemisphere goes to normal range at 4 days reperfusion, which shows no correlation with VSI/Q/MVD.
Discussion
In this work, using a SPION as a single contrast agent, R1 based UTE-MRA and R2-R2*-MRI were simultaneously acquired to visualize macro- and micro-vascular remodeling in rat ischemic stroke model. The observed different behaviors of macro- and micro-vasculature during recovery suggests that simultaneous longitudinal monitoring of arterio- and angio-genesis is possible and necessary.Acknowledgements
This work was supported by National Research Foundation of Korea under Grant number 2018M3C7A1056887.References
1. Boehm‐Sturm, Philipp, et al. "Vascular changes after stroke in the rat: a longitudinal study using optimized magnetic resonance imaging." Contrast media & molecular imaging 8.5 (2013): 383-392.
2. Chen, Jieli, et al. "Neurorestorative therapy for stroke." Frontiers in human neuroscience 8 (2014): 382.
3. Liu, Jialing, et al. "Vascular remodeling after ischemic stroke: mechanisms and therapeutic potentials." Progress in neurobiology 115 (2014): 138-156.
4. Tropres, Irene, et al. "Vessel size imaging." Magnetic Resonance in Medicine: An Official Journal of the International Society for Magnetic Resonance in Medicine 45.3 (2001): 397-408.
5. Jensen, J. H., and R. Chandra. "MR imaging of microvasculature." Magnetic Resonance in Medicine: An Official Journal of the International Society for Magnetic Resonance in Medicine 44.2 (2000): 224-230.
6. Seevinck, Peter R., Lisette H. Deddens, and Rick M. Dijkhuizen. "Magnetic resonance imaging of brain angiogenesis after stroke." Angiogenesis 13.2 (2010): 101-111.
Figures