0829
Supervised Learning Techniques Applied to Multi-modal Functional Neuroimaging Data Have Promise for Infarct Prediction1Radiology and Radiological Sciences, Vanderbilt University Medical Center, Nashville, TN, United States, 2Neurosurgery, Vanderbilt University Medical Center, Nashville, TN, United States, 3Pediatric Neurology, Vanderbilt University Medical Center, Nashville, TN, United States
Synopsis
Common functional imaging approaches such as cerebral blood flow-weighted arterial spin labeling and cerebrovascular reactivity-weighted blood oxygenation level-dependent MRI are susceptible to quantification errors when applied to patients with significant arterial steno-occlusive disease, due to artifacts that result from delayed blood arrival and arteriolar rigidity. Recently it was suggested that the artifacts from standard quantitation approaches can be exploited together with machine learning algorithms to localize regions of hemodynamic impairment as defined by gold standard catheter angiography. Here, we investigate whether similar algorithms can be applied to identify spatial regions that progress to infarction in a longitudinal study.
Introduction
Our goal was to evaluate novel non-invasive functional hemodynamic contrasts with machine learning for identifying brain tissue progressing to infarct in a longitudinal study of patients with intracranial arterial steno-occlusive disease. Common functional imaging approaches, including cerebral blood flow (CBF)-weighted arterial spin labeling (ASL) and cerebrovascular reactivity (CVR)-weighted blood oxygenation level-dependent (BOLD) MRI, may be inaccurate indicators of vascular health in these populations when using standard acquisition and post-processing routines due to artifacts from delayed blood arrival time (1), and vascular reactivity onset time (2). However, these apparent artifacts, which often complicate interpretation (3), may be viewed as novel contrast sources that convey information regarding pathology. We hypothesized that machine learning techniques could be applied to identify physiological patterns consistent with new infarct development.Methods
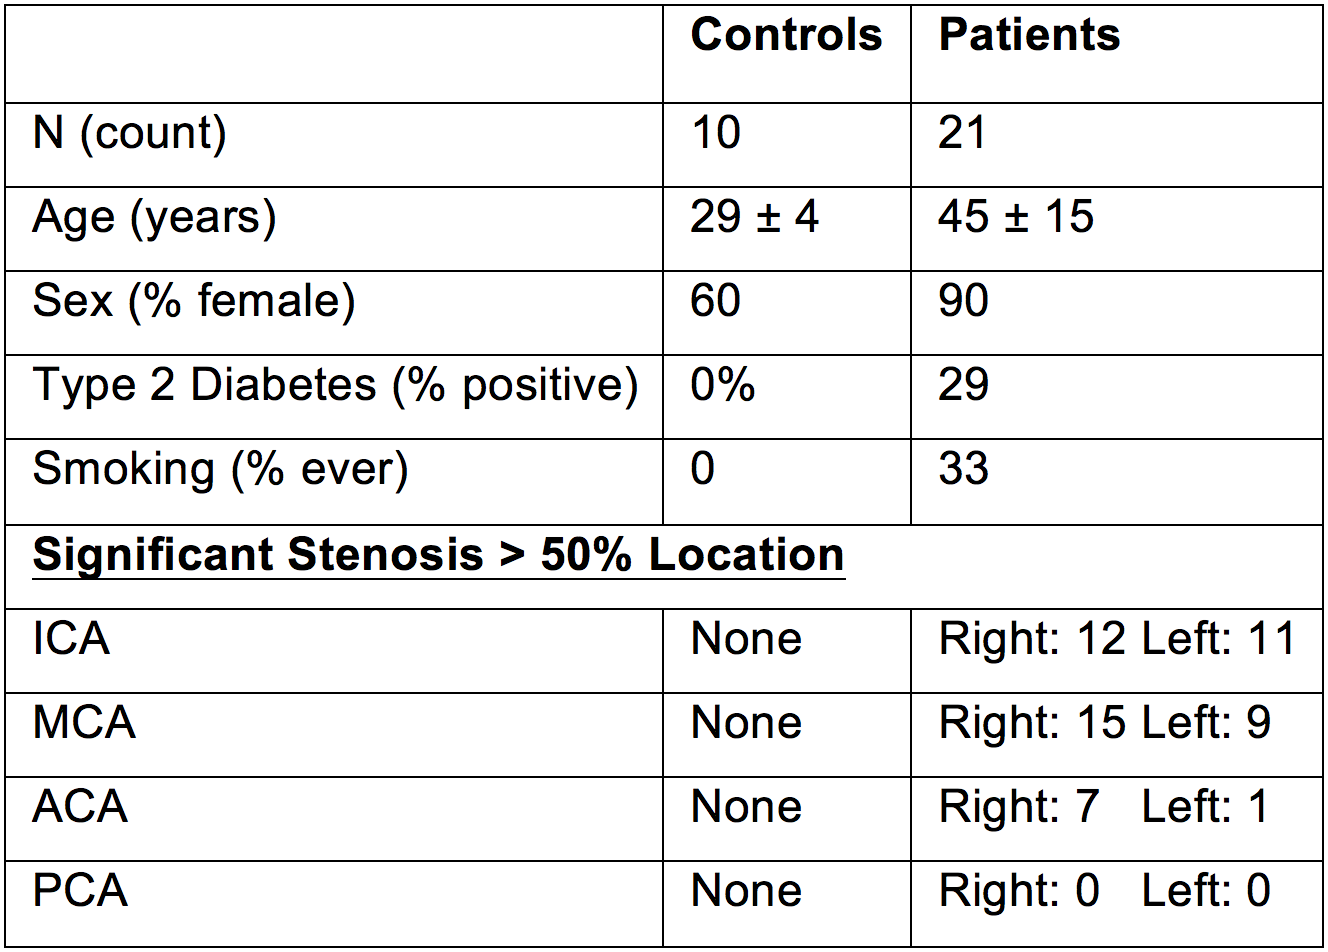
Study participants. Patients with intracranial stenosis (n=21; age=45±15 years) and healthy adults without cerebrovascular disease risk factors (n=10; age=29±4 years) provided informed, written consent, and were scanned at 3.0T (Philips), and received follow up imaging at 363±145 days. Patients with prior surgical revascularization were excluded.
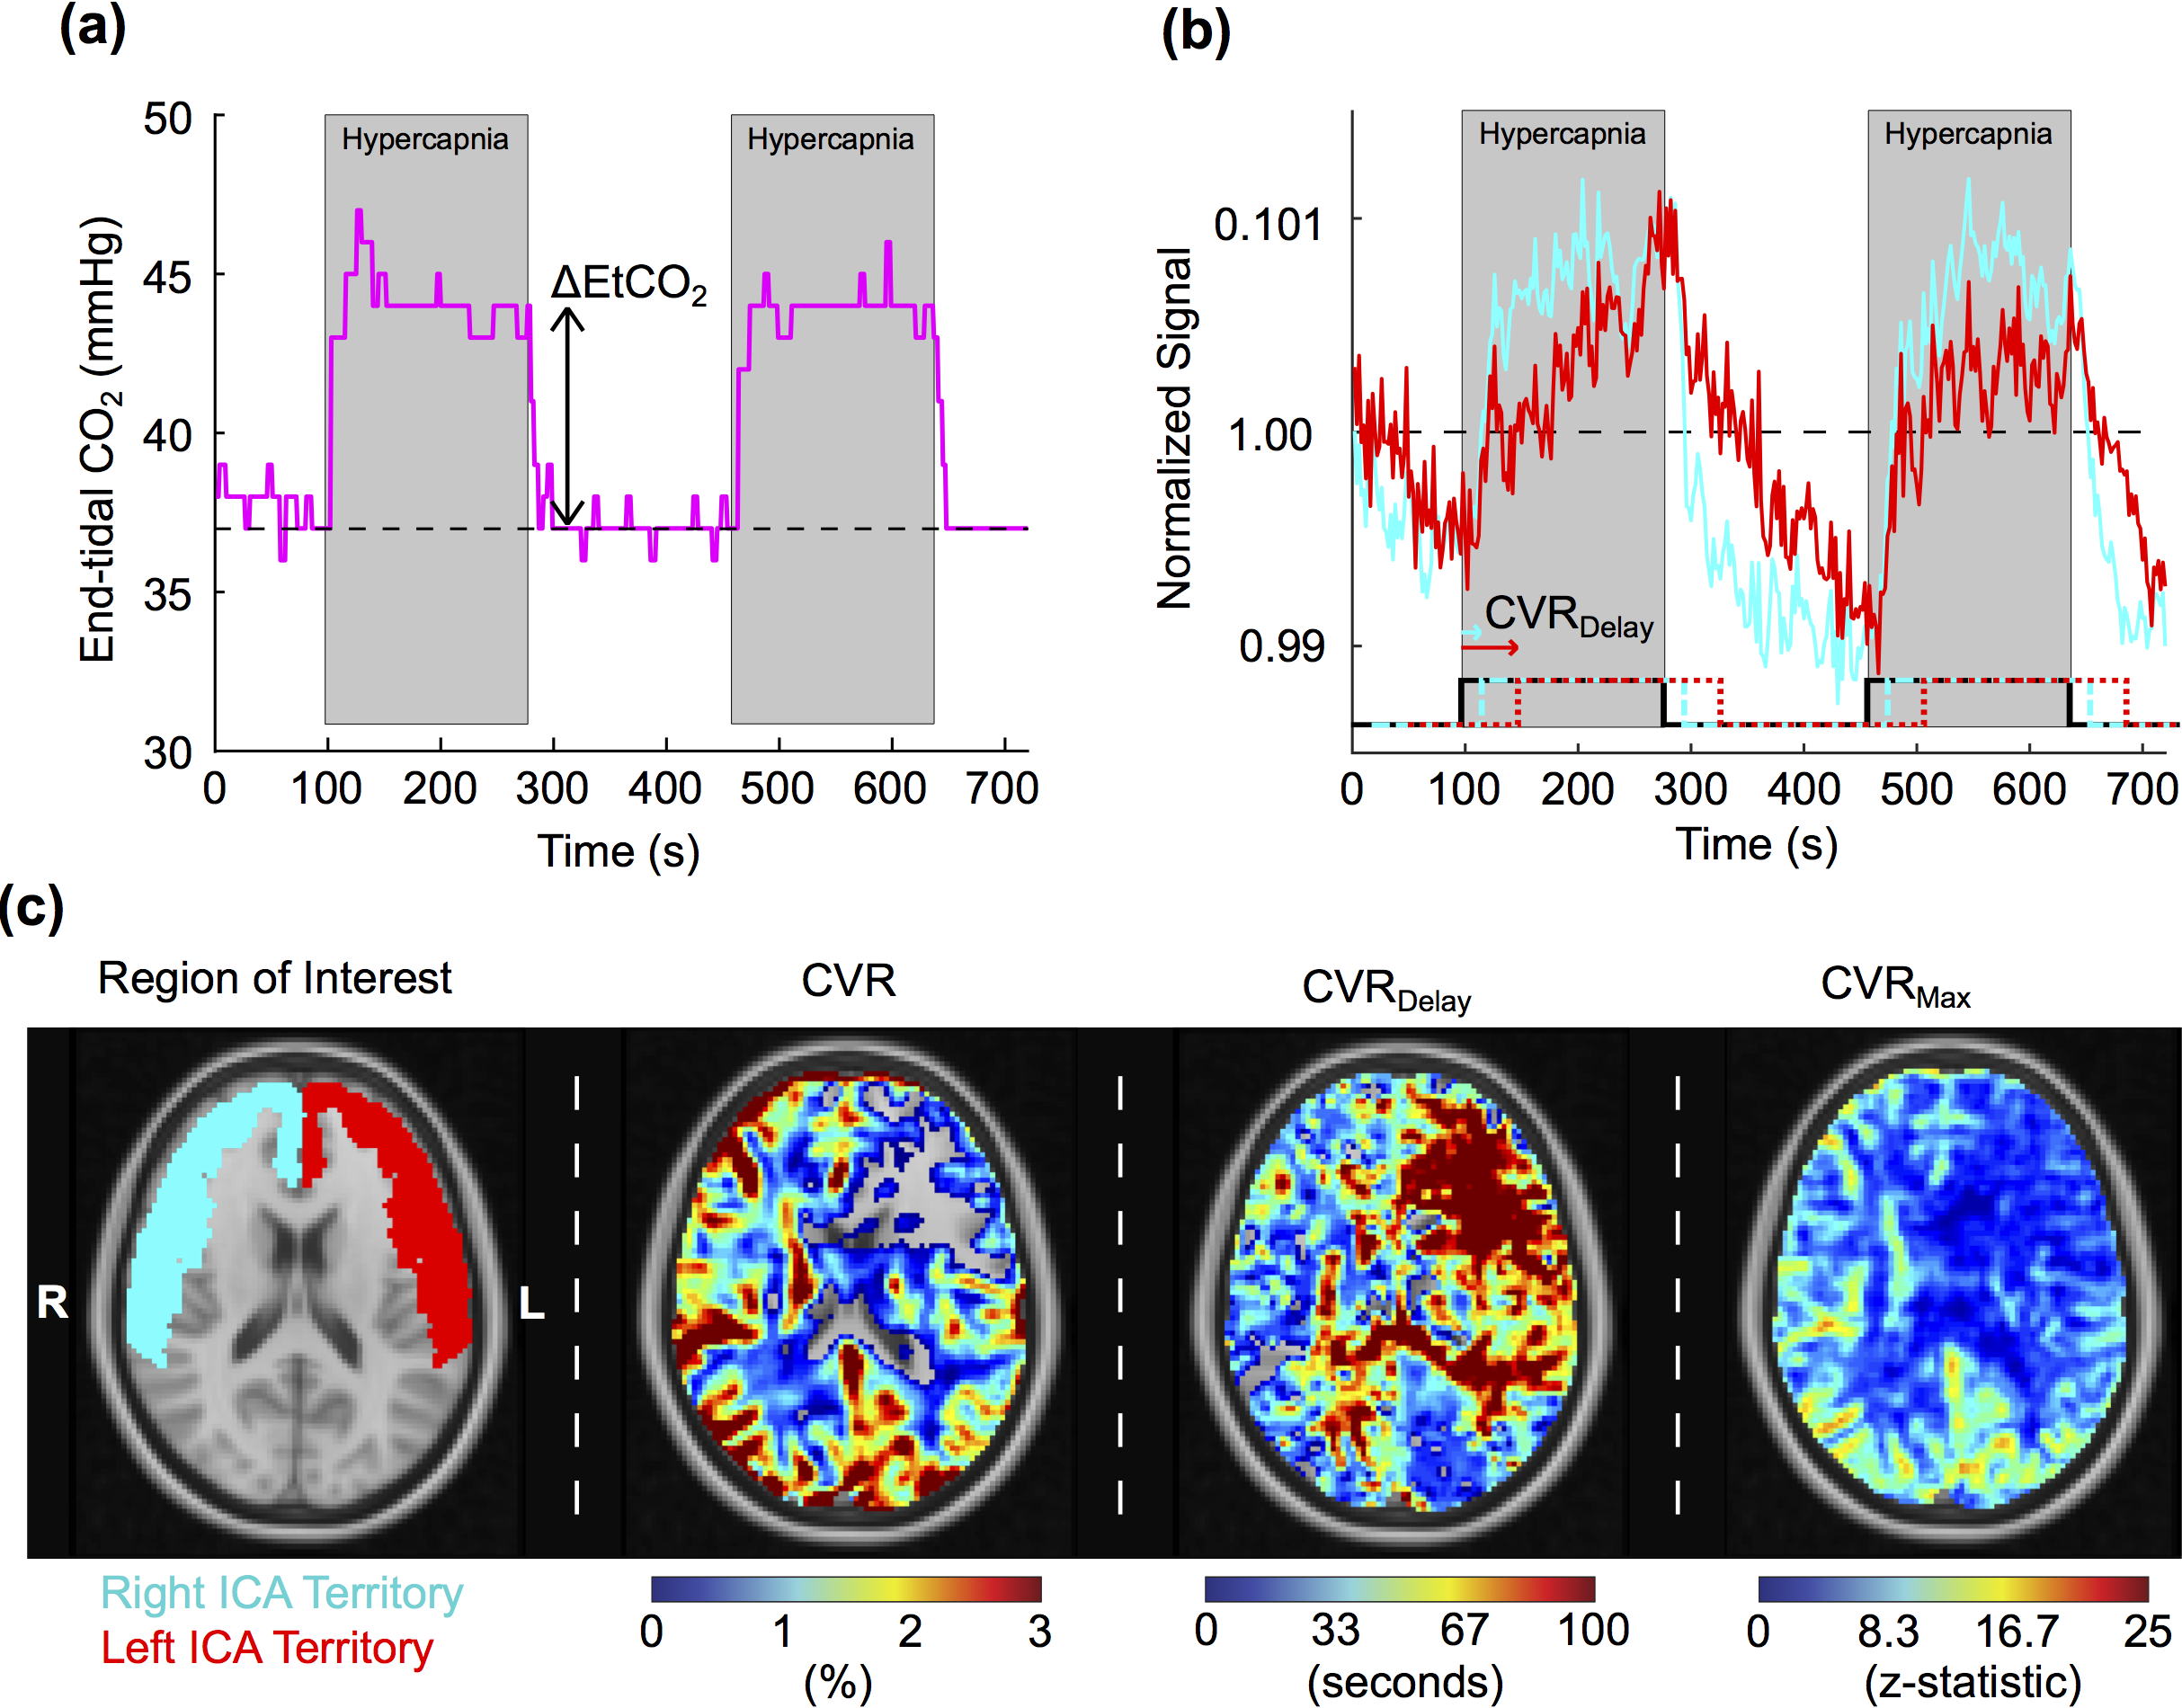
Experiment. CVR measurements were acquired with BOLD (TR/TE=2000/30 ms) imaging during mild hypercapnia (5% CO2; 180s hypercapnia interleaved with 180s normocapnia repeated once). Baseline CBF-weighted measurements were acquired with pseudo-continuous ASL (pCASL; TR/TE=4000/12.5 ms; LD=1600-1650 ms; PLD=1525-1800 ms). pCASL PLD was shorter than expected arterial circulation in cerebrovascular disease patients, promoting endovascular signal artifacts as potential markers of impairment. Standard anatomical imaging (FLAIR, T1-weighted, T2-weighted, DWI) and MR angiography were performed at both time points.
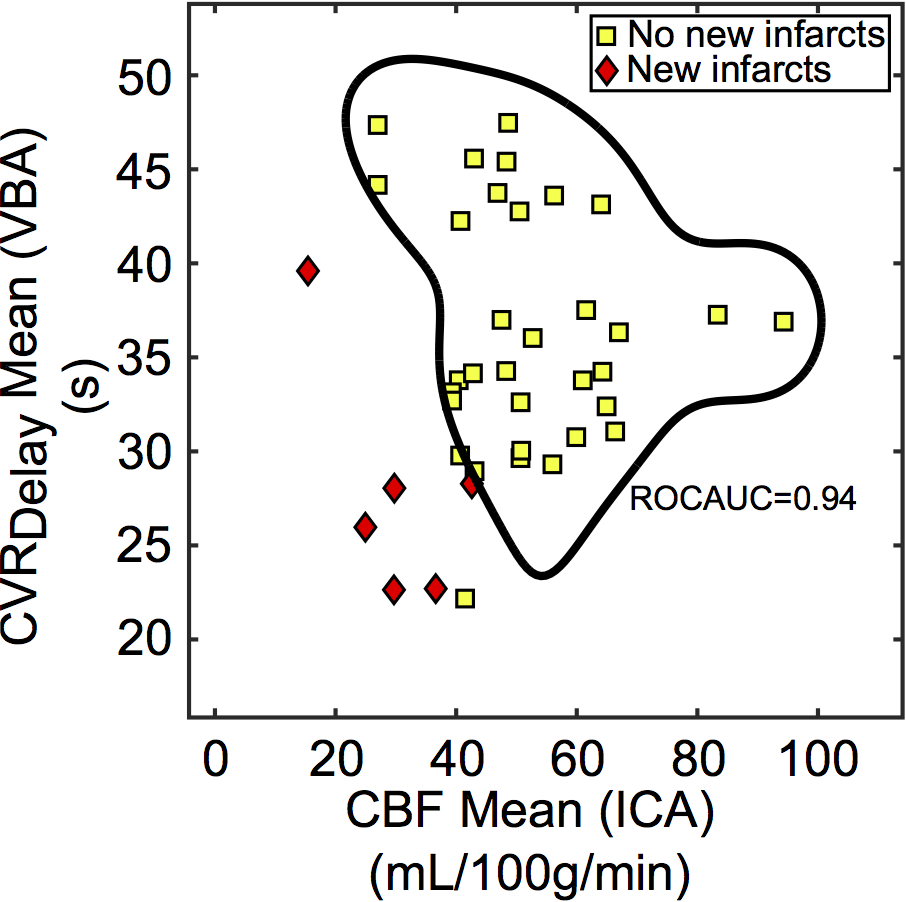
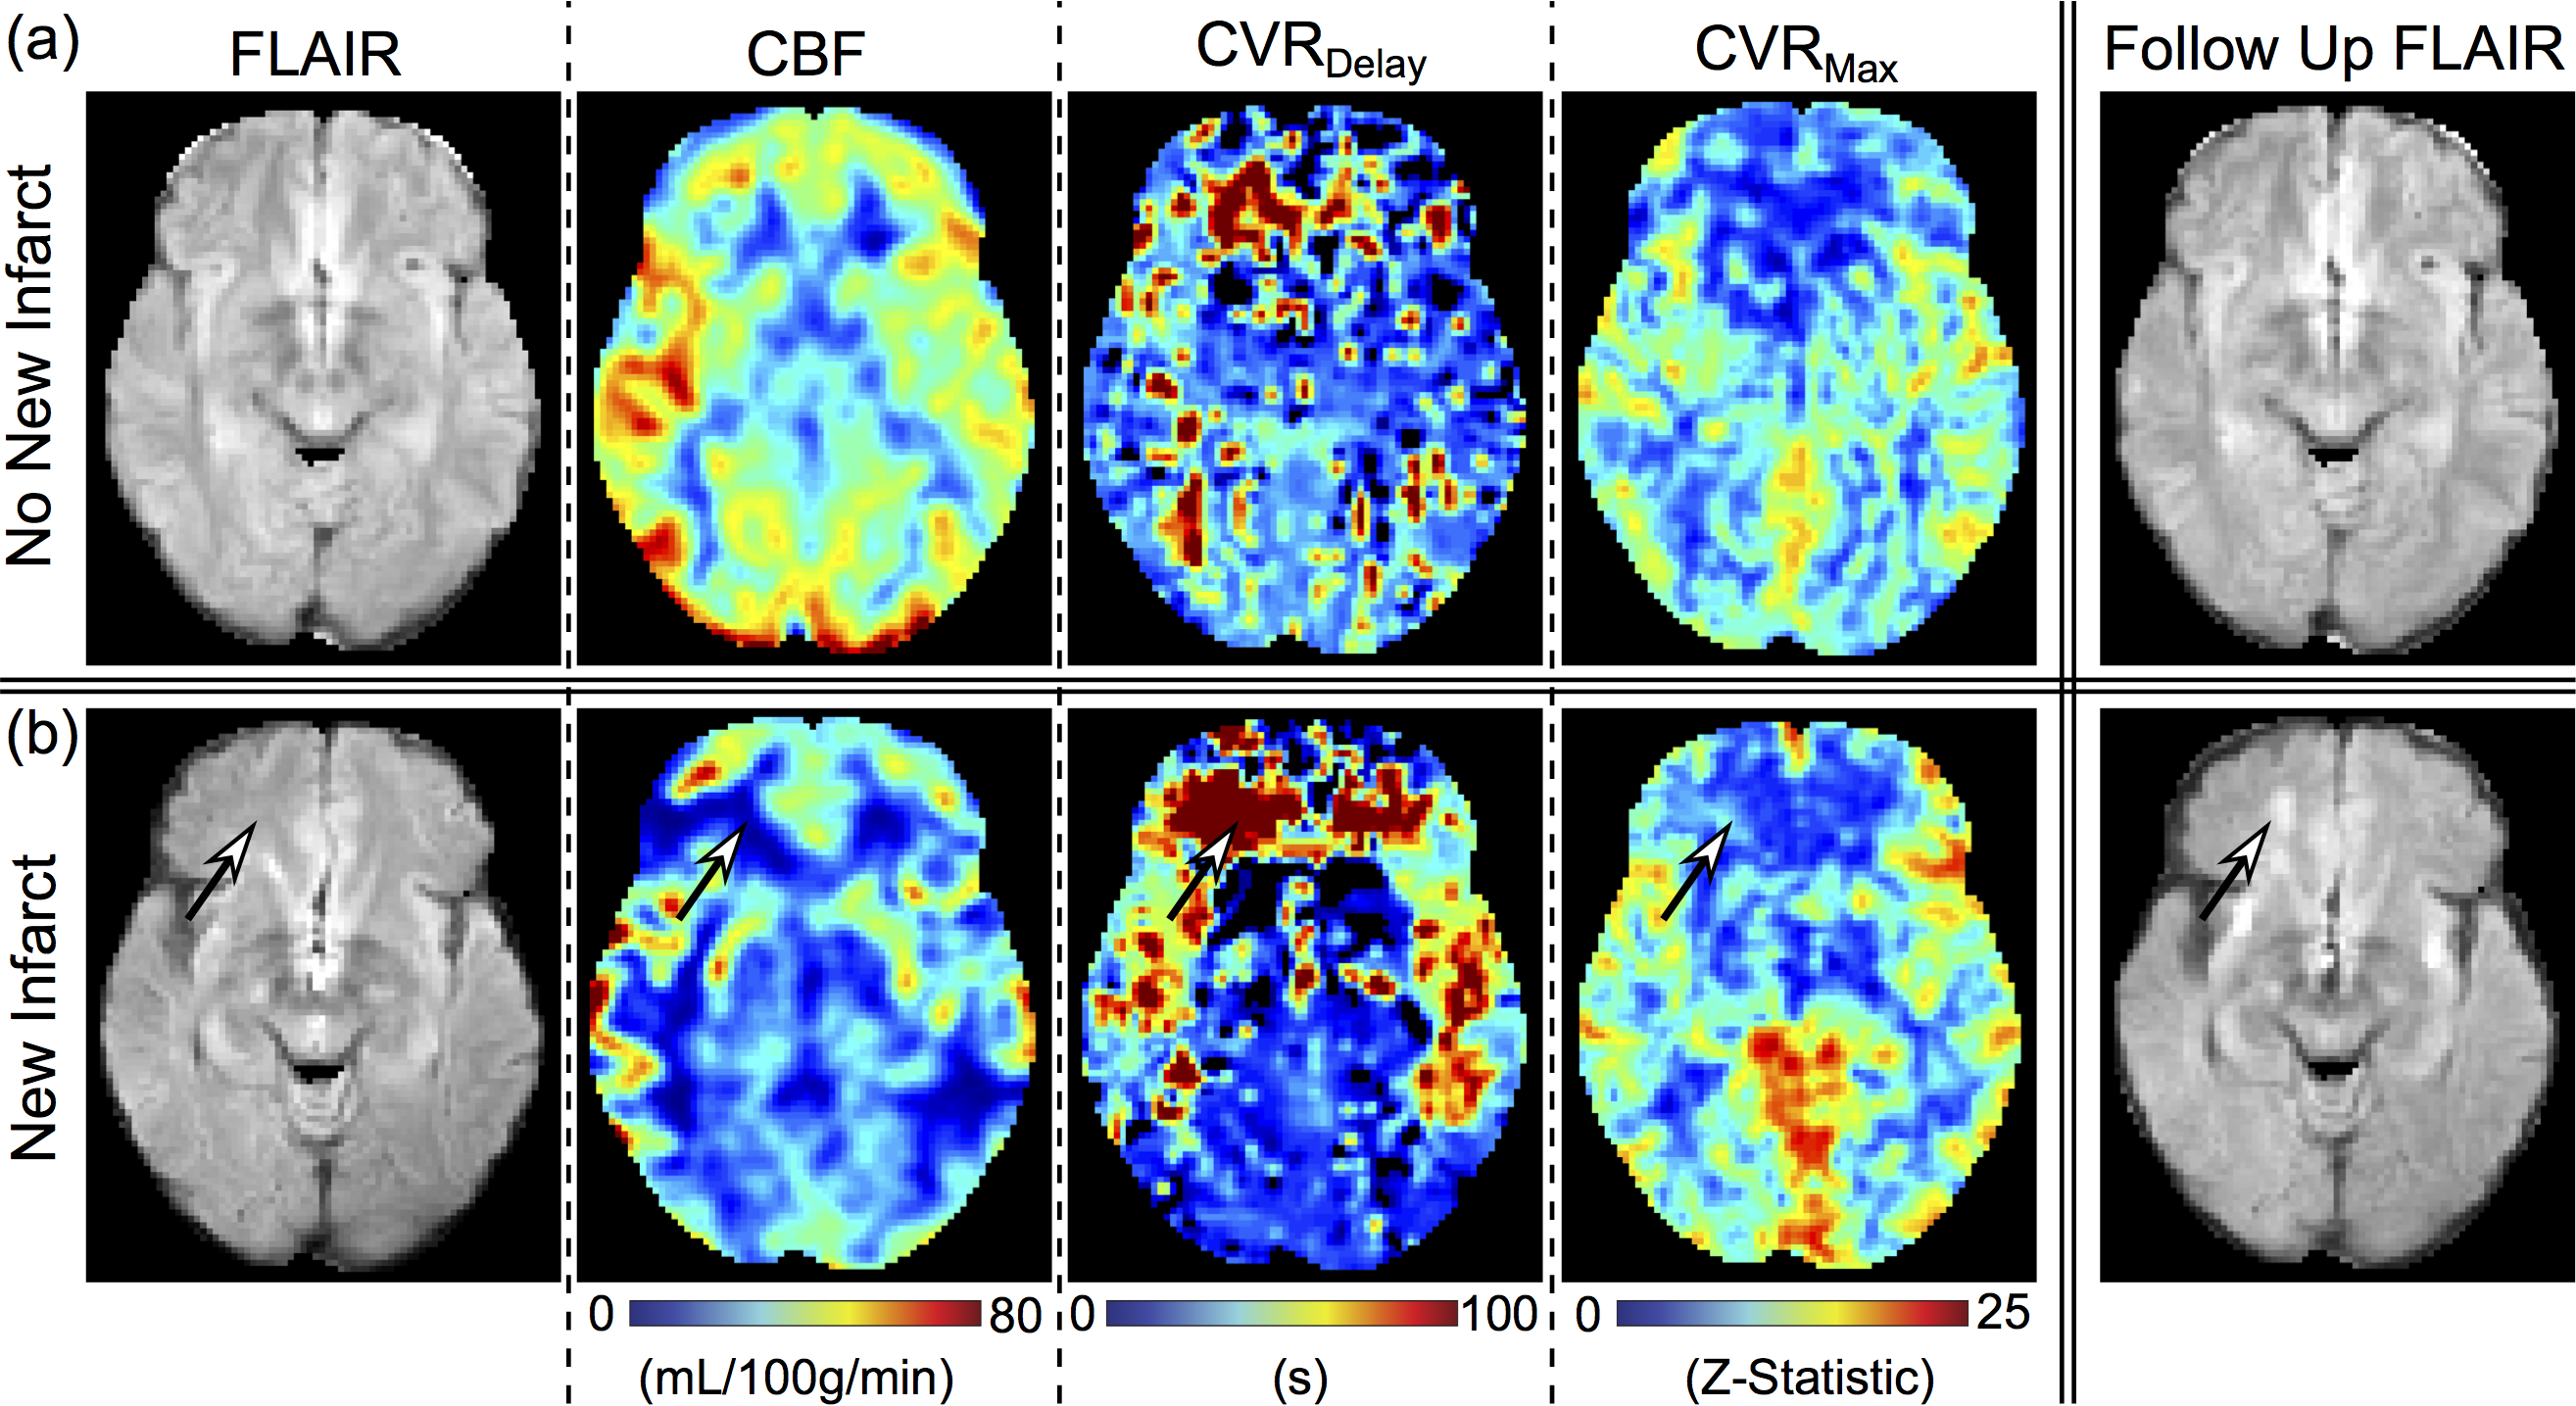
Analysis. CVR parameters were calculated from BOLD images, where CVR is percent BOLD signal change from baseline, CVRMax is maximum statistical correlation of BOLD signal with a shifted stimulus regressor, and CVRDelay is time for the shifted regressor to produce CVRMax. We quantified the parameters mean, 99th-Percentile, and standard deviation (std) of the (i) CVR, (ii) CVRDelay, (iii) CVRMax, and (iv) CBF (Figure 1). All parameters were calculated in bilateral internal carotid artery (ICA) and vertebrobasilar artery (VBA) flow territories, as well as ICA to VBA territory ratios (ICA/VBA). Infarcts were determined by a board-certified radiologist at follow-up as a lesion hyperintense on T2w FLAIR and hypointense on T1w MRI. Wilcoxon rank-sum tests (two-sided p<0.05) served to preliminarily identify variables capable of discriminating groups. A 2-Dimensional SVM with Gaussian kernel was applied with promising variables, and Receiver-Operating-Characteristic-Area-Under-the-Curve (ROCAUC) was calculated with a leave-one-out approach, and was used to determine SVM performance for distinguishing groups.
Results
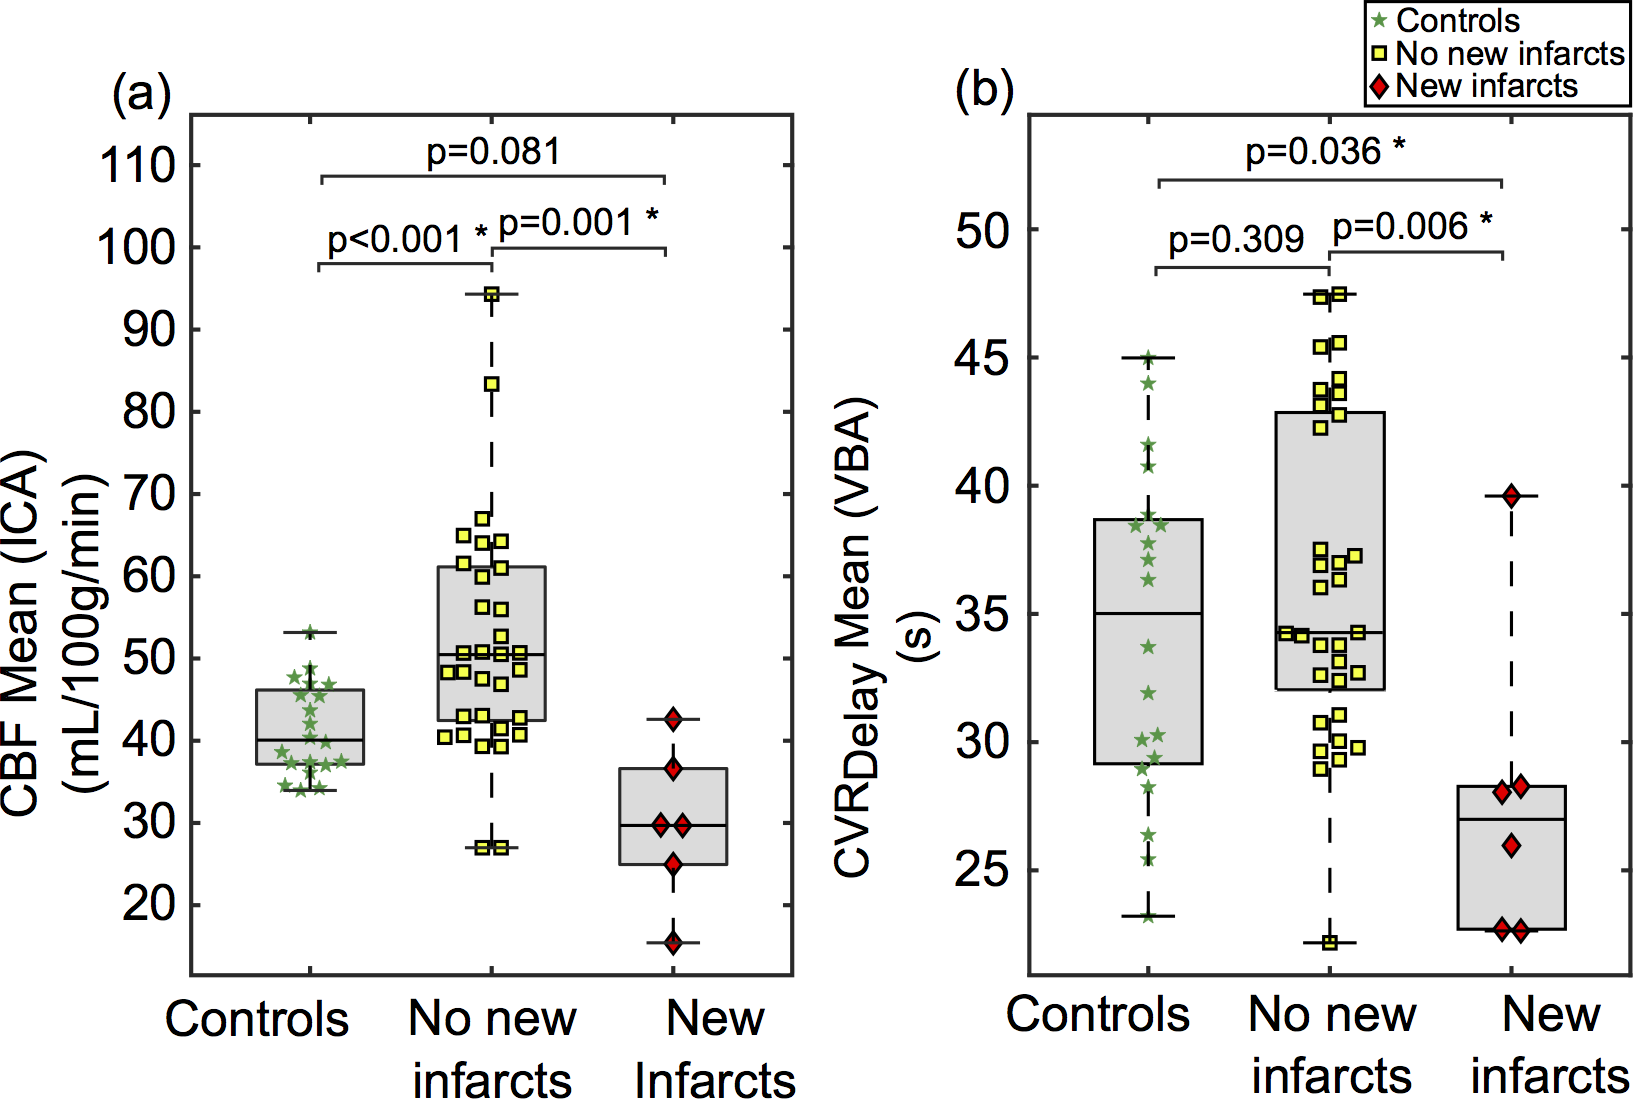
Six hemispheres showed a new infarct, whereas 19 hemispheres did not (Figure 2). 5/6 infarcts were in anterior circulation (e.g., MCA or ACA) and 1/6 in VBA flow territories. Preliminary analysis identified four significant variables for discriminating these groups: CBF Mean (region=ICA; p=0.001), CBF std (region=VBA; p=0.049), CVRDelay Mean (region=VBA; p=0.006), and CBF Mean (region=ICA/VBA; p=0.004) (Figure 3). The highest performing SVM used CBF Mean (region=ICA) and CVRDelay Mean (region=VBA), which yielded ROCAUC=0.94 (Figure 4). Figure 5 shows representative images.Discussion
Machine learning approaches commonly evaluate anatomical patterns characteristic of existing disease. This work suggests that CVR and CBF show promise for distinguishing regions progressing to infarction in patients with steno-occlusive disease. In previous work, these hemo-metabolic parameters have shown potential for identifying regions supplied by severely stenotic vessels (4), primarily hyper-intensity artifacts in endovascular signal and long CVRDelay. However, the hemodynamic patterns found in tissue fed by stenotic vessels were not identical to those indicating progression to infarction, indicating that the respective physiological mechanisms are not entirely overlapping. Here, reduced posterior CVRDelay in patients with new infarcts was unexpected, since only one hemisphere displayed a new infarct in the VBA flow territory. One possible explanation of reduced VBA CVRDelay in at-risk hemispheres is that significant stenosis in both ICAs leads to VBA supplying anterior flow territories (depending on collateral network). Associated perfusion pressure changes may direct blood through VBA flow territories more quickly, leading to a reduction in posterior CVRDelay. This study is the first to evaluate multi-modal imaging for predicting infarct development, however this work would benefit from future studies incorporating additional patients monitored over longer durations. Given the sample size here, we utilized supervised learning techniques and a 2-Dimensional SVM to limit model complexity. This work provides preliminary evidence that machine-learning techniques may be used along with quantitative functional metrics to identify disease progression, similar to other areas of radiology, such as segmentation (5,6), reconstruction(7), and identification of disease severity (8,9).
Conclusion
Using supervised machine learning, we showed that apparent signal artifacts in common hemodynamic MRI sequences may hold potential for identifying tissue at risk for infarction.Acknowledgements
No acknowledgement found.References
1. Fan AP, Guo J, Khalighi MM, et al. Long-Delay Arterial Spin Labeling Provides More Accurate Cerebral Blood Flow Measurements in Moyamoya Patients: A Simultaneous Positron Emission Tomography/MRI Study. Stroke 2017;48(9):2441-2449.
2. Donahue MJ, Strother MK, Lindsey KP, Hocke LM, Tong Y, Frederick BD. Time delay processing of hypercapnic fMRI allows quantitative parameterization of cerebrovascular reactivity and blood flow delays. J Cereb Blood Flow Metab 2016;36(10):1767-1779.
3. Hendrikse J, Petersen ET, Golay X. Vascular disorders: insights from arterial spin labeling. Neuroimaging Clin N Am 2012;22(2):259-269, x-xi.
4. Waddle SL, Lants SK, Davis LT, et al. Application of support vector machines to multi-modal hemo-metabolic data for classification of disease severity in patients with extreme arterial steno-occlusive deseases. International Society for Magnetic Resonance in Medicine 2017;Paris 2018.
5. Zhang W, Li R, Deng H, et al. Deep convolutional neural networks for multi-modality isointense infant brain image segmentation. Neuroimage 2015;108:214-224.
6. Pereira S, Pinto A, Alves V, Silva CA. Brain Tumor Segmentation Using Convolutional Neural Networks in MRI Images. IEEE Trans Med Imaging 2016;35(5):1240-1251.
7. Yoon J, Gong E, Chatnuntawech I, et al. Quantitative susceptibility mapping using deep neural network: QSMnet. Neuroimage 2018;179:199-206.
8. Ferreira LK, Rondina JM, Kubo R, et al. Support vector machine-based classification of neuroimages in Alzheimer's disease: direct comparison of FDG-PET, rCBF-SPECT and MRI data acquired from the same individuals. Rev Bras Psiquiatr 2017:0. 9. Collij LE, Heeman F, Kuijer JP, et al. Application of Machine Learning to Arterial Spin Labeling in Mild Cognitive Impairment and Alzheimer Disease. Radiology 2016;281(3):865-875.
Figures