0828
Reperfusion into Severely Damaged Brain Tissue is Associated with Impending Parenchymal Hemorrhage in Recanalized Acute Ischemic Stroke Patients1Stevens Institute of Neuroimaging and Informatics, University of Southern California, Los Angeles, CA, United States, 2Neurology, UCLA, Los Angeles, CA, United States, 3Neurosurgery, Beijing Tiantan Hospital, Beijing, China, 4Radiology, UCLA, Los Angeles, CA, United States, 5Radiology, Chinese PLA General Hospital, Beijing, China
Synopsis
While timely reperfusion can reduce more extensive brain tissue injury by salvaging reversibly damaged penumbra, late recanalization also carries the risk of causing additional and substantial brain damage, such as ischemia-reperfusion injury, compared with no revascularization. The reperfusion status after thrombolysis within the DWI lesion territory and its relationship with HT is unclear, leaving the details regarding post-treatment care unspecified. In this study, we aim to quantify the volume of reperfusion into severely damaged brain tissue and investigate its predictive value for impending parenchymal hematoma following recanalization.
Introduction
Intravenous infusion of tissue plasminogen activator (tPA) and endovascular clot retrieval are the main therapies for acute ischemic stroke with proven clinical benefit1, 2. While timely reperfusion can reduce more extensive brain tissue injury by salvaging reversibly damaged penumbra, late recanalization also carries the risk of causing additional and substantial brain damage, such as ischemia-reperfusion injury, compared with no revascularization3. Diffusion weighted imaging (DWI) is typically considered the gold standard for identifying infarct core, where tissues are severely damaged and more vulnerable to reperfusion injury. The reperfusion status after thrombolysis within the DWI lesion territory and its relationship with HT is unclear, leaving the details regarding post-treatment care unspecified. In this study, we aim to quantify the volume of reperfusion into severely damaged brain tissue and investigate its predictive value for impending parenchymal hematoma following recanalization.Methods
This study was performed on data collected from an ongoing prospective registry of patients evaluated with diffusion-perfusion MRI at our academic medical center. All patients underwent routine clinical stroke MRI on Siemens 1.5T Avanto or 3.0T TIM Trio systems using 12-channel head coils within 24 hours post-treatment. A pseudo-continuous arterial spin labeling (pCASL) sequence with background suppressed 3D GRASE readout was also applied at this time with the following parameters: TR/TE/label time/post-labeling delay=4000/22/1500/2000ms; field of view=22cm; matrix size=64×64, 26×5mm slices; GRAPPA factor=2, 4/8 partial k-space, 30 pairs of label and control images with a scan time of 4min. Following motion correction and pairwise subtraction between label and control images, quantitative CBF maps were calculated from the pCASL images using our in-house Matlab scripts4.
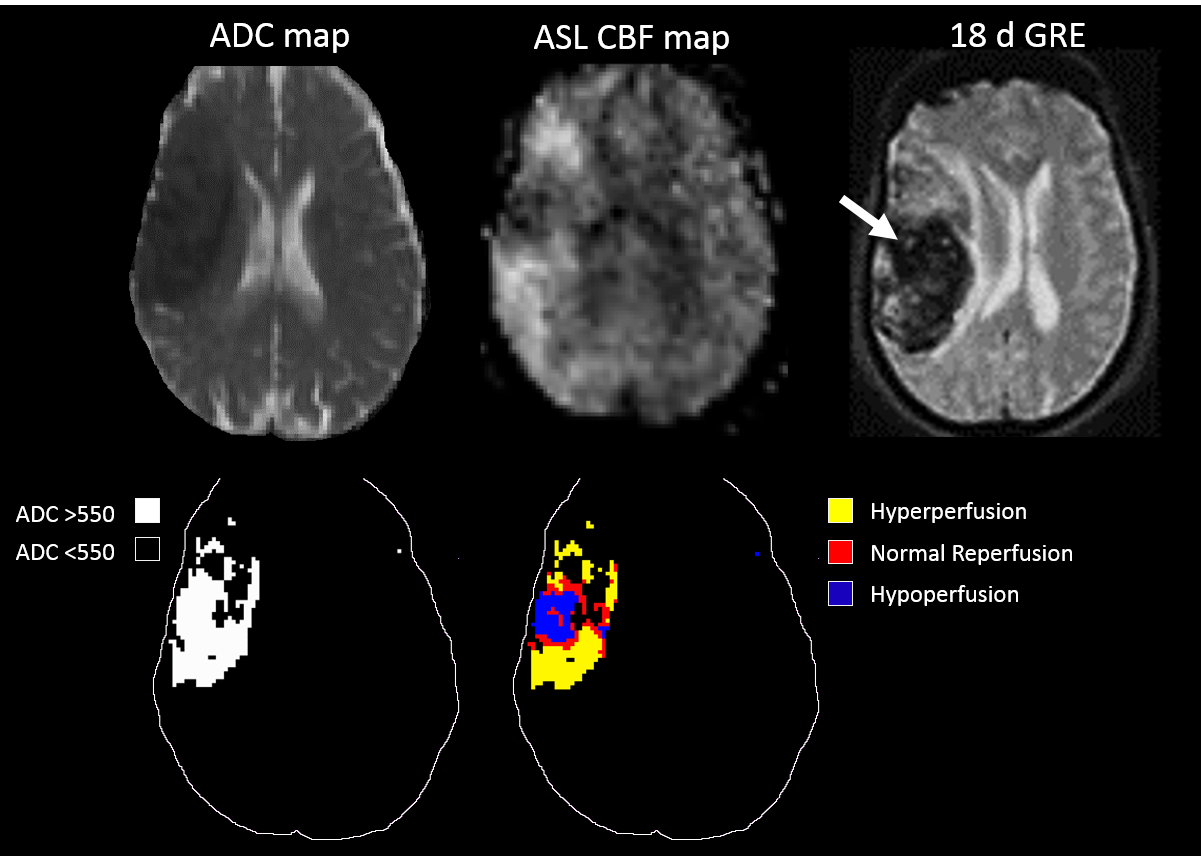
Apparent diffusion coefficient (ADC) values 200-1200x10-6mm2/s were selected to distinguish from non-cerebral tissues. The infarct core was identified using ADC values <550x10-6mm2/s 5 and used as a lesion region of interest (ROI) for sampling in the CBF map along with its contralateral counterpart. CBF at the 25th, median, and 75th percentiles of the contralateral ROI were used as thresholds to define reperfusion status in the lesion side, where hypoperfusion was CBF<25th percentile threshold and hyperperfusion was CBF>75th percentile threshold6. ASL reperfusion volume above each threshold was recorded and noted as vol-25, vol-50, and vol-75, respectively. Hemorrhagic transformation (HT) grade is defined as in Table 1. Paired-samples t-tests were used to investigate if there was a significant difference between CBF values in the DWI lesion territory and its non-lesion counterpart or reperfusion volume distributions with or without complete recanalization. The area under the receiver operating characteristic curve (AUC) was used to assess the performance of prognostic risk scores. Univariate logistic regression analysis was performed to evaluate the predictive value of the imaging and clinical variables for PH vs. no PH and PH2 vs. no PH2.
Results
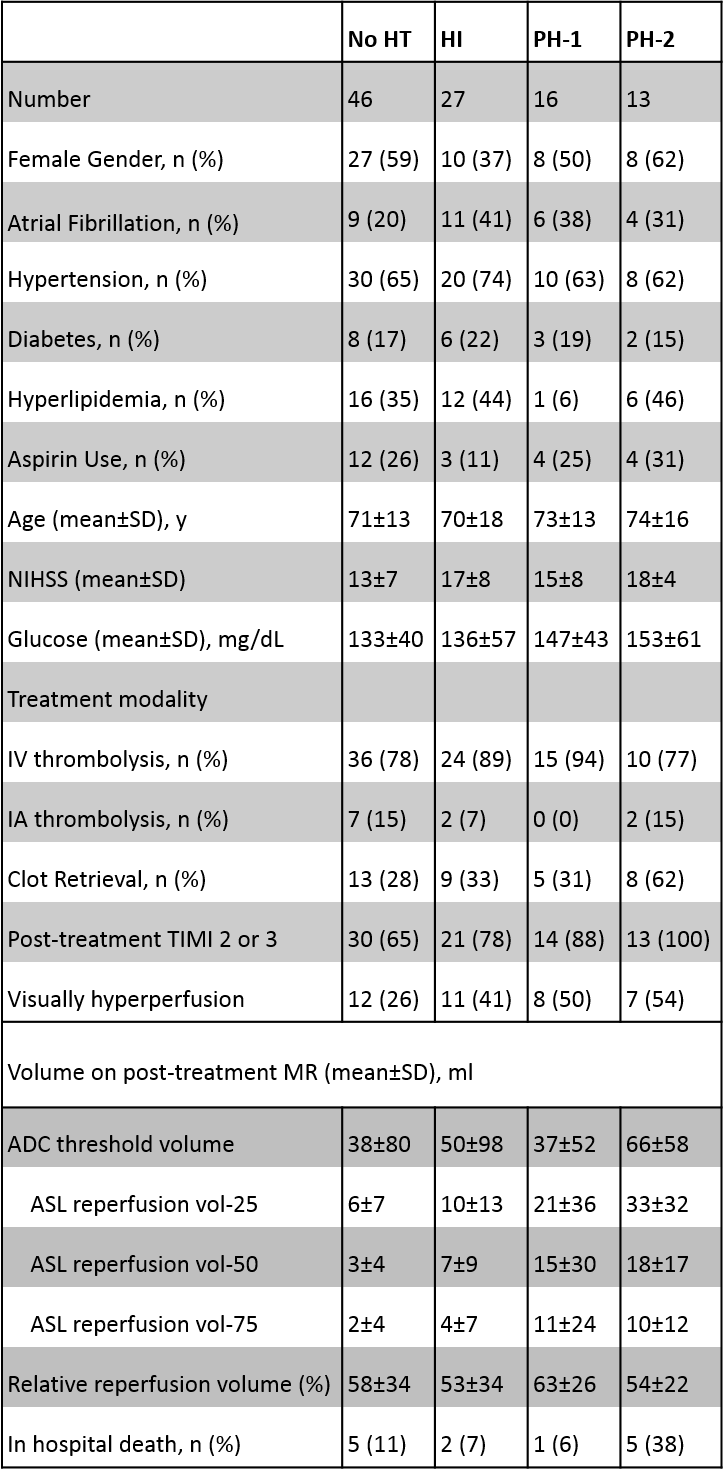
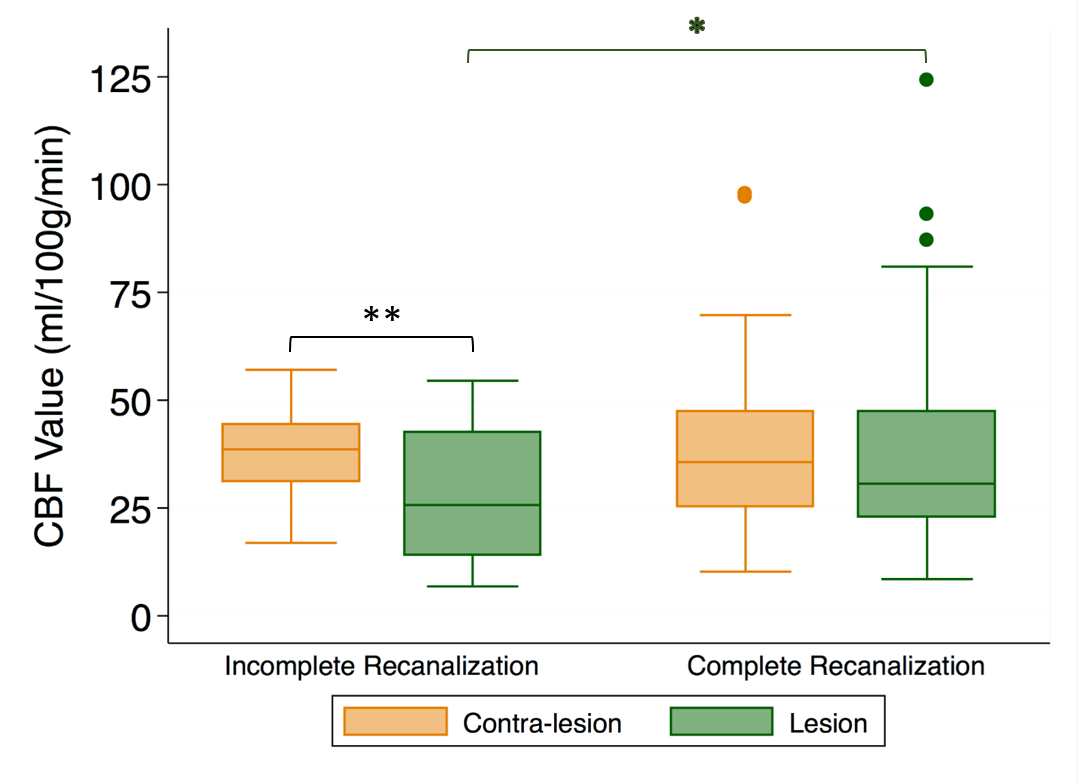
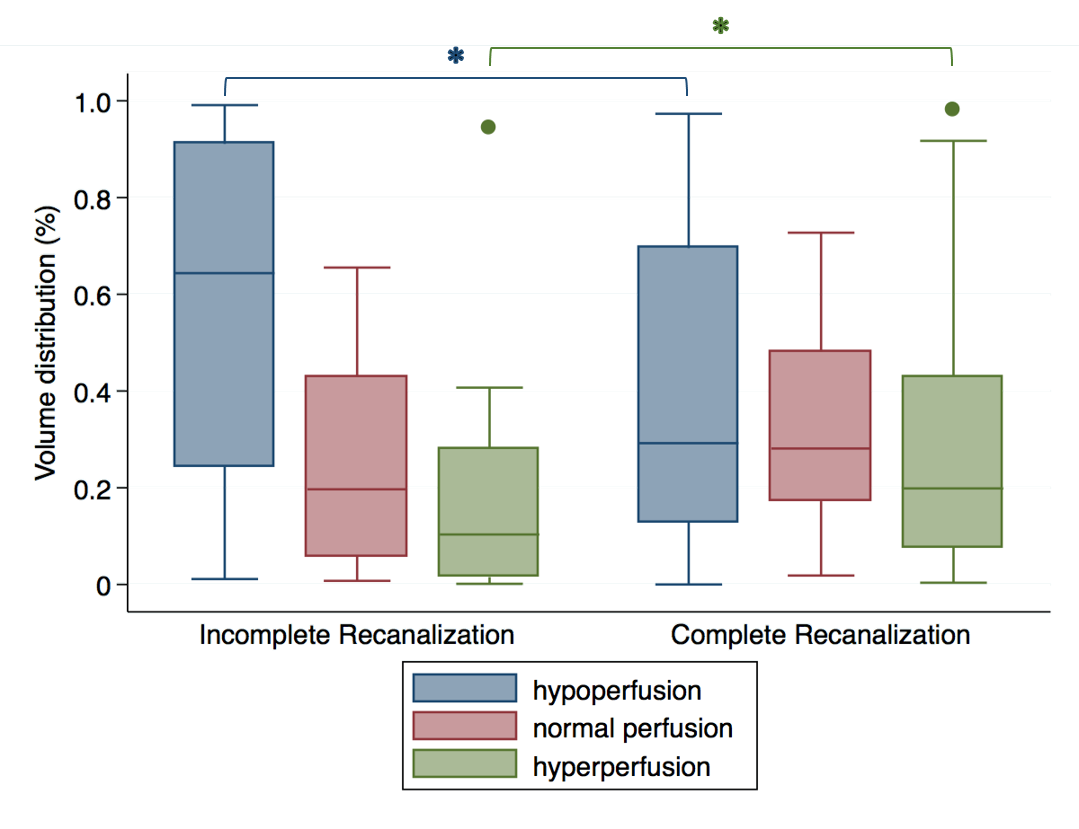
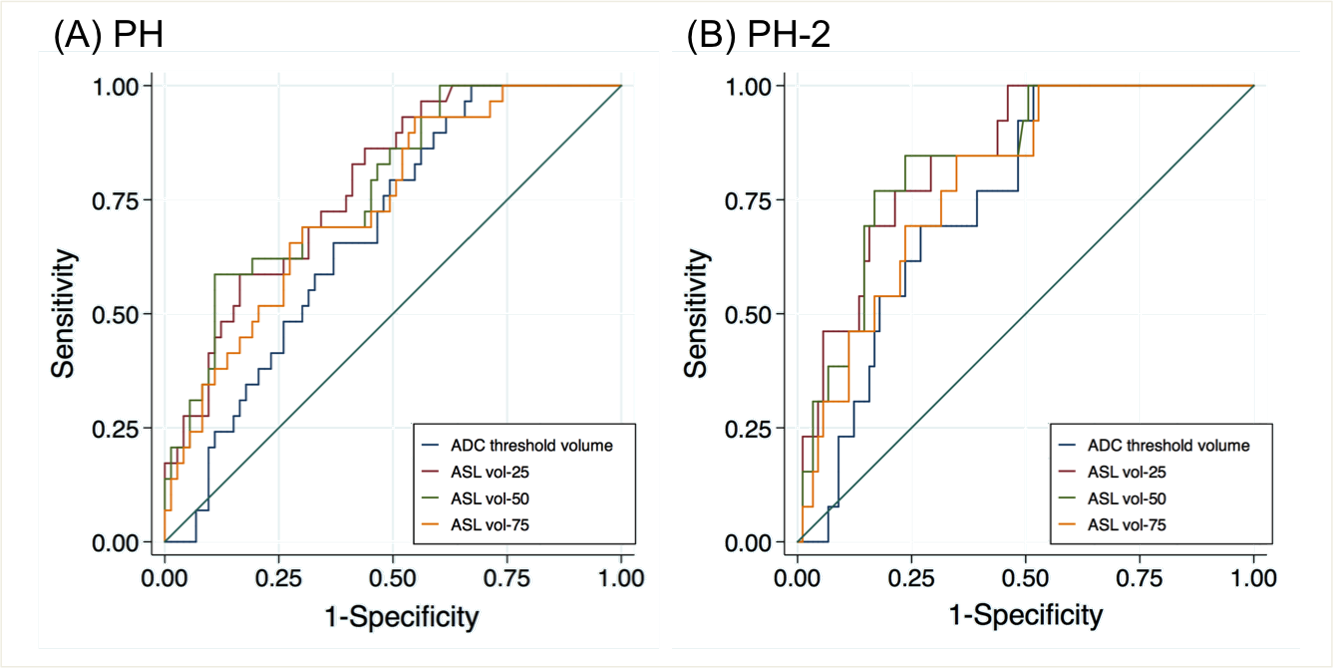
A total of 102 patients (49 males, 71.3±14.5 years) were included in this study. The median time from treatment to ASL/DWI imaging was 6.7 (IQR=4.8-18.3) hours. Patient demographics are described in Table 1. In Figure 1, mean CBF within the DWI lesion territory is higher in patients with complete recanalization than in those with incomplete recanalization (p= 0.048).The median (interquartile range) CBF value used as thresholds at 25th, 50th and 75th percentile in the contra-lesional area were 25.7 (19.0-35.9), 35.6 (24.9-45.3), and 45.1 (32.7-54.5) ml/100g/min, respectively. In severely damaged brain tissue, the percentage of volume distribution of different reperfusion status differed significantly in patients with complete vs. incomplete recanalization for hypoperfusion (P=0.02) and hyperperfusion (P=0.02) (Figure 2). ASL reperfusion vol-25 had significantly higher AUC when compared with ADC thresholded volume in the prediction of PH (0.782 vs. 0.679, P=0.002) and PH-2 (0.844 vs. 0.749, P=0.0027) (Figure 3). The best cutoff value for ASL reperfusion vol-25 is 4.2ml for predicting PH and 11.9ml for predicting PH-2. In univariate logistic regression analysis, only ASL reperfusion vol-25 emerged as a significant factor of PH (p<0.001) and PH-2 (p=0.001) after Bonferroni correction of multiple comparisons (p<0.003). Figure 4 shows one representative case in which, despite complete recanalization, inhomogenous reperfusion eventually resulted in PH-2.Discussion & Conclusion
Reperfusion into severely damaged brain tissue, at least as high as 25% of its contralateral side, best discriminates PH vs. non-PH and PH-2 vs. non-PH-2. The risk of PH is highly associated with the volume of reperfusion into severely damaged brain tissue, and larger reperfusion volumes within the infarct may indicate impending higher grade of HT. Patients with ASL vol-25 larger than 12ml seem more likely to experience PH-2, and therefore need to be monitored closely with careful blood pressure control. Multimodal MRI (diffusion and perfusion) can serve as useful predictors of undesirable complications after a recanalization procedure.Acknowledgements
This study was supported by the US National Institute of Health (NIH) grant UH2-NS100614 and R01-EB014922, and National Natural Science Foundation of China (Grant No. 81701140).References
1. National institute of neurological disorders and stroke rt-pa stroke study group. Tissue plasminogen activator for acute ischemic stroke. N Engl J Med. 1995;333:1581-1587
2. Hacke W, Kaste M, Bluhmki E, Brozman M, Davalos A, Guidetti D, et al. Thrombolysis with alteplase 3 to 4.5 hours after acute ischemic stroke. N Engl J Med. 2008;359:1317-1329
3. Lees KR, Bluhmki E, von Kummer R, Brott TG, Toni D, Grotta JC, et al. Time to treatment with intravenous alteplase and outcome in stroke: An updated pooled analysis of ecass, atlantis, ninds, and epithet trials. Lancet. 2010;375:1695-1703
4. Wang DJ, Alger JR, Qiao JX, Hao Q, Hou S, Fiaz R, et al. The value of arterial spin-labeled perfusion imaging in acute ischemic stroke: Comparison with dynamic susceptibility contrast-enhanced mri. Stroke. 2012;43:1018-1024
5. Tong DC, Adami A, Moseley ME, Marks MP. Relationship between apparent diffusion coefficient and subsequent hemorrhagic transformation following acute ischemic stroke. Stroke. 2000;31:2378-2384
6. Yu S, Ma SJ, Liebeskind DS, Yu D, Li N, Qiao XJ, et al. Aspects-based reperfusion status on arterial spin labeling is associated with clinical outcome in acute ischemic stroke patients. J Cereb Blood Flow Metab. 2018;38:382-392
Figures