0827
Radiomic analysis on symptomatic and asymptomatic intracranial atherosclerotic plaque using high resolution MRI1Radiology, Changhai Hospital, Shanghai, China, 2Department of Radiology and Biomedical Imaging, University of California San Francisco, San Francisco, CA, United States, 3Radiology, Changhai Hosptial, Shanghai, China
Synopsis
This study aims to evaluate a quantitative radiomic approach including texture analysis based on HR-MRI to differentiate acute symptomatic plaque from asymptomatic plaque. 158 patients with middle cerebral artery and basilar artery stenosis underwent HR-MRI. The stenosis value, plaque area/burden, lumen area, intraplaque hemorrhage (IPH), contrast enhancement ratio and 109 quantitative radiomic features were extracted. Multivariate logistic analysis and a random forest model were performed. The result was shown that smoking, IPH and enhancement ratio were independently associated with symptomatic plaques. Radiomic features in T2, T1 and CE-T1 images were associated with symptomatic plaques, whose AUC respectively are 0.801,0.835 and 0.846. The combined all radiomic approach had a significantly higher AUC of 0.953. Combination of all features reached an AUC of 0.976, with accuracy of 87.4%. Radiomic analysis accurately distinguished between acutely symptomatic plaques and asymptomatic plaques.
Purpose
Intracranial atherosclerotic disease (ICAD) is a major cause of ischemic cerebrovascular events worldwide. High-resolution magnetic resonance imaging (HR-MRI) has been used to characterize intracranial plaque. This study aims to evaluate a quantitative radiomic approach based on HR-MRI to differentiate symptomatic intracranial artery plaque from asymptomatic plaque.Methods
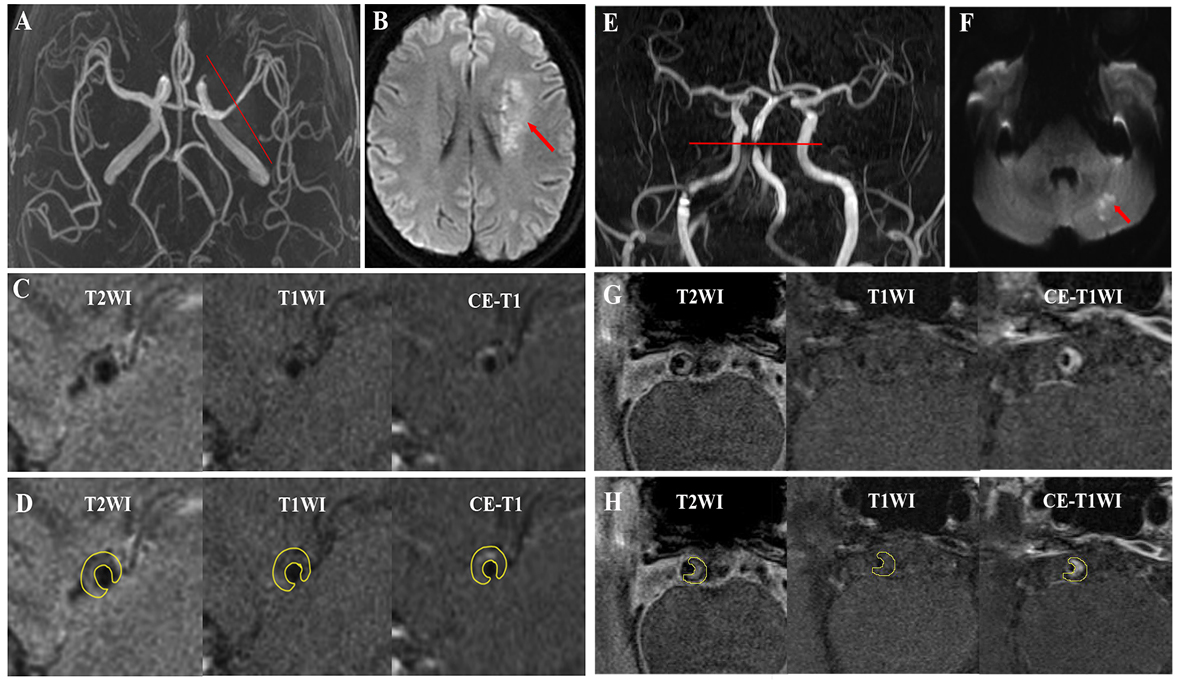
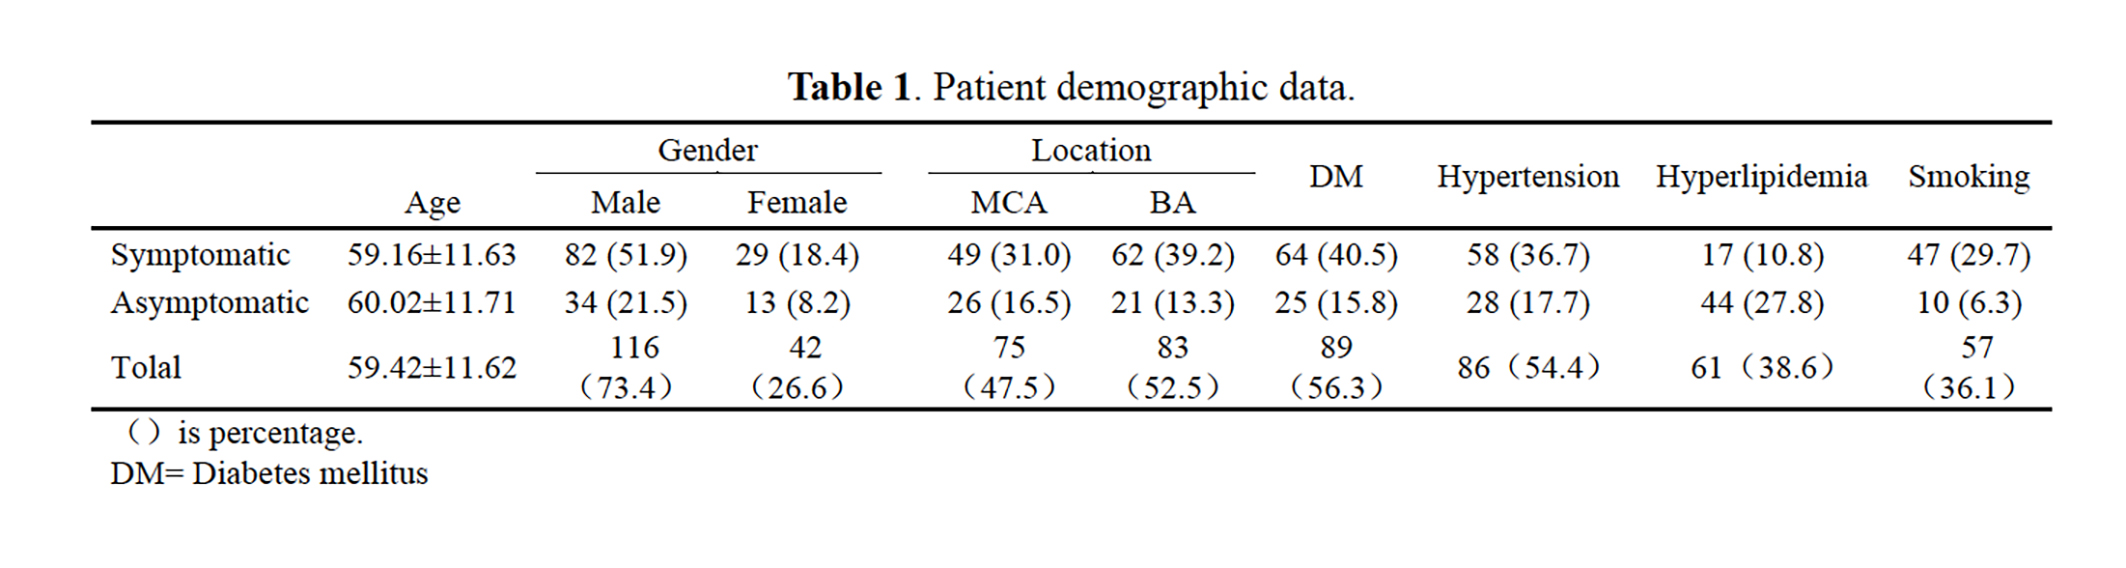
Study population:This study retrospectively analyzed 158 patients with middle cerebral artery (MCA) and basilar artery (BA) stenosis underwent HR-MRI between September 2013 and October 2016. Patients were scanned with T1 and T2 weighted imaging, and T1 imaging following Gd contrast injection (CE-T1). Imaging analysis: Atherosclerosis plaques from MCA and BA were extracted as the region of interest (ROI) for quantitative evaluation. The stenosis value, plaque area/burden, lumen area, intraplaque hemorrhage (IPH), contrast enhancement ratio and 109 quantitative radiomic features were extracted and compared between symptomatic and asymptomatic patients. Radiomic features including intensity, shape based feature and textures were analyzed. Textures includes gray level cooccurence matrix (GLCM), gray level run length matrix (GLRLM) and gray level size zone matrix (GLSZM). 1
Statistical analysis: Normality test was performed for each variable. Univariate analysis was applied first to find possible variable that was associated with symptoms. Student t-test or two-sample Wilcoxon test was used if the variable was/was not normally distributed. P-values <0.05 were considered as statistical significant. To further quantify the texture features, supervised machine-learning methods were applied to classify symptomatic and asymptomatic plaques. Features in each sequence were selected during statistical analysis, those were set as input for the random forest training features. The classification performance of the features of each imaging sequence was compared. Multi-variate logistic analysis and a random forest model were used to evaluate the diagnostic performance.
Results
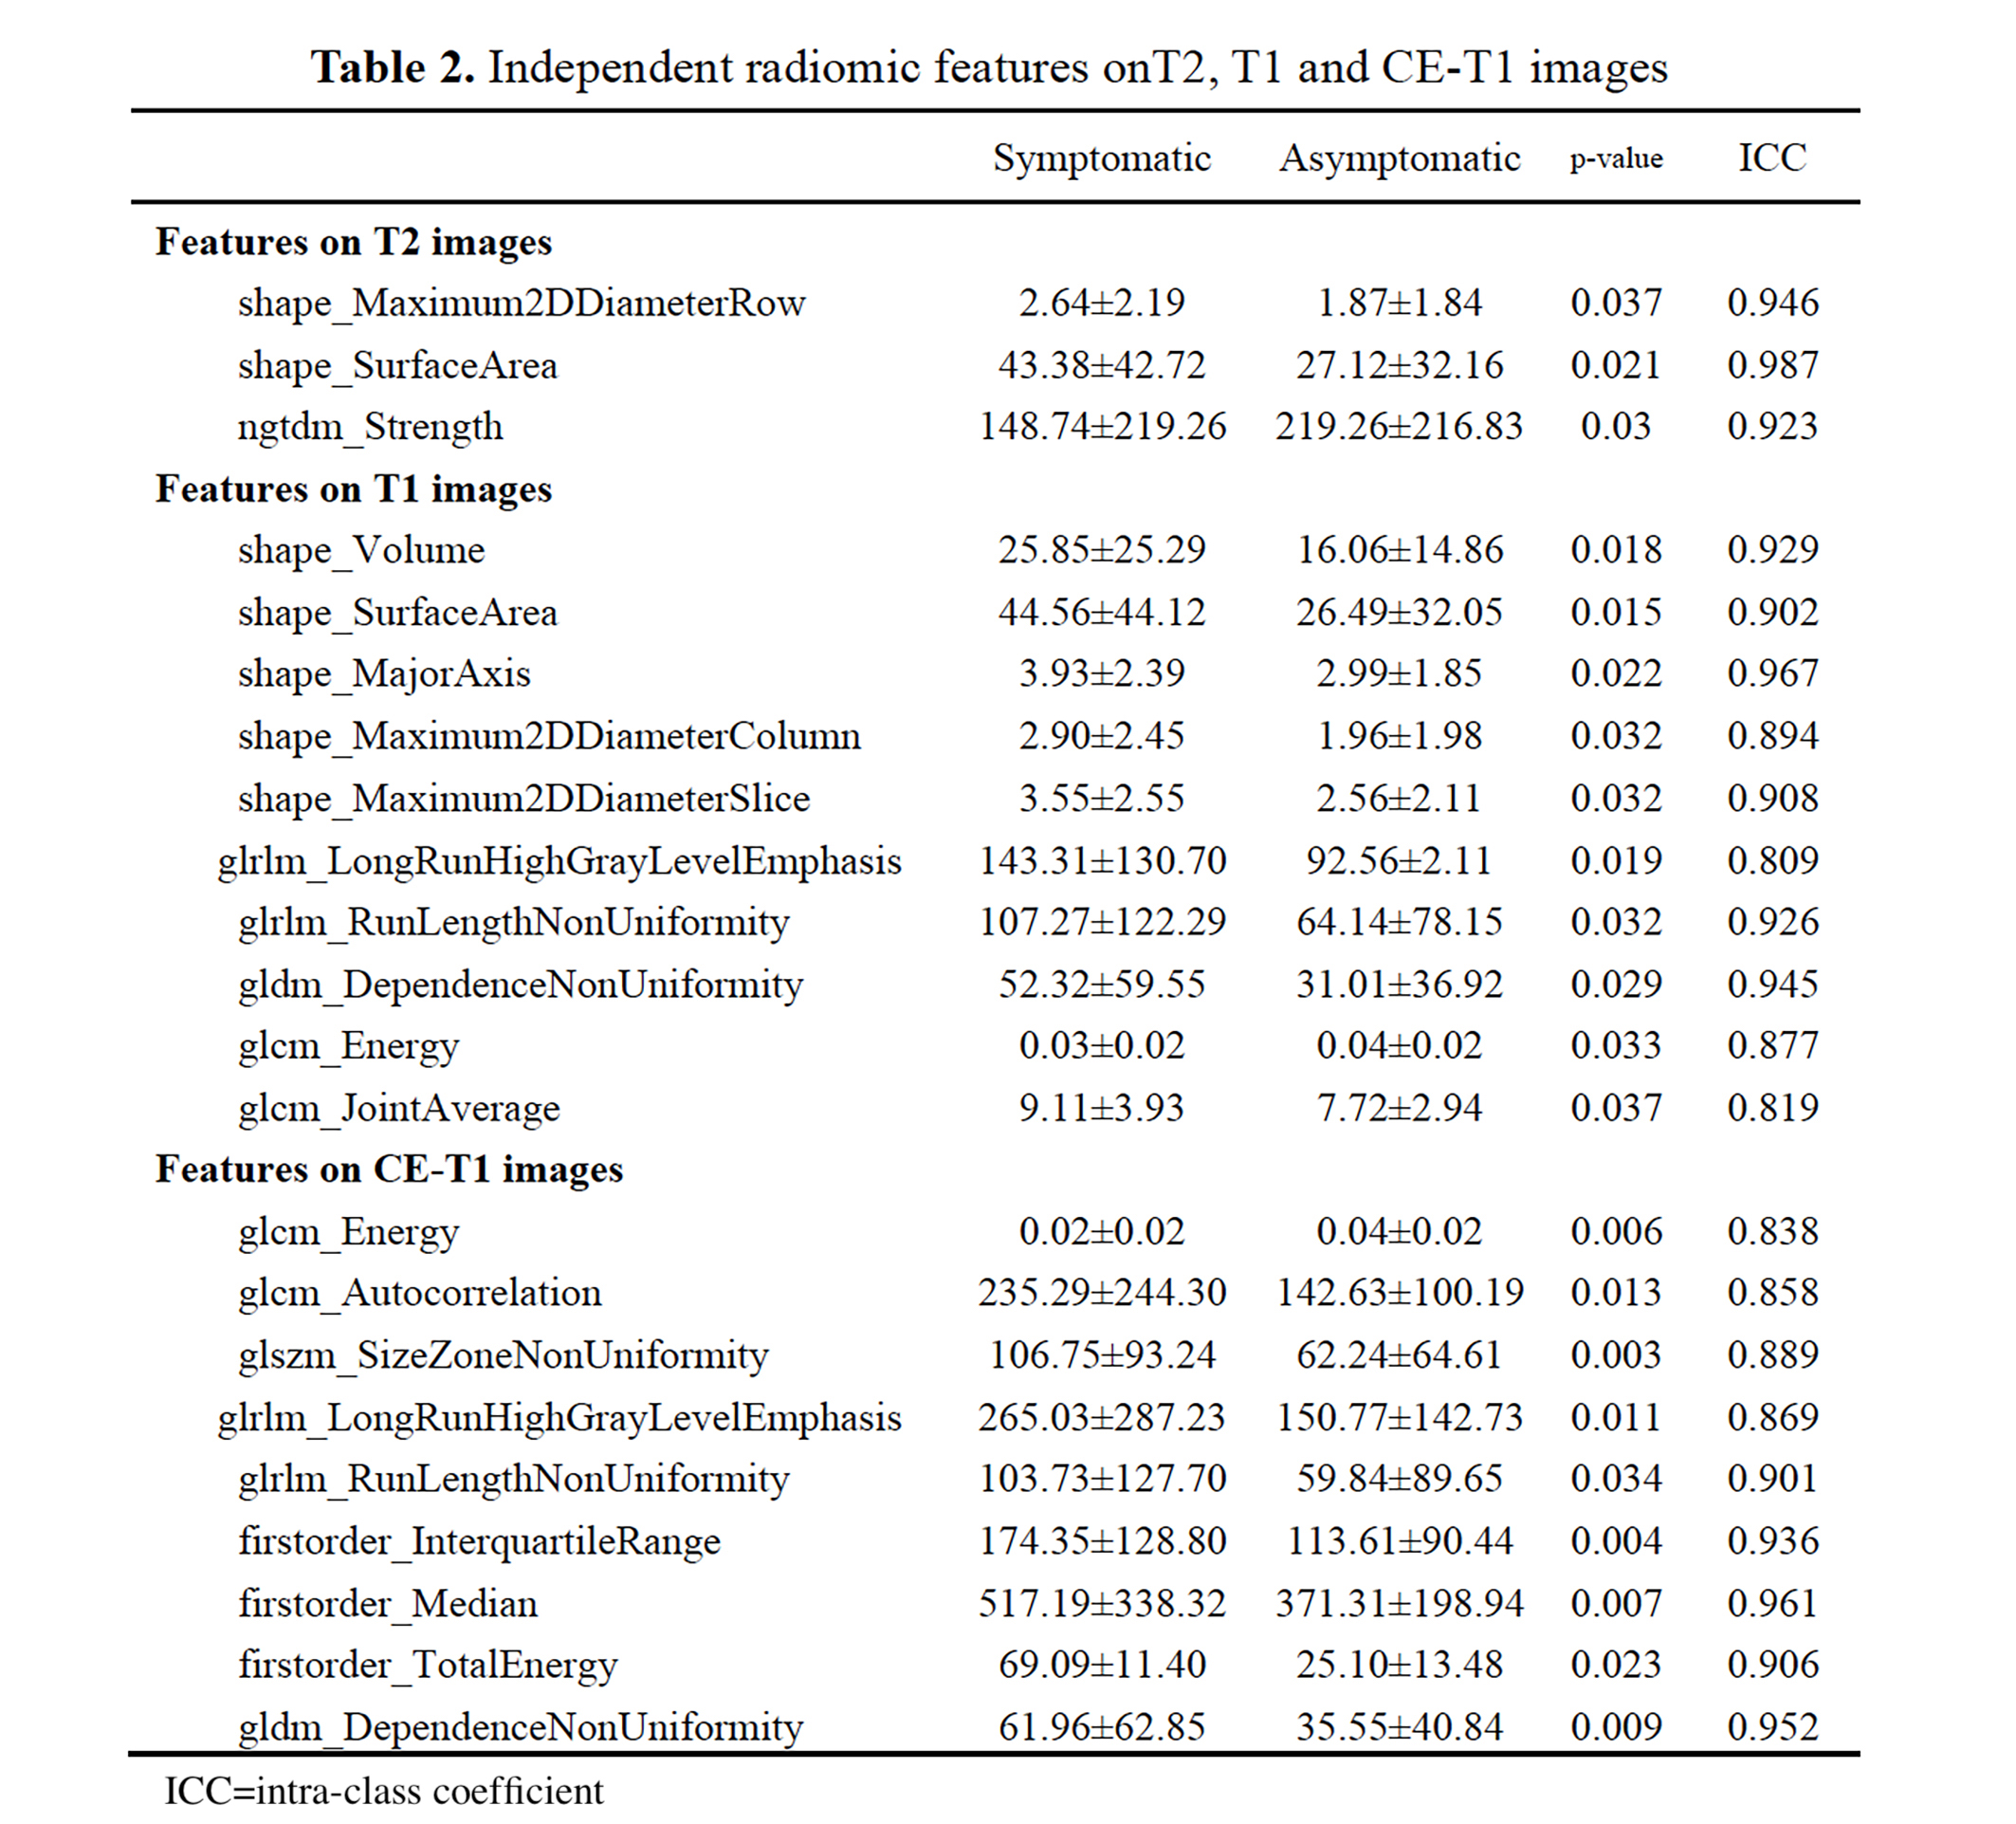
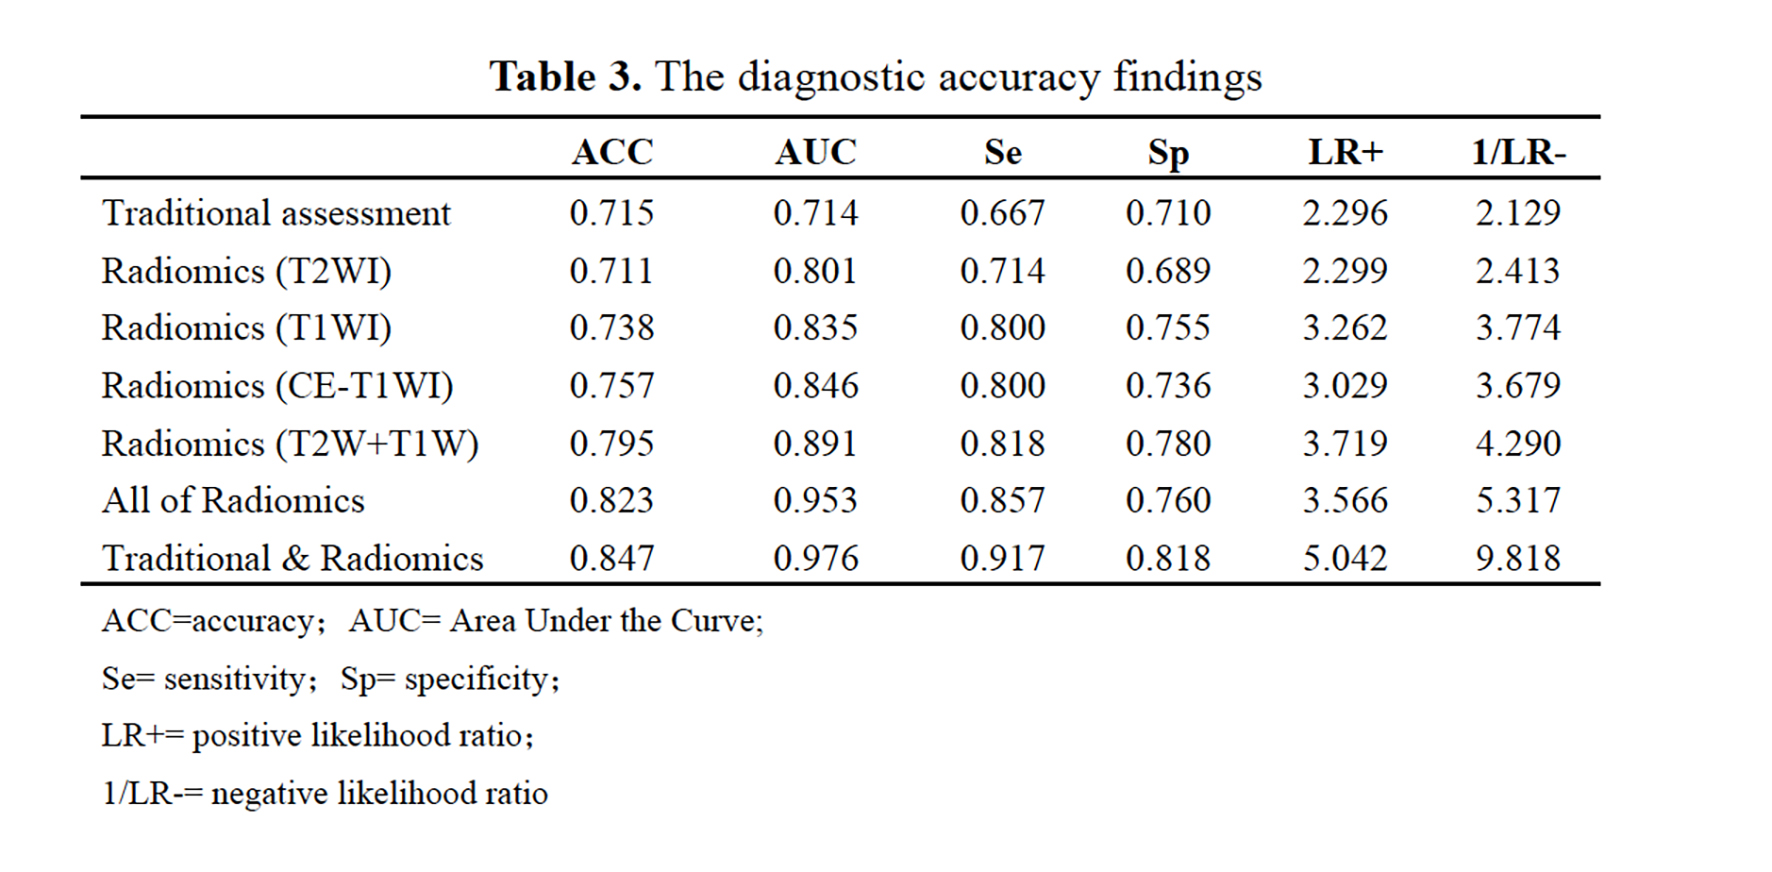
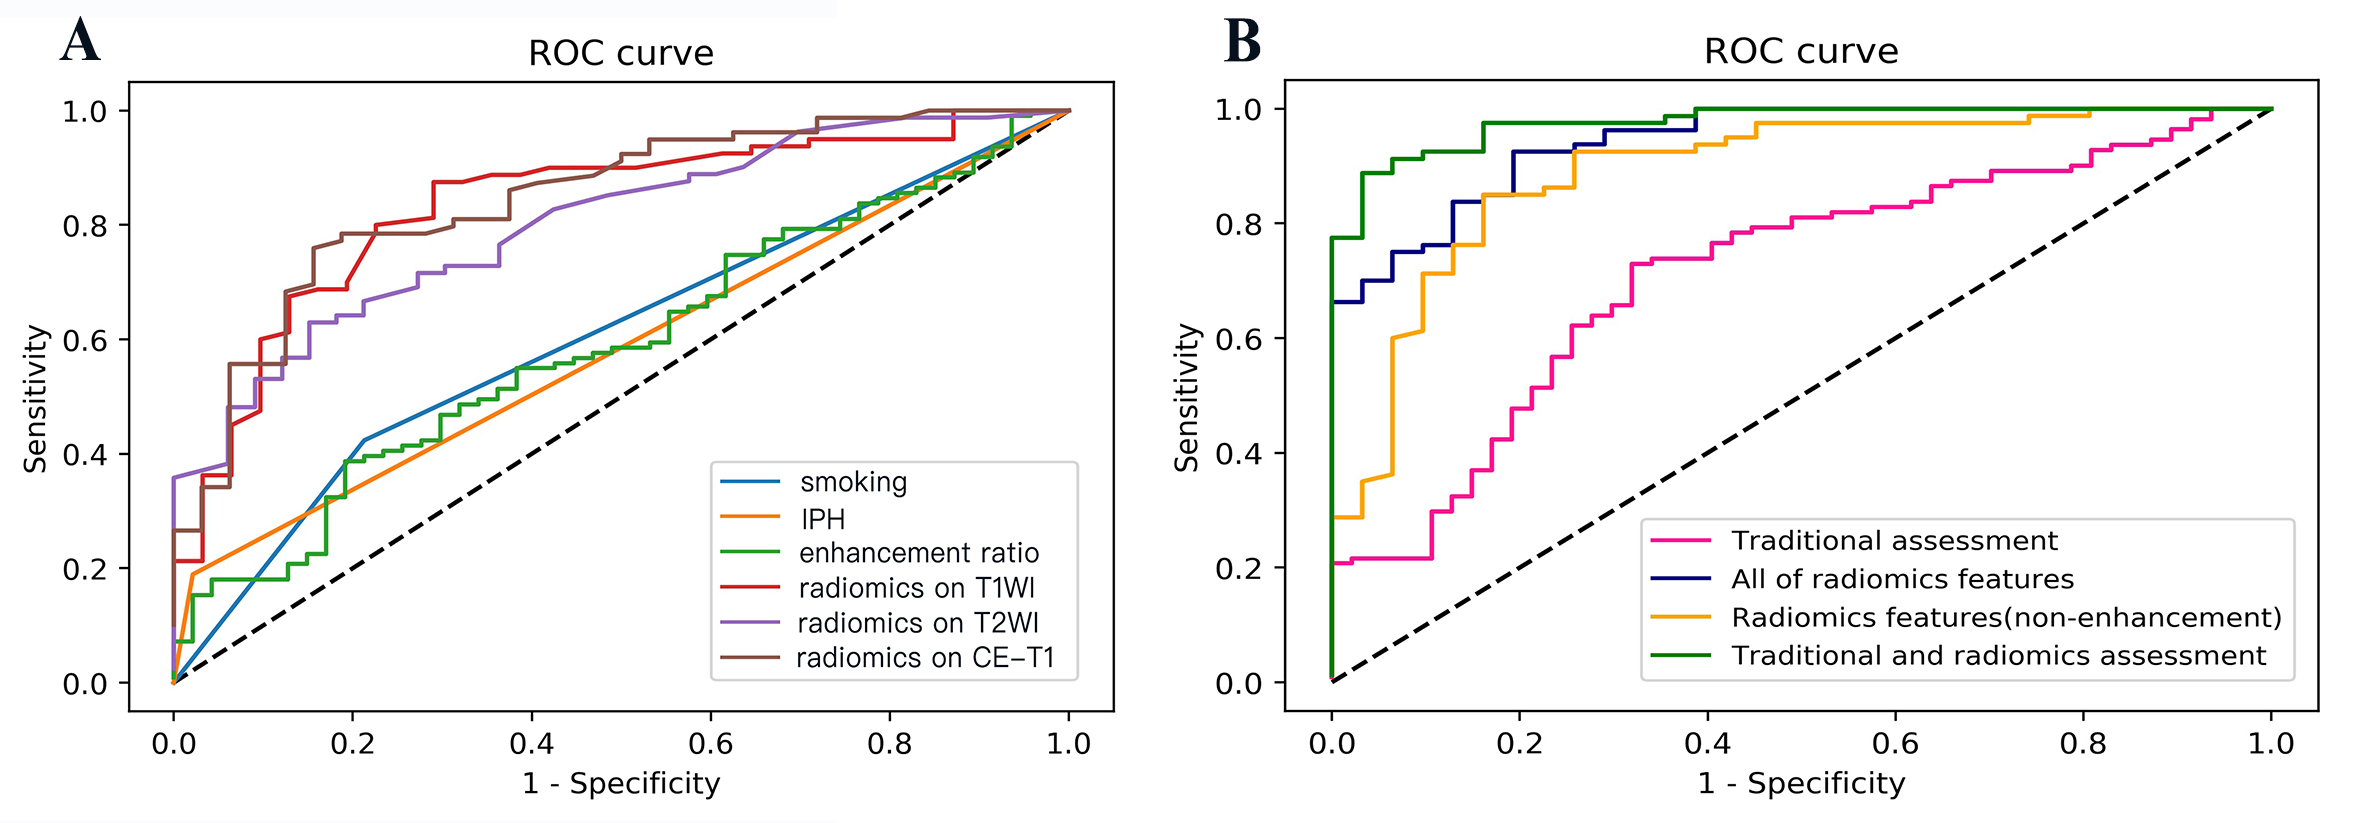
The demographic data of the patients is shown in Figure-2. Smoking (odds ratio [OR]=2.724; 95%CI,1.200-6.183), IPH (OR=11.340; 95%CI, 1.441-89.221) and enhancement ratio (OR=6.865; 95%CI, 1.052-44.802) were independently associated with symptomatic plaques. The combined smoking, IPH and enhancement ratio had an area under the curve (AUC) of 0.714 for identifying symptomatic plaques. Radiomic features in T2, T1 and CE-T1 images were associated with symptomatic plaques (Figure-3), whose AUC respectively are 0.801,0.835 and 0.846. The combined all radiomic approach had a significantly higher AUC of 0.953. Combination of all features reached an AUC of 0.976, with accuracy of 87.4%. (Figure-4&5)Discussion
Our previous study had shown that quantitative radiomic analysis accurately could differentiate symptomatic from asymptomatic basilar artery atherosclerotic plaques on HR-MRI. 2 However, this retrospective study suggests radiomic analysis could identify both MCA and BA intracranial plaque, and substantially improve assessment of symptomatic versus asymptomatic intracranial atherosclerosis. Compared with conventional methods, radiomic analysis is more quantitative and may detect “agnostic” features that the radiologist cannot appreciate such as uniformity or randomness (entropy) of the intensities on the image.3 Radiomics provides richer information about intensity, shape, size or volume, and texture of the plaque/tumor. Because of these advantages, radiomics has shown great prognostic value. Radiomic analysis has the benefit of identifying quantitative variables within imaging data to improve accuracy (84.7% as shown in this study) and diagnostic confidence beyond conventional measurements. The favorable accuracy values in this study over those previously reported by conventional HR-MRI support the use of radiomic analysis to improve identification of acute symptomatic plaque.Conclusion
Radiomic analysis of intracranial artery plaque on HR-MRI accurately distinguished between plaques in patients who were symptomatic and plaques in patients who were asymptomatic. The highest accuracy was achieved by combining radiomic features with traditional assessment of clinical and morphological features.Key words
intracranial arteriosclerosis; magnetic resonance imaging; radiomicsAcknowledgements
No acknowledgement found.References
1.Aerts, Hugo JWL, et al. Nature communications (2014).
2.Shi Z, Zhu C, et al. European Radiology (2018).
3.Gillies R, Kinahan p, Radiology (2016).
Figures