0825
Magnetic resonance molecular imaging of EDB fibronectin with a ZD2 peptide Gd(HP-DO3A) conjugate for detecting pancreatic cancer1Biomedical Engineering, Case Western Reserve University, Cleveland, OH, United States, 2Radiology, Johns Hopkins University, Baltimore, MD, United States
Synopsis
Pancreatic cancer (PC) carries a poor prognosis, partially due to lack of early diagnosis. To address this unmet need, the potential of magnetic resonance molecular imaging of extradomain B fibronectin with an oligopeptide targeted MRI contrast agent was assessed in mouse models of PC. Four PC cell lines were assayed for EDB-FN expression in vitro and found to overexpress EDB-FN. Analysis of ZD2 binding and contrast enhanced MRI demonstrated over two-fold improvement in CNR compared to non-targeted gadoteridol, with little non-specific binding. Histological analysis revealed the expression of EDB-FN in the tumor microenvironment and confirmed the features observed on MRI
Introduction
Although pancreatic cancer (PC) is an uncommon cancer, it has one of the highest mortality rate of all maligancies1. Current diagnostic methods for PC are unable to detect early stage disease that is typically more responsive to treatment2,3. There is an urgent need for a new generation of imaging agents that can be targeted to molecular biomarkers of PC malignancy. Multiple studies have implicated the extracellular matrix (ECM) oncoprotein, extradomain-B fibronectin (EDB-FN), as a marker of increased aggressiveness and poor prognosis in a variety of neoplasms4-10, with negligible expression in normal tissues10-12. We hypothesize that elevated expression of EDB-FN is a promising target for molecular imaging and early detection of PC with MRI. To evaluate the utility of molecular imaging of EDB-FN, a oligopeptide targeting ligand, ZD2 was developed to bind to EDB-FN with high specificity12. The effectiveness of magnetic resonance molecular imaging (MRMI) with an optimized ZD2 targeted MRI contrast agent for detecting PC was investigated in this work.Methods
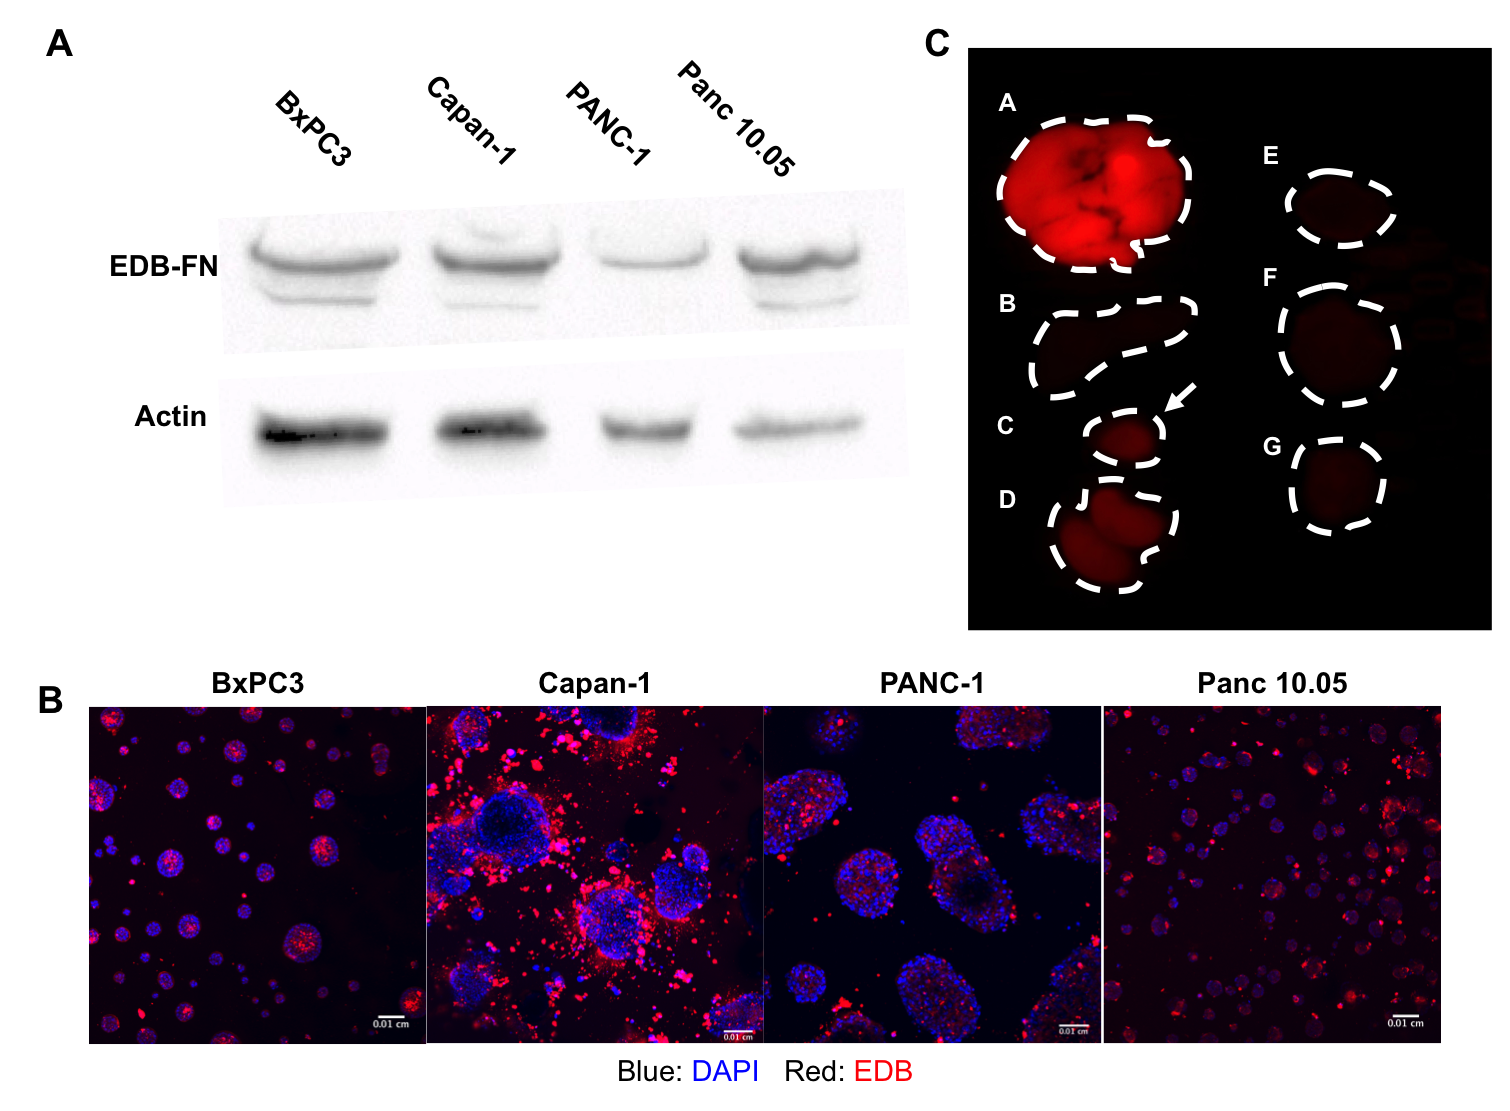
EDN-FN expression was determined in four human PC cell lines, BxPC3, Capan-1, PANC-1, and Panc 10.05. PC cells were cultured per ATCC guidelines. Cells were lysed in RIPA with protease inhibitor cocktail. 30 μg of protein was blotted onto a nitrocellulose membrane and detected with BC-1 anti-EDB-FN antibody for western blotting. Tumor spheroids were grown on Matrigel in chamber slides at a density of 2.5x10⁴ cells/well. A fluorescent dye ZD2-Cy5.5 was used to stain cells grown in 3D Matrigel culture. Tumorspheres were treated with Hoechst 33342 (1μg/mL) and ZD2-Cy5.5 (500 nM) for 1 hour. For in vivo studies, 10 nmol of ZD2-Cy5.5 was injected and allowed to circulate for 3 hours before sacrifice according to an IACUC protocol and imaged on a Maestro imaging system to assess EDB-FN expression in tumor models. Animal models were developed through subcutaneous injection of 4x10⁶ cells suspended in Matrigel in female athymic nude mice (n=7). ZD2-N3-Gd(HP-DO3A) administered to mice at a dose of 0.1 mmol/kg via tail vein catheter. MR images were acquired on a Bruker Biospin 7T scanner using a multi-Spin multi-Echo (MSME) T1-weighted MRI sequence. Image analysis was performed in Horus and FIJI software. Tumors were excised and preserved in 10% formalin and sectioned to assess EDB-FN expression. Tissues were deparaffinized and stained with a 1 μM solution of ZD2-Cy5.5 in PBS-T for 1 hour and mounted with DAPI anti-fade mounting medium.
Results
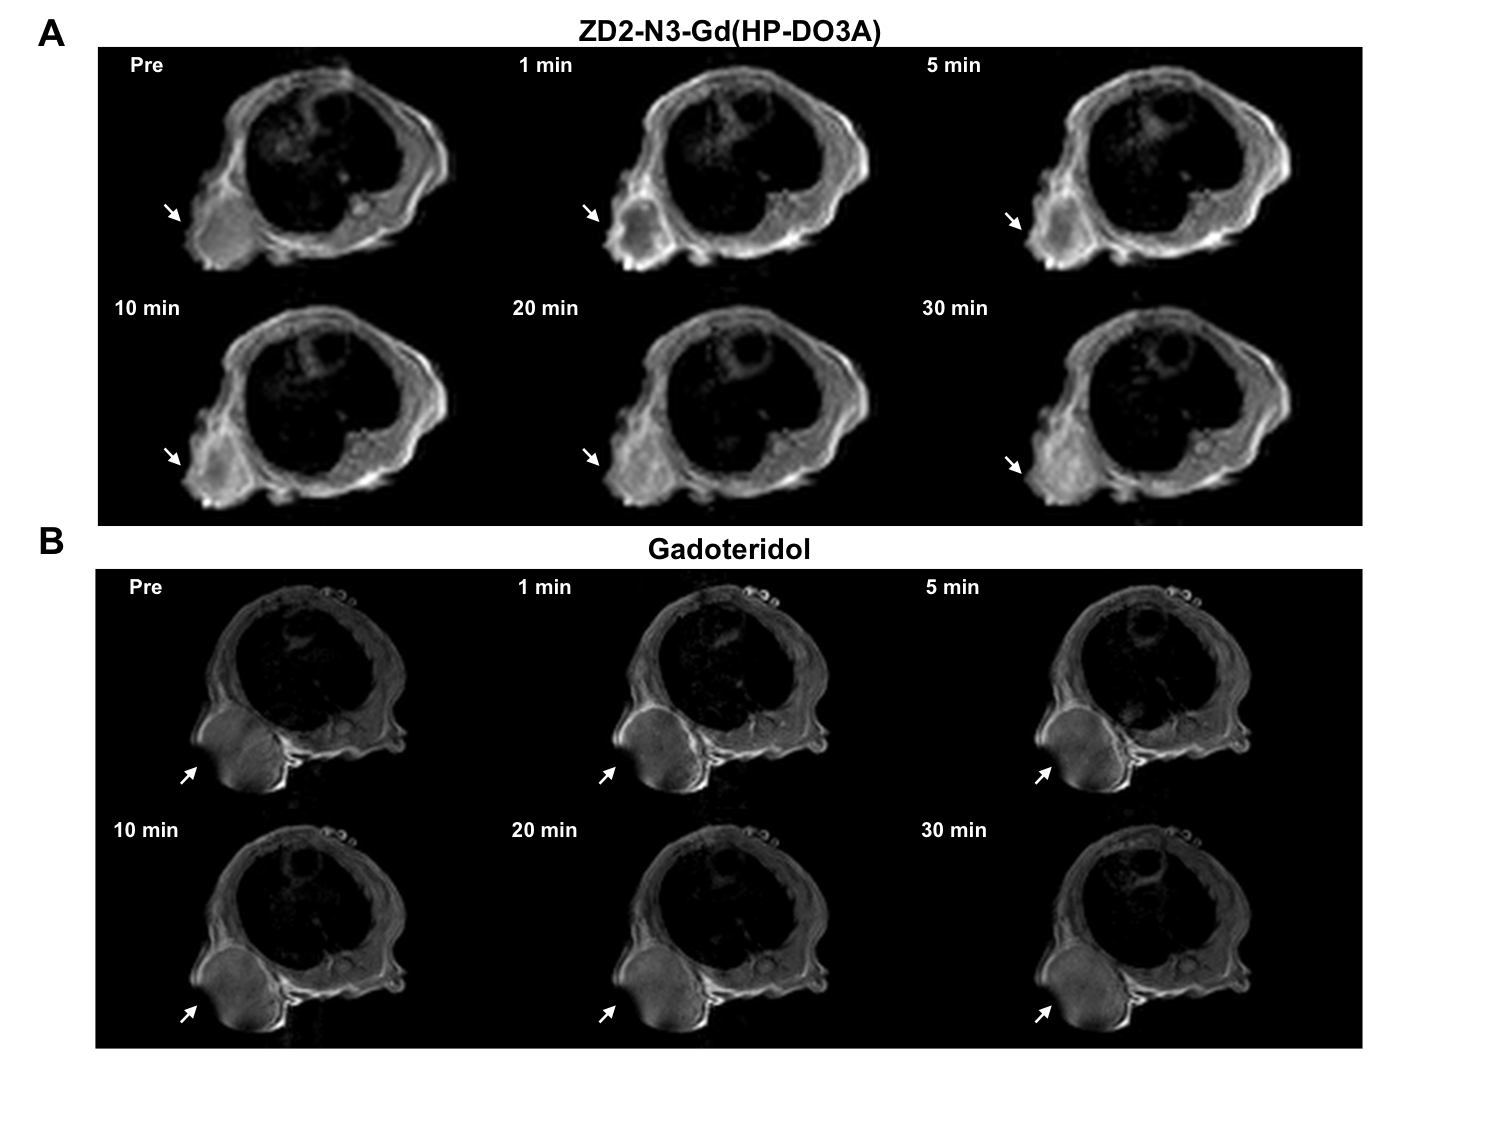
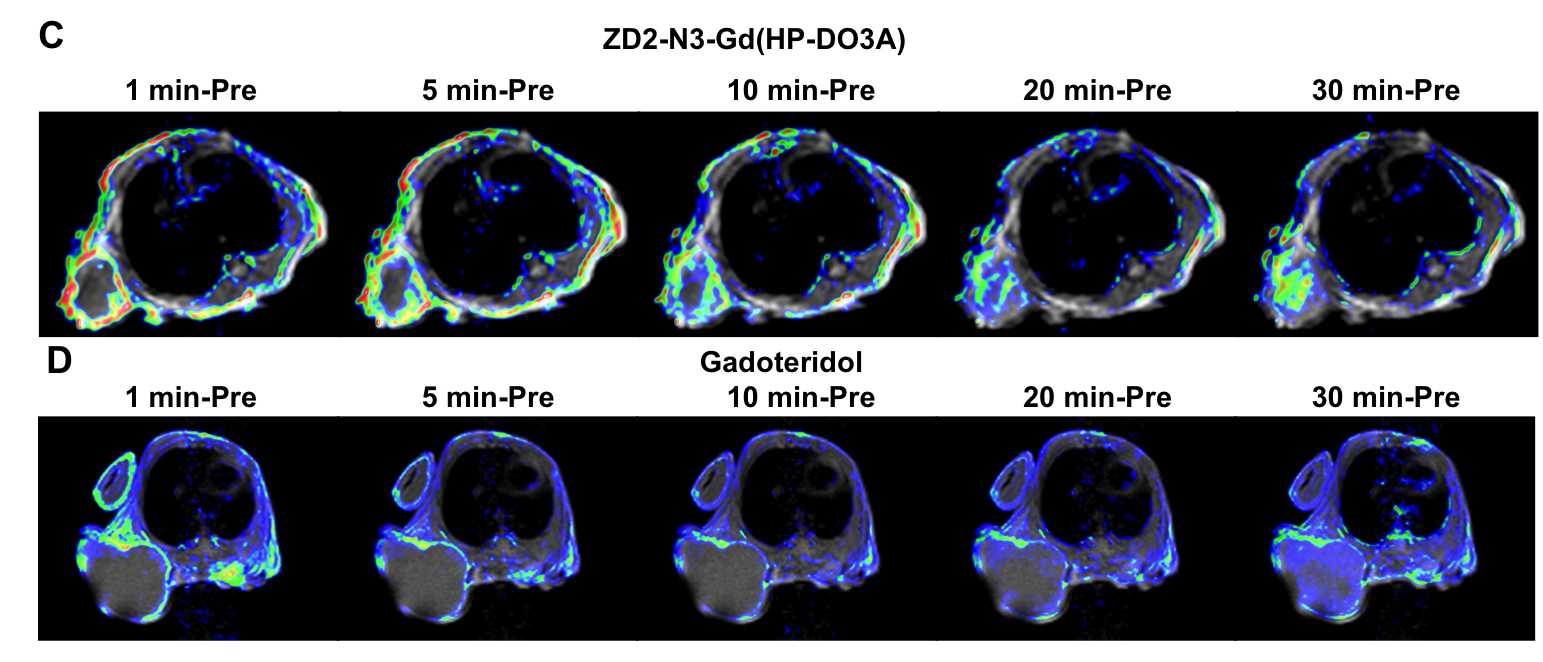
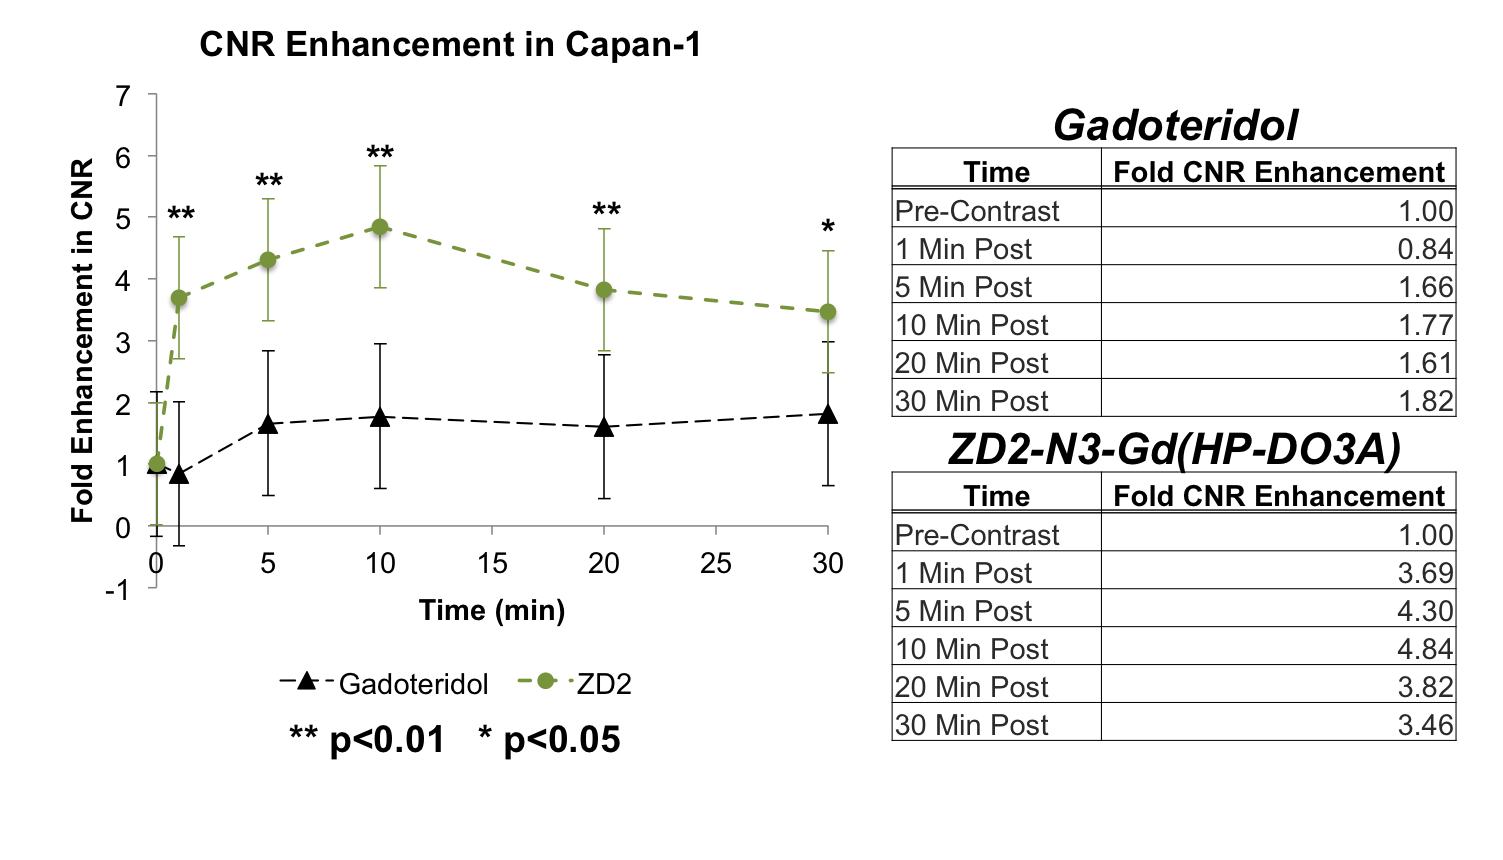
EDB-FN protein expression was detected in all cell lines (Figure 1A). Spheroids were found to express EDB-FN (Figure 1B). ZD2-Cy5.5 accumulated preferentially within the tumor, but not normal tissue, indicating high EDB-FN expression in tumors (Figure 1C). T1 weighted MRI studies in a Capan-1 mouse xenograft model with ZD2-N3-Gd(HP-DO3A) identified an early ring-enhancing lesion that gradually gained core enhancement between 10-30 minutes (Figure 2A). MRI with untargeted contrast agent gadoteridol did not exhibit strong enhancement (Figure 2B). Image subtraction of pre-contrast images from post-contrast images was also performed. ZD2-N3-Gd(HP-DO3A) treated mice demonstrated substantial signal changes in the tumor core and periphery, whereas gadoteridol treated mice did not (Figure 3 A,B). Contrast-to-Noise (CNR) analysis revealed an over two fold improvement in CNR with ZD2-N3-Gd(HP-DO3A) when compared to gadoteridol (Figure 4).
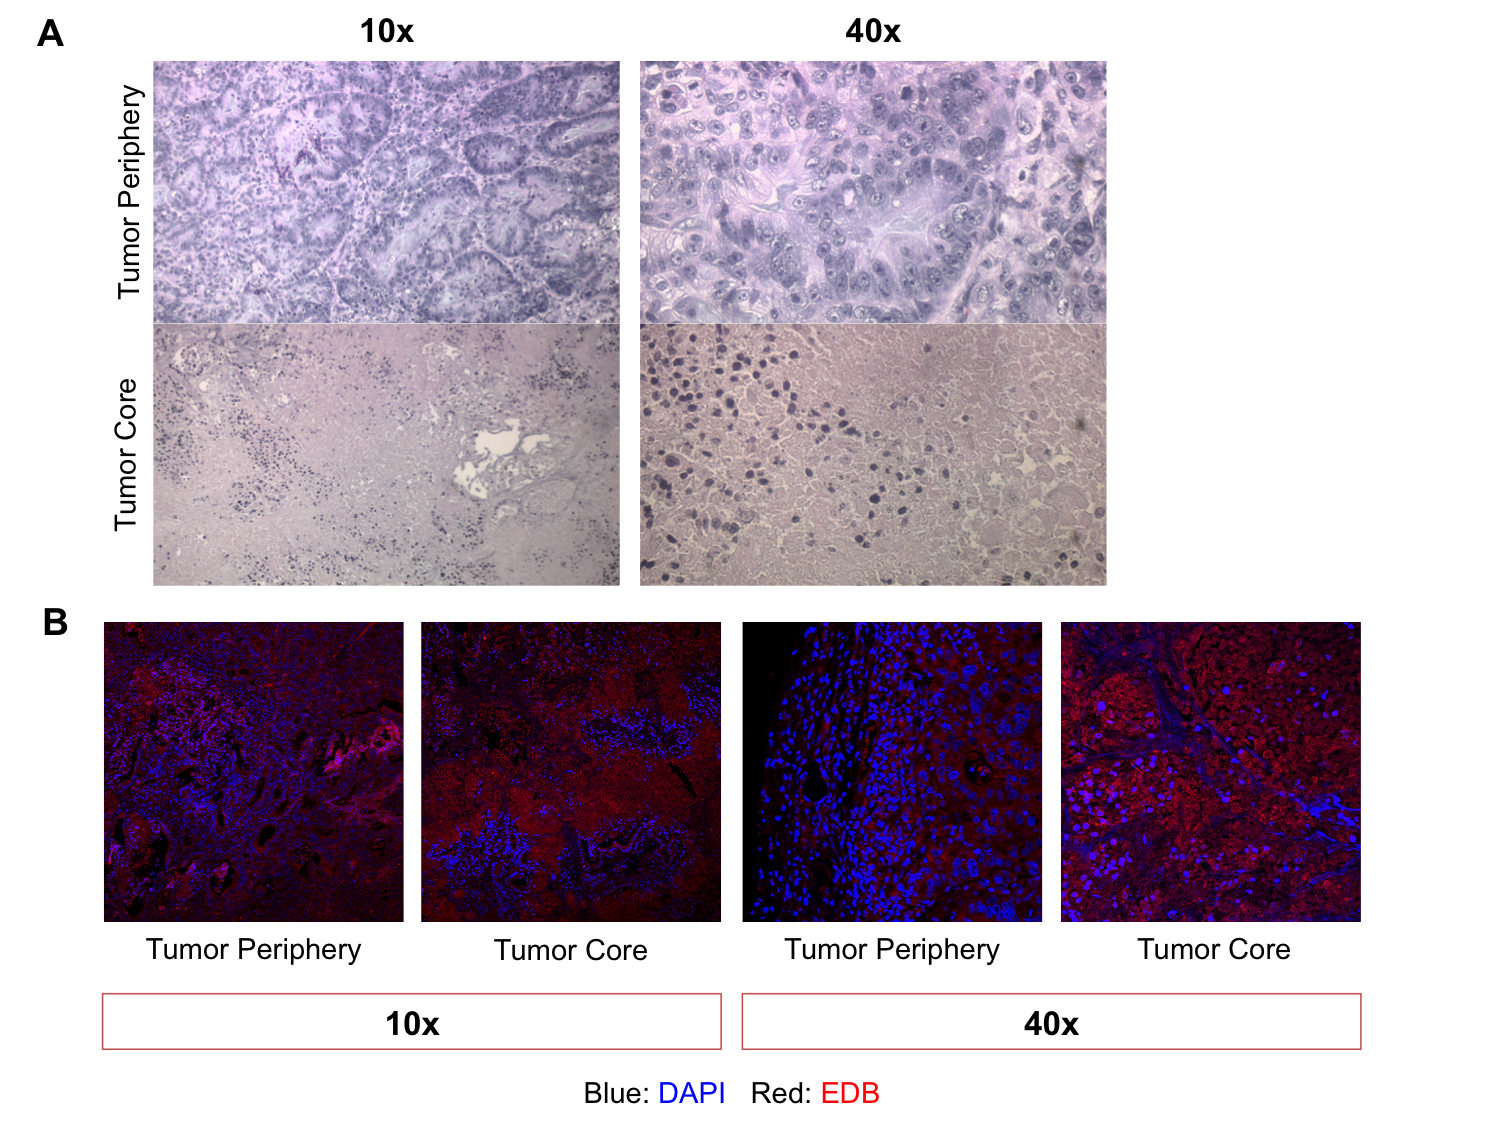
Subsequent histological analysis of the imaged tumors revealed substantial intratumoral differences in morphology with hematoxylin and eosin staining (Figure 5A). The tumor periphery was dominated by highly cellular structures, whereas the tumor core contained sparse nests of cells and exhibited predominately eosinophilic staining. Tissue sections were also stained with ZD2-Cy5.5 (Figure 5B), which revealed extensive EDB-FN expression at both the tumor periphery and tumor core.
Discussion & Conclusion
Western blot and tumor staining of PC spheroids demonstrate overexpression of EDB-FN in vitro. This suggests that EDB-FN expression may be a generalizable oncomarker in PC. In vivo fluorescence analysis of a tumor xenograft model suggests that ZD2-mediated targeting to EDB-FN is highly specific to malignant tissue, and not surrounding normal tissues. Contrast enhanced MRI with the ZD2 conjugated contrast agent demonstrated the superior tumor contrast generated when compared to the non-targeted agent currently in clinical use. Furthermore, ZD2-N3-Gd(HP-DO3A) demonstrates the ability to penetrate and remain in the core of the tumor, despite a variety of driving forces commonly thought to minimize the penetration and retention of contrast agents in PC tumor cores, such as increased interstitial fluid pressure and poor vascularization. In conclusion, MRMI with ZD2-N3-Gd(HP-DO3A) improves tumor CNR in a mouse model of PC. These data provide evidence that the ZD2-targeted agent has the potential to improve early PC diagnosis and treatment.Acknowledgements
The project described was supported by was supported by the National Institute of Health grants R44CA199826(ZRL). The content is solely the responsibility of the authors and does not necessarily represent the official views of the National Cancer Institute or the National Institutes of Health.References
1 Siegel Rebecca, L., Miller Kimberly, D. & Jemal, A. Cancer statistics, 2018. CA: A Cancer Journal for Clinicians 68, 7-30, doi:10.3322/caac.21442 (2018).
2 Lee, E. S. & Lee, J. M. Imaging diagnosis of pancreatic cancer: A state-of-the-art review. World Journal of Gastroenterology : WJG 20, 7864-7877, doi:10.3748/wjg.v20.i24.7864 (2014).
3 Burk, K. S., Lo, G. C., Gee, M. S. & Sahani, D. V. Imaging and Screening of Pancreatic Cancer. Radiol Clin North Am 55, 1223-1234, doi:10.1016/j.rcl.2017.06.006 (2017).
4 Scarpino, S. et al. Expression of EDA/EDB isoforms of fibronectin in papillary carcinoma of the thyroid. The Journal of Pathology 188, 163-167, doi:10.1002/(SICI)1096-9896(199906)188:2<163::AID-PATH335>3.0.CO;2-1 (1999).
5 Salge-Bartels, U., Heiden, M., Seitz, R. & Gieseler, F. PO-18 - Fibronectin EDA/EDB is expressed in adherent SCLC NCI-H69 cells and in pleural effusions of lung cancer patients: possible implication for drug resistance. Thrombosis Research 140, S182-S183, doi:https://doi.org/10.1016/S0049-3848(16)30151-7 (2016).
6 Arnold, S. A. et al. Urinary oncofetal ED-A fibronectin correlates with poor prognosis in patients with bladder cancer. Clinical & experimental metastasis 33, 29-44, doi:10.1007/s10585-015-9754-x (2016).
7 Süer, S., Sönmez, H., Karaaslan, İ., Baloğlu, H. & Kökoğlu, E. Tissue sialic acid and fibronectin levels in human prostatic cancer. Cancer Letters 99, 135-137, doi:https://doi.org/10.1016/0304-3835(95)04084-6 (1996).
8 Bae, Y. K. et al. Fibronectin expression in carcinoma cells correlates with tumor aggressiveness and poor clinical outcome in patients with invasive breast cancer. Human Pathology 44, 2028-2037, doi:https://doi.org/10.1016/j.humpath.2013.03.006 (2013).
9 Li, Y. et al. Synthesis and Assessment of Peptide Gd–DOTA Conjugates Targeting Extradomain B Fibronectin for Magnetic Resonance Molecular Imaging of Prostate Cancer. Molecular Pharmaceutics 14, 3906-3915, doi:10.1021/acs.molpharmaceut.7b00619 (2017).
10 Han, Z. et al. Targeted gadofullerene for sensitive magnetic resonance imaging and risk-stratification of breast cancer. Nature Communications 8, 692, doi:10.1038/s41467-017-00741-y (2017).
11 Schwarzbauer, J. E. & DeSimone, D. W. Fibronectins, Their Fibrillogenesis, and In Vivo Functions. Cold Spring Harbor perspectives in biology 3, 10.1101/cshperspect.a005041 a005041, doi:10.1101/cshperspect.a005041 (2011).
12 Han, Z. et al. EDB Fibronectin Specific Peptide for Prostate Cancer Targeting. Bioconjugate Chemistry 26, 830-838, doi:10.1021/acs.bioconjchem.5b00178 (2015).
Figures