0819
Exploring the Accuracy of MR Vascular Fingerprinting: Potential Pitfall and Possible Remedy1Medical Biophysics, University of Toronto, Toronto, ON, Canada, 2Rotman Research Institute, Baycrest Health Sciences, Toronto, ON, Canada, 3Grenoble Institute of Neurosciences, Inserm, Grenoble, France, 4Radiology, Stanford University, Stanford, CA, United States
Synopsis
MR vascular fingerprinting (
Introduction:
Magnetic resonance fingerprinting (MRF) has proven to be a reliable quantitative approach to measure multiple tissue and field related parameters using a single MR acquisition1. MR vascular fingerprinting (MRvF) utilizes the same concept to infer quantitative microvascular information in an unprecedented way2. Based on the ratio of pre- and post-contrast gradient-echo sampling of FID and spin echo (GESFIDE) signal, MRvF has shown promising preliminary results by being able to give us estimates of voxelwise cerebral blood volume (CBV), blood oxygen-saturation (SO2) and mean radius of the vessels. However, there are still questions regarding the accuracy and precision of the parameter estimates and directions for further development 2-5. Here, first, using a more realistic simulation framework to account for the signal-to-noise ratio (SNR), we quantify the accuracy and precision of MRvF parameter estimates. We then explore the dependence of MRvF robustness on the degree of undersampling of the GESFIDE echo train. Finally, we use our findings to propose a means to increase the accuracy of MRvF in view of the SNR challenge.Materials and Methods:
Here 2D Monte Carlo simulations (obtained from simulated 3D vascular network) were used to generate the dictionary based on GESFIDE sequence ( other details as in2,6 ). We used the experimental data from 5 volunteers that were obtained in a previous study5. Briefly, this local IRB approved data was acquired with these parameters: 3T GE scanner, 8-channel head coil, GESFIDE parameters: TR=2000 ms, 40 TEs, TESE=100 ms, 128*128, 12 slices, FOV= 20cm x 20cm, Slice Thickness=1.5mm, Tacq=4min, GESFIDE scans before/after intravenous injection of Feraheme 7 mg Fe/kg. Post-contrast divided by pre-contrast data was used for the dictionary matching as in the original MRvF paper2.
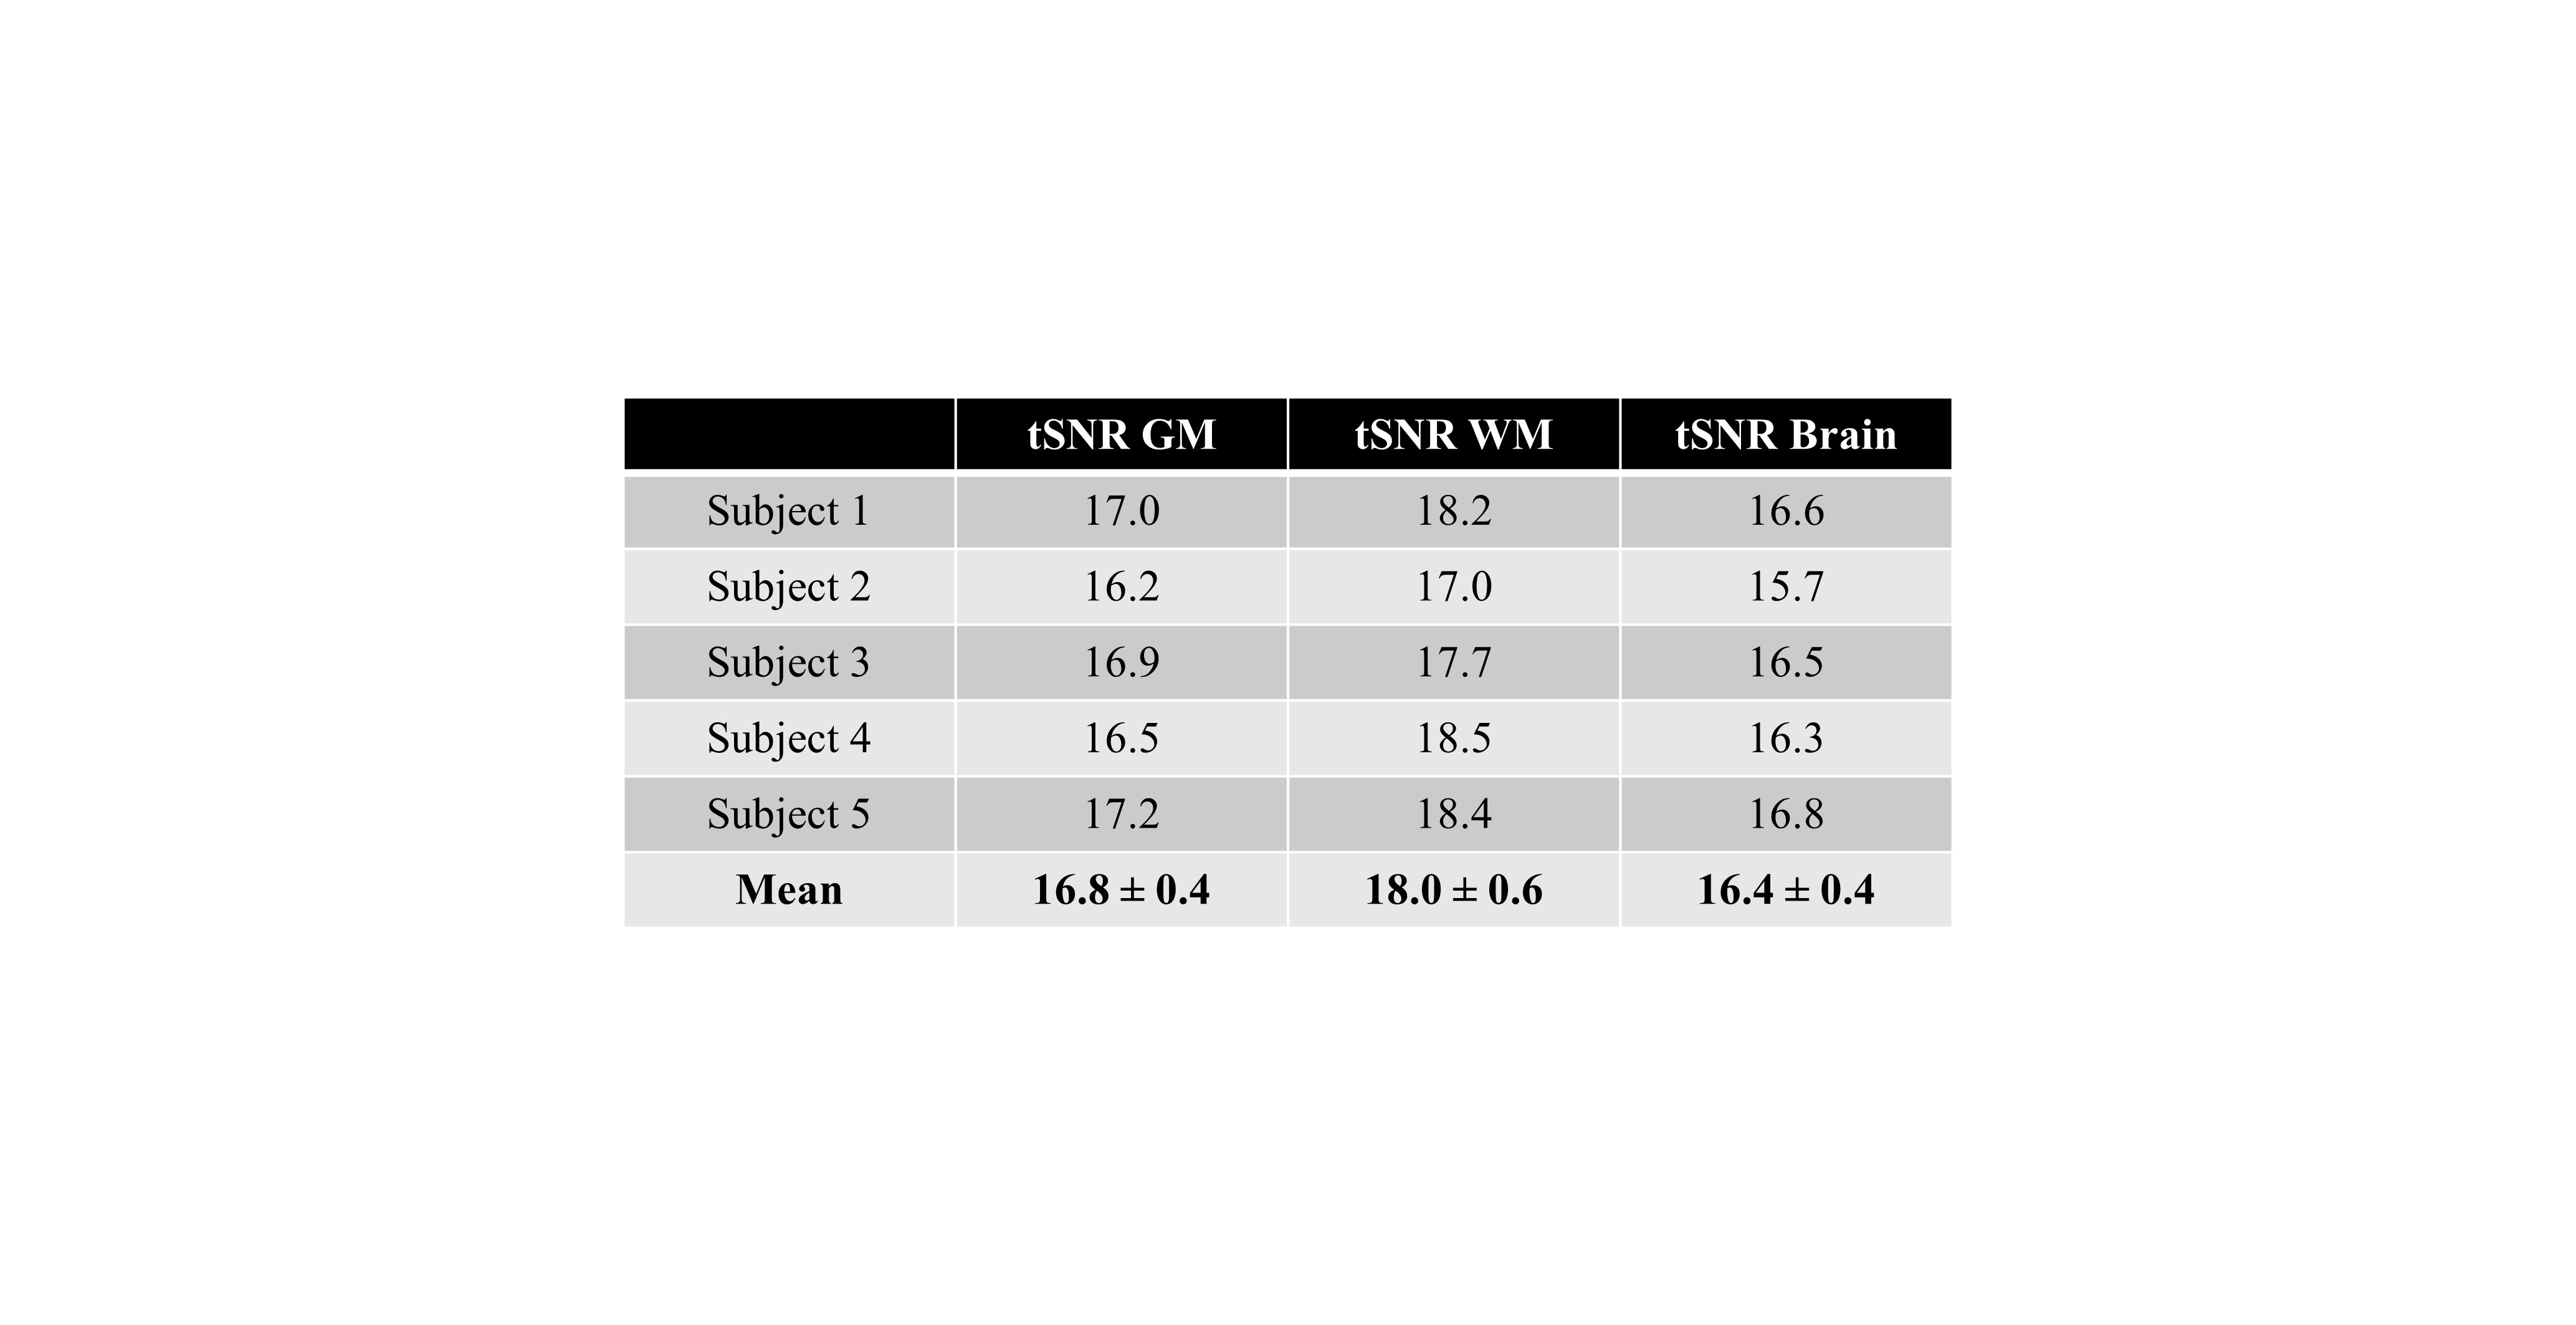
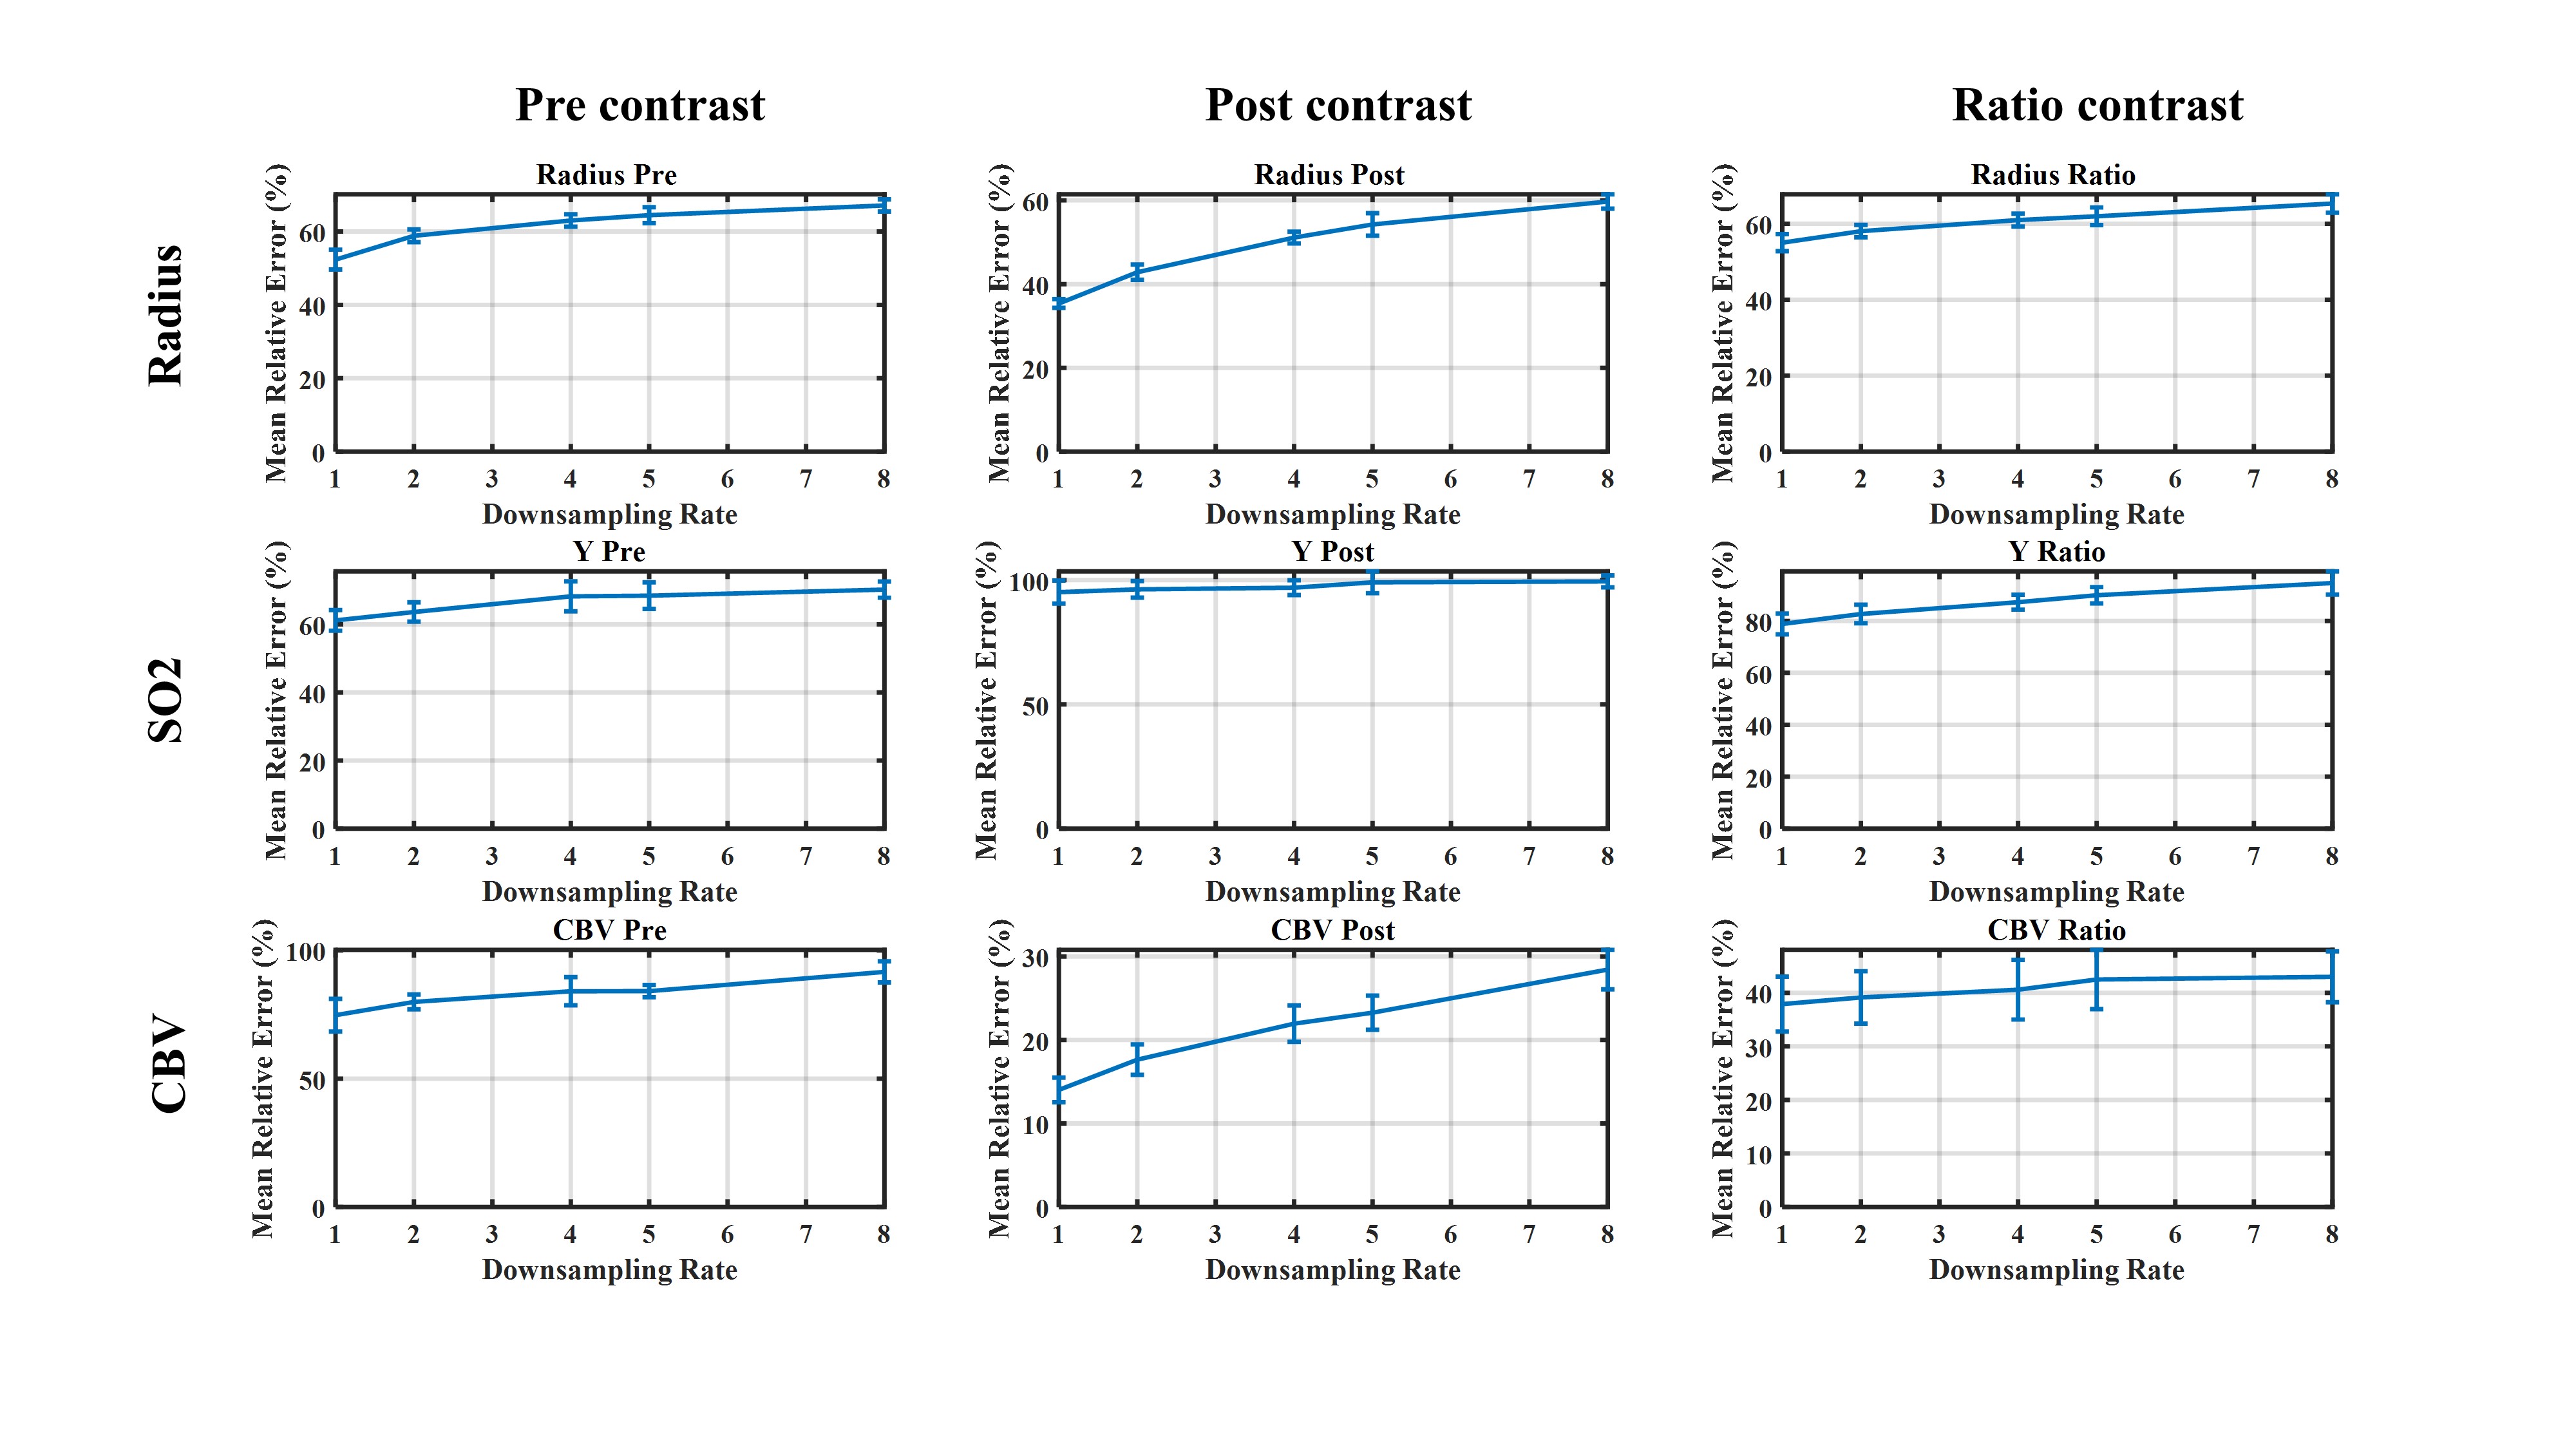
The MRvF SNR has previously been reported based on the spatial SNR at TESE. However, The dictionary matching is most sensitive to the GESFIDE multi-echo temporal SNR (tSNR), which is likely lower than the spatial SNR. To investigate this, here, an initial dictionary matching step was done (as in2) for all subjects, and the matched dictionary entry was taken to be the noiseless ground truth. By comparing this to the actual signal used for the match, we are able to estimate the noise and tSNR levels for each voxel. The mean absolute percent error was used to assess the accuracy of parameter estimates. To evaluate these error values, for a simulated dictionary, white Gaussian noise was added to each dictionary entry to achieve the estimated SNR levels. Then, parameter matching was done as in the experimental data. To test the effect of undersampling of the GESFIDE echo train, we applied varying degrees of retrospective undersampling (uniform echo spacing) to the pre-contrast, post-contrast and post/pre (ratio) data separately. Simulations and analysis were all done using in-house codes written in MATLAB and C++.
Results:
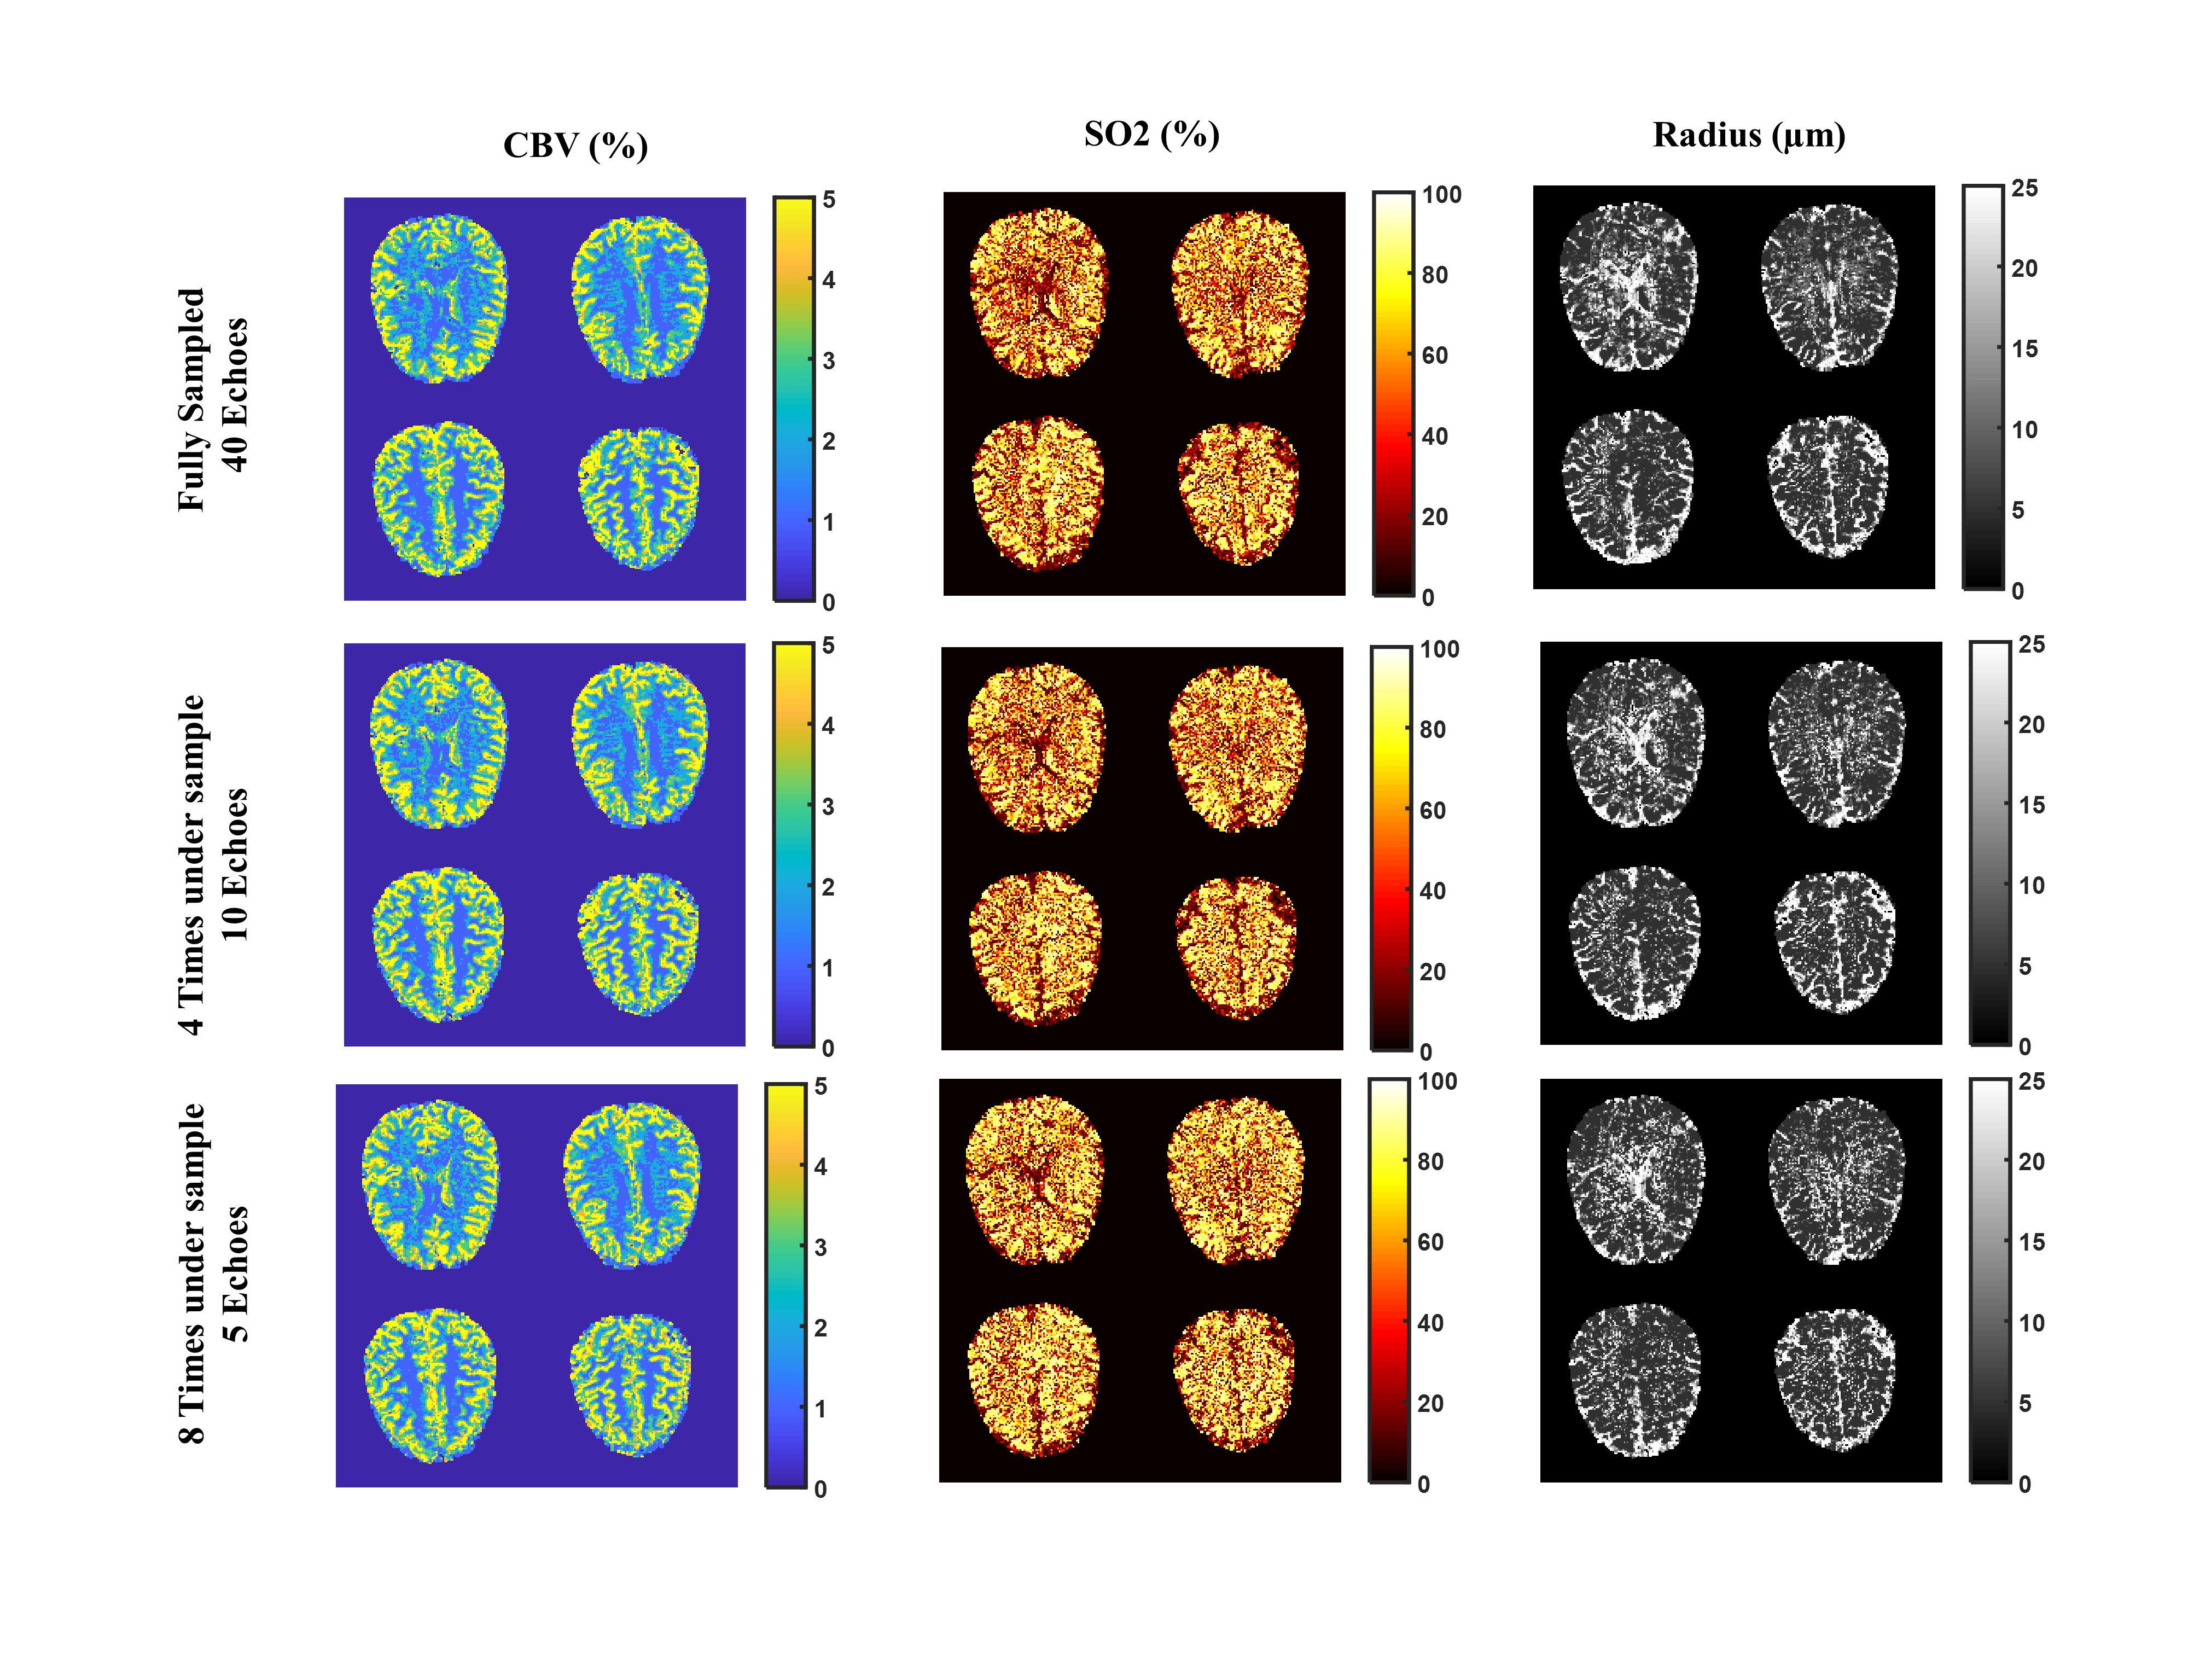
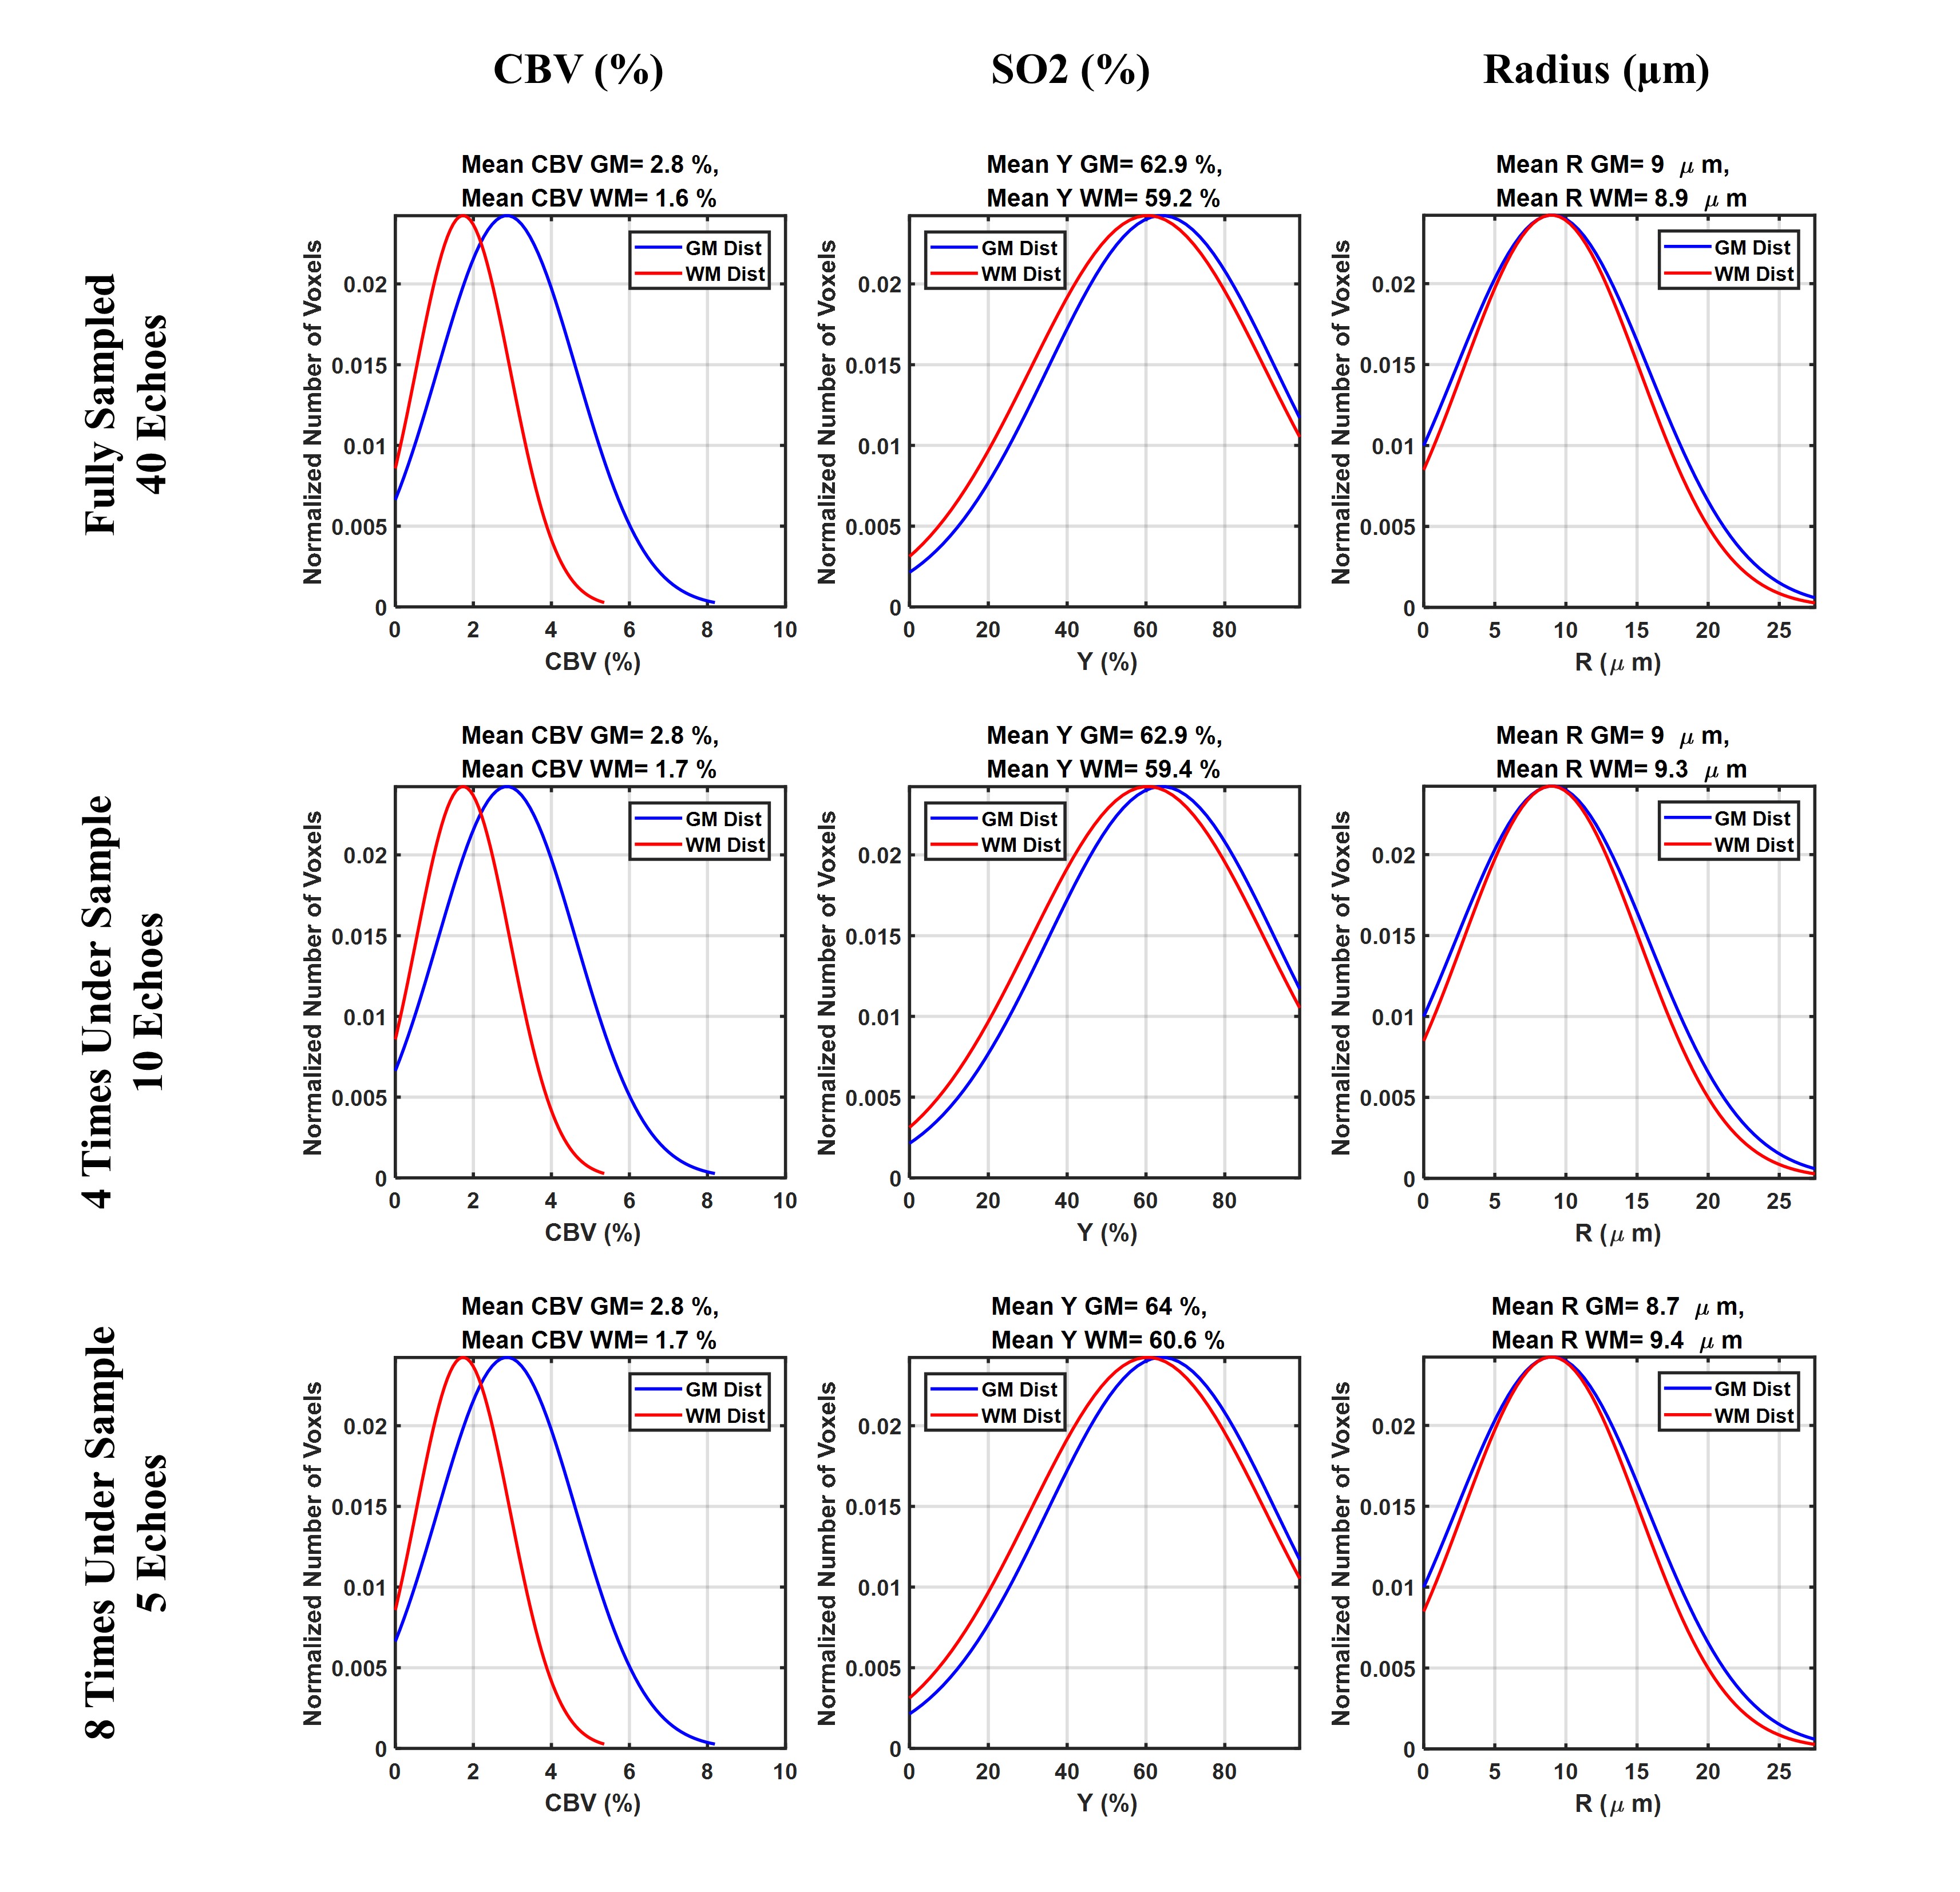
Figure 1 shows the mean tSNR estimates for each subject in GM/WM and the whole brain using the new approach that was explained above. Figure 2 shows the mean percent error of the parameter estimates associated with various levels of undersampling and while using pre, post, or the ratio dictionary. For fully sampled data, these values are higher than previously reported ones2, still, this simulation shows undersampling is possible without a significant loss in the accuracy of the parameter estimates in most of the cases. Figure 3 shows parametric maps for one subject (#1) using fully sampled data along with two different levels of retrospective undersampling. These maps look visually very similar, in line with our expectations from Monte Carlo simulations. Figure 4 shows group averaged values for both GM and WM parameter estimates, implying again the minor change in the mean values as a result of undersampling.Discussions and Conclusions:
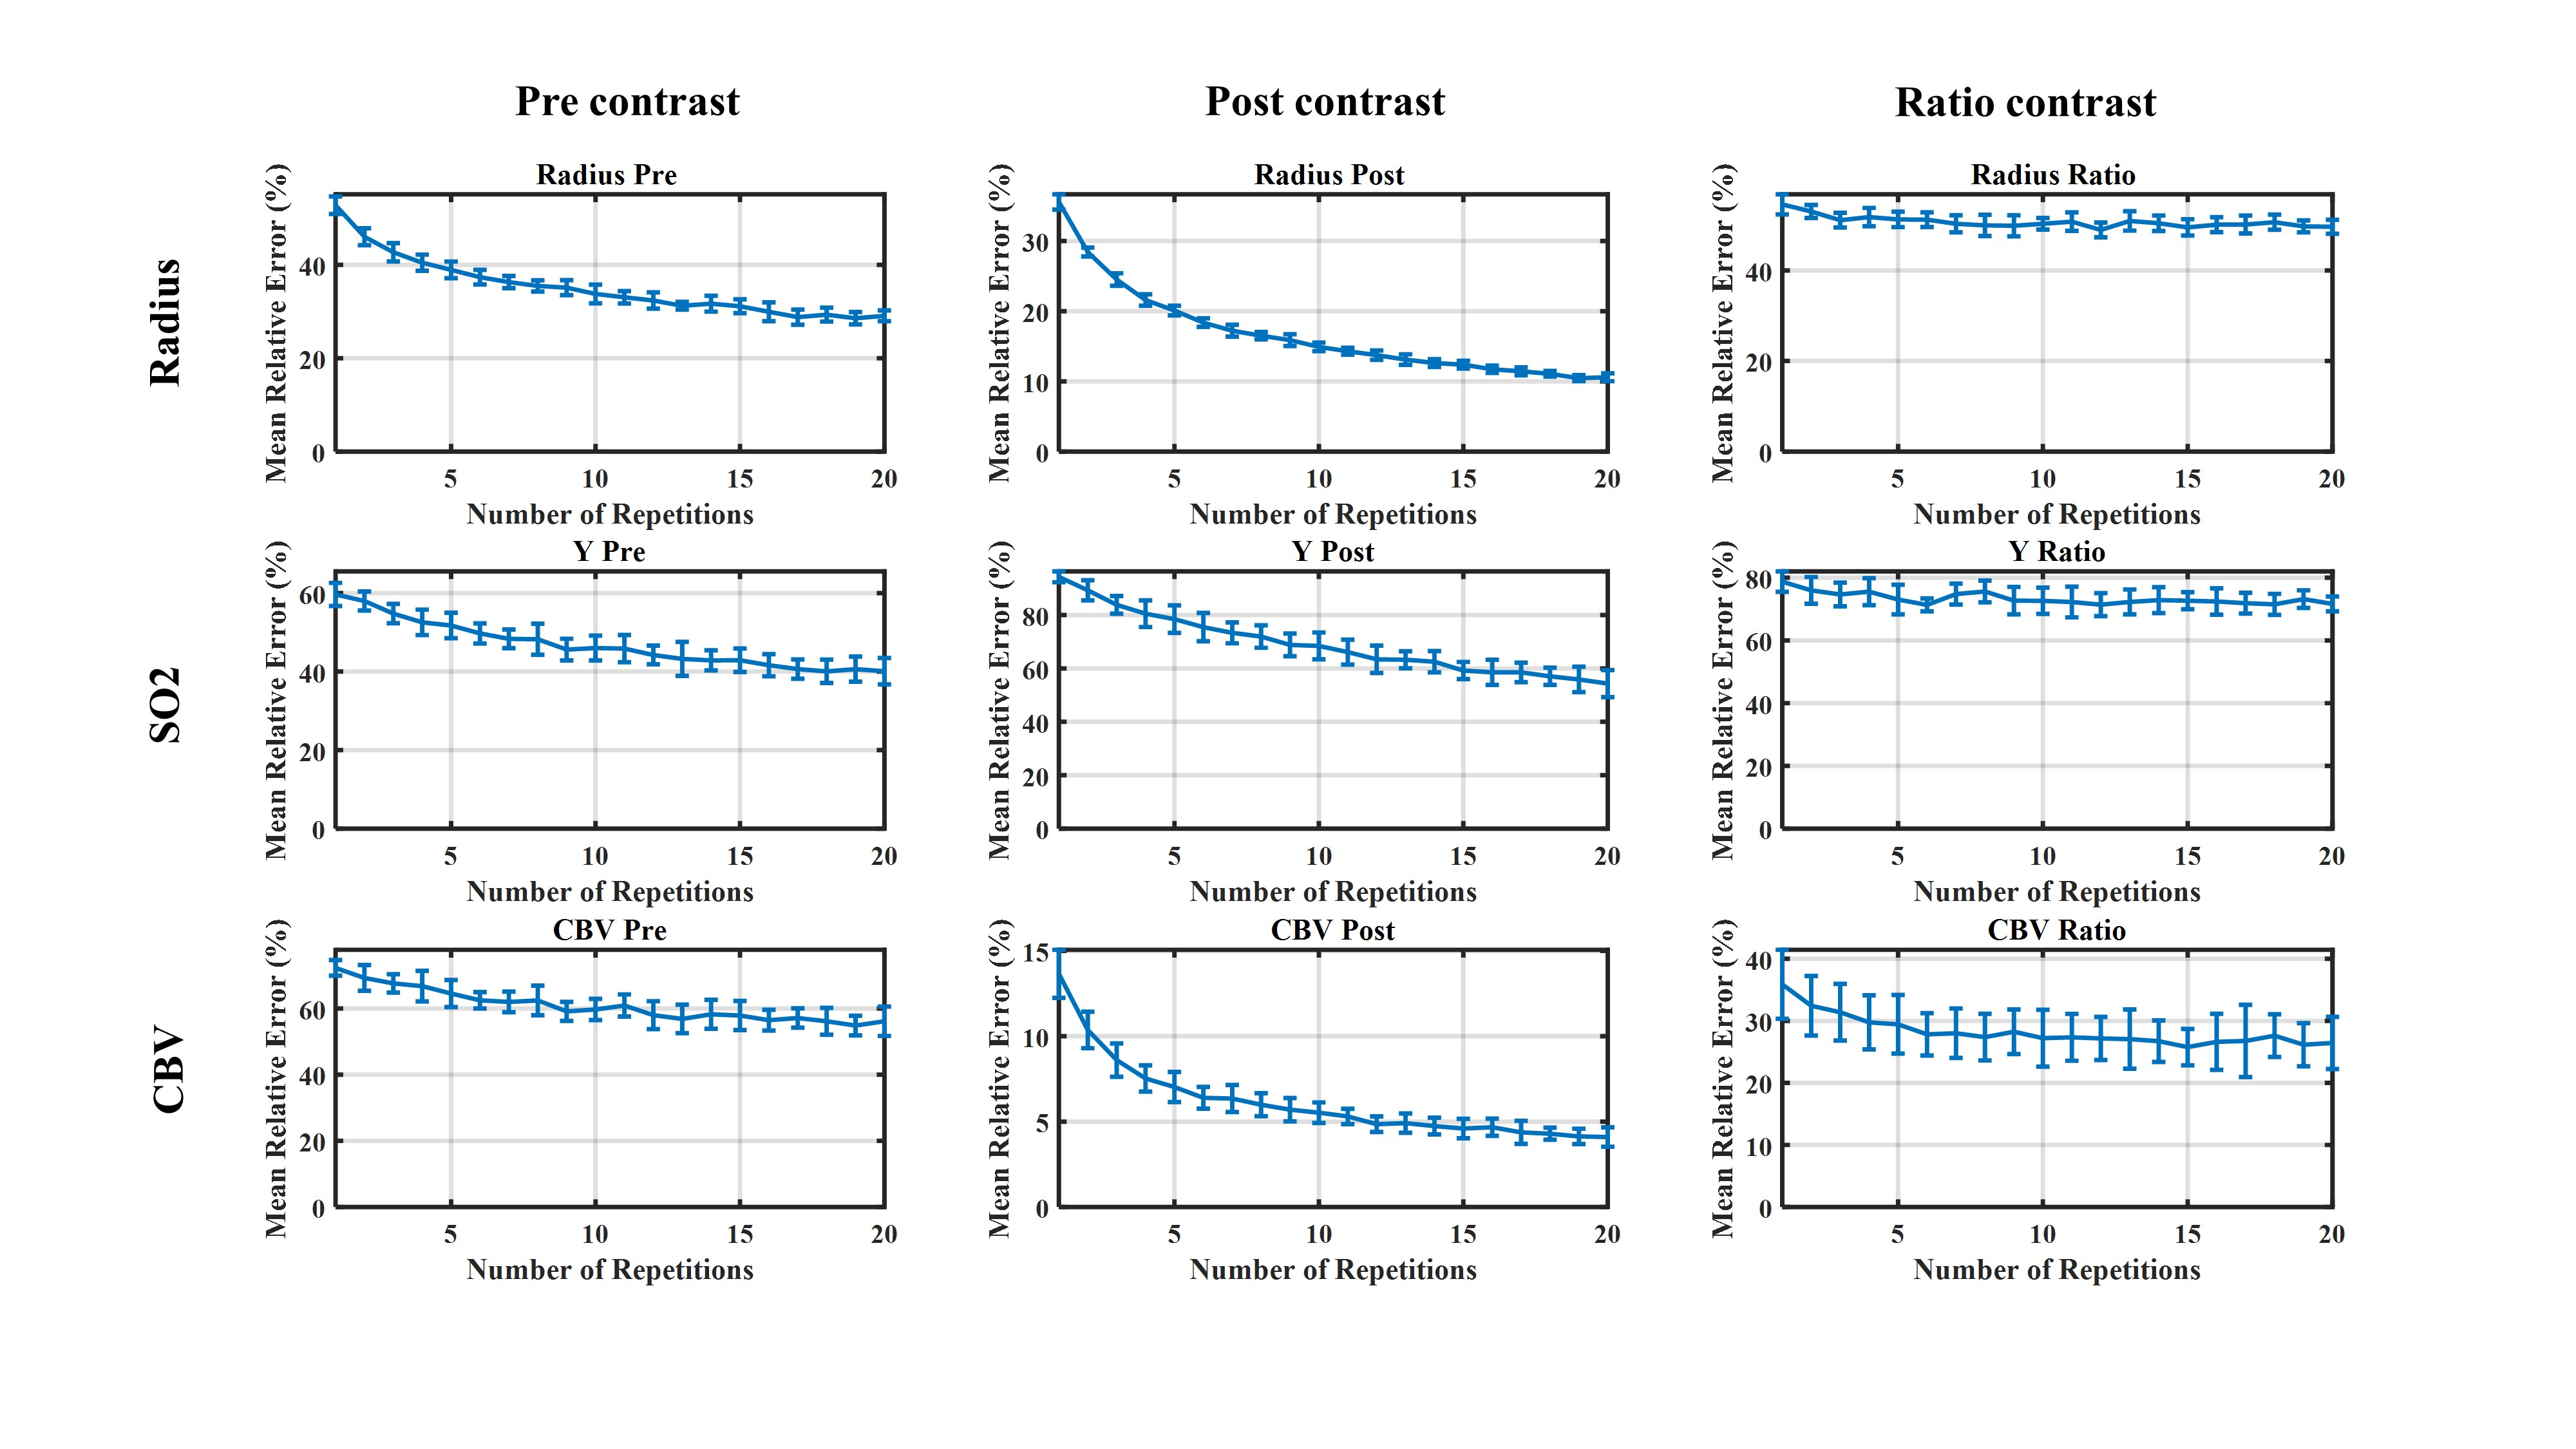
Here we showed that the error in parameter estimates for MRvF using GESFIDE is higher than previously assumed. In addition to that, at least in several cases, there seem to be little benefit in acquiring many echoes since even far fewer echoes give us almost the same end results. The importance of these findings is that it implies that potentially faster readouts with possibly repeating the acquisition can be used to increase the accuracy of the parameter estimates. Figure 5 examines this idea by showing that this is indeed the case and repeated measurements may be the solution to increase the accuracy.
In conclusion, based on these results, repeating the MRvF with fewer echo times using faster readouts can lead to increased accuracy to the point that it can even open up the possibility of removing the contrast agent, making MRvF far more attractive in the future studies.
Acknowledgements
We thank the Canadian Institutes for Health Research (CIHR) for funding support.References
1. Ma D, Gulani V, Seiberlich N, et al. Magnetic resonance fingerprinting. Nature 2013;495:187–192.
2. Christen T, Pannetier NA, Ni WW, et al. MR vascular fingerprinting: A new approach to compute cerebral blood volume, mean vessel radius, and oxygenation maps in the human brain. Neuroimage 2014;89:262–270.
3. Lemasson B, Pannetier N, Coquery N, et al. MR vascular fingerprinting in stroke and brain tumors models. Sci. Rep. 2016;6:1–11.
4. Pouliot P, Gagnon L, Lam T, et al. Magnetic resonance fingerprinting based on realistic vasculature in mice. Neuroimage 2017;149:436–445.
5. Thomas Christen, Wendi W. Ni, Jia Guo, Audrey P. Fan, Michael M. Moseley, and Greg Zaharchuk. MR Vascular Fingerprinting during Gas Challenges. In: ISMRM Proceedings 2018. ; p. 0678.
6. Khajehim M, Nasiraei Moghaddam A. Investigating the spatial specificity of S2-SSFP fMRI: A Monte Carlo simulation approach. Magn. Reson. Imaging 2017;37:282–289.
Figures