0810
Simultaneous Pseudo-CT and Parametric Mapping of Human Brain Using Dual Echo Ultrashort Echo Time MR Fingerprinting (deUTE-MRF)1Center for Brain Imaging Science and Technology, Key Laboratory for Biomedical Engineering of Ministry of Education, College of Biomedical Engineering and Instrumental Science, Zhejiang University, Hangzhou, China, 2State Key Laboratory of Modern Optical Instrumentation, College of Optical Science and Engineering, Zhejiang University, Hangzhou, China, 3Department of Imaging Sciences, University of Rochester, Rochester, NY, United States
Synopsis
A dual echo ultrashort echo time MR fingerprinting (deUTE-MRF) sequence is proposed to simultaneously generate
Introduction
Determination of bone structure is indispensable in PET/MRI for attenuation correction 1. Besides multi-modality images acquired from PET/MRI, MRI can also produce pseudo-CT images for PET attenuation correction using ultrashort TE (UTE) or zero TE (ZTE) techniques 2-3. MR fingerprinting (MRF) has been used to obtain multiple quantitative maps efficiently in a single scan 4. In conjunction with MRF technique, we proposed a dual echo ultrashort TE MRF (deUTE-MRF) method to simultaneously quantify brain and generate pseudo-CT image.Methods
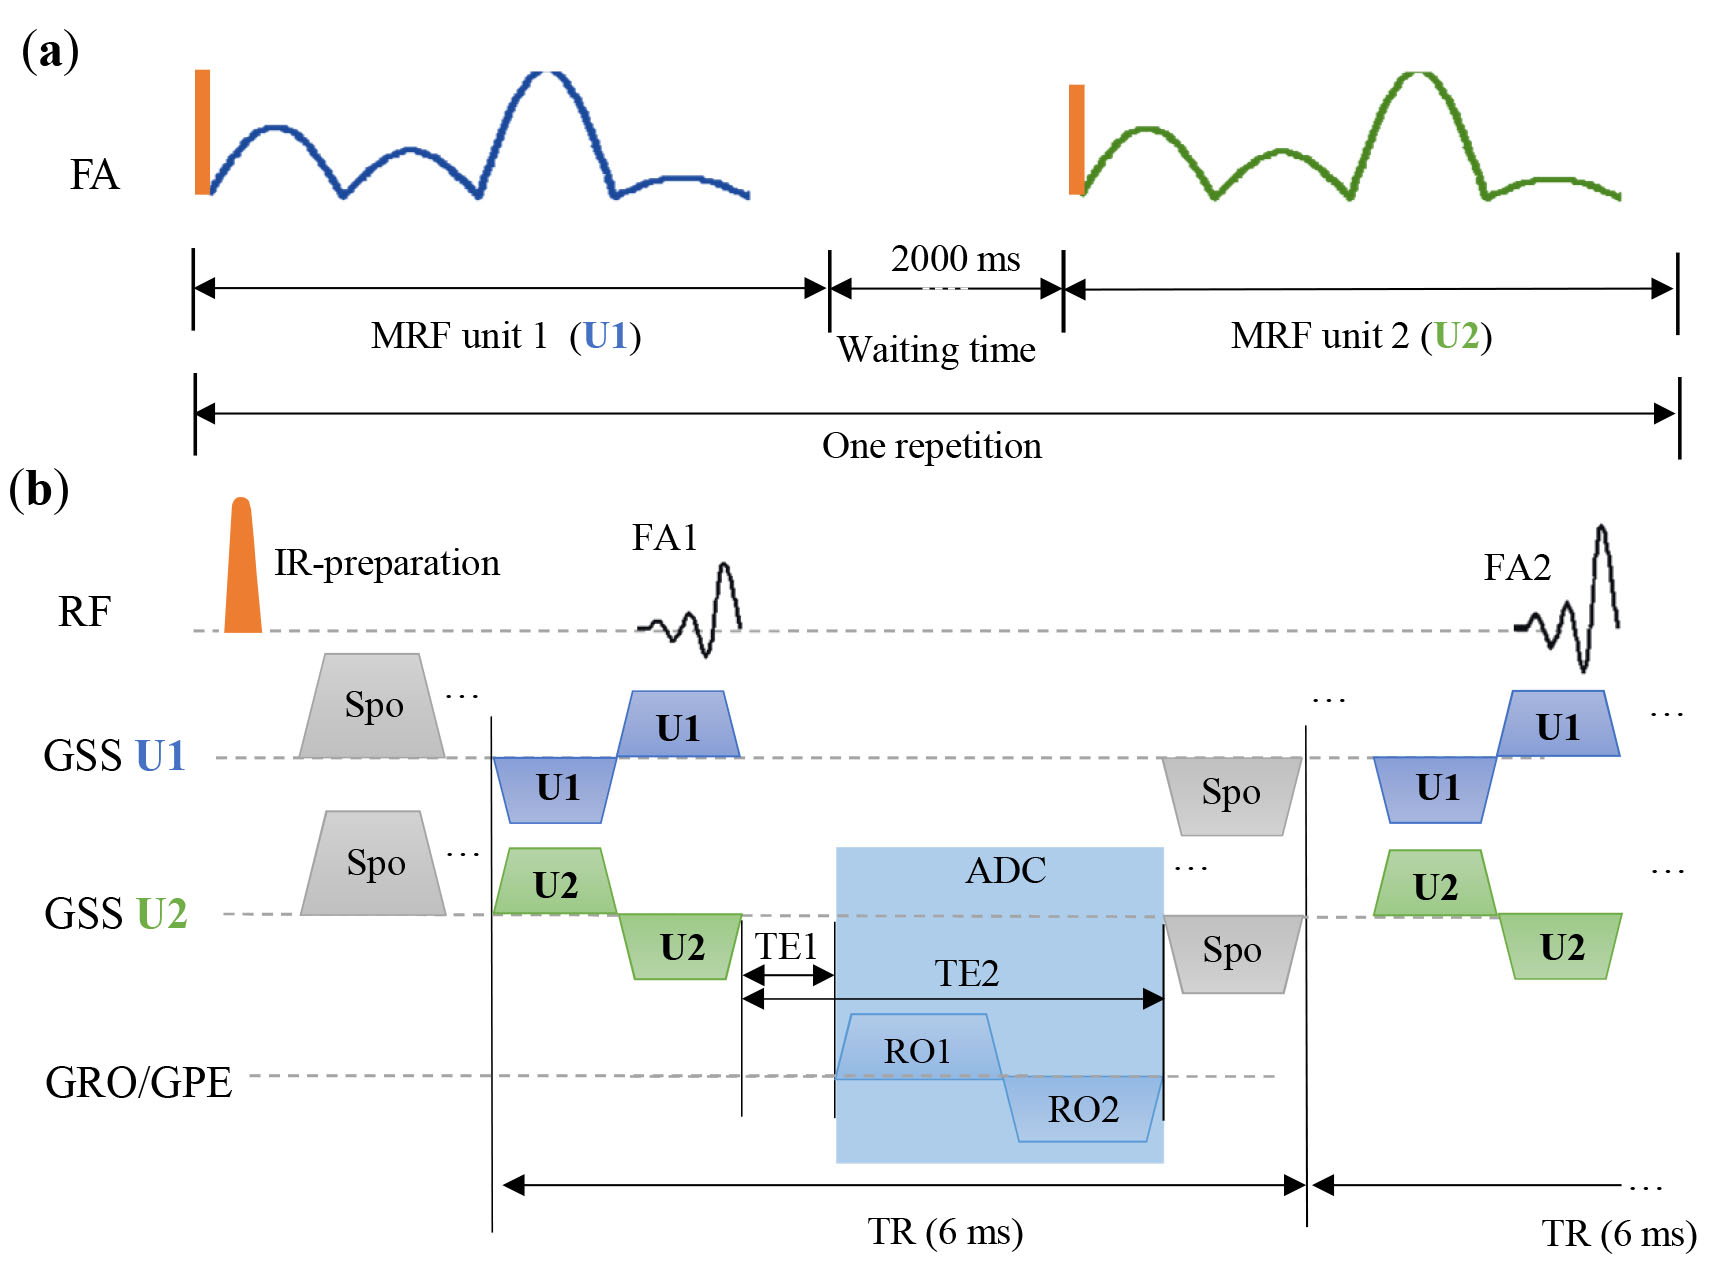
A fast imaging with steady state precession (FISP) MRF framework was implemented using a 2D UTE sequence with half pulse excitation and bipolar half spoke radial readout. The sequence diagram is shown in Fig. 1. A single deUTE-MRF repetition contained 2 MRF units, in which only the polarization of slice selection gradients was reversed. Flip angle (FA) changed from 5° to 60°, TE1 = 0.05 ms and TE2 = 1.88 ms, slice thickness = 6 mm. TR was fixed at 6 ms to increase scan efficiency. Each MRF unit acquired 480 image frames (TRs) and radial spokes were rotated in a small golden angle of 23.62° 5. Partial recovery of longitudinal magnetizations was achieved via a 2000 ms waiting time between MRF units. Experiments were conducted on a Siemens 3T Prisma with a 20 channel head coil. Images were reconstructed into a 256 x 256 matrix under the resolution of 0.75 x 0.75 mm2 using NUFFT 6. A sliding-window method 7 was employed before MRF dictionary matching to reduce strong undersampling aliasing in radial images.
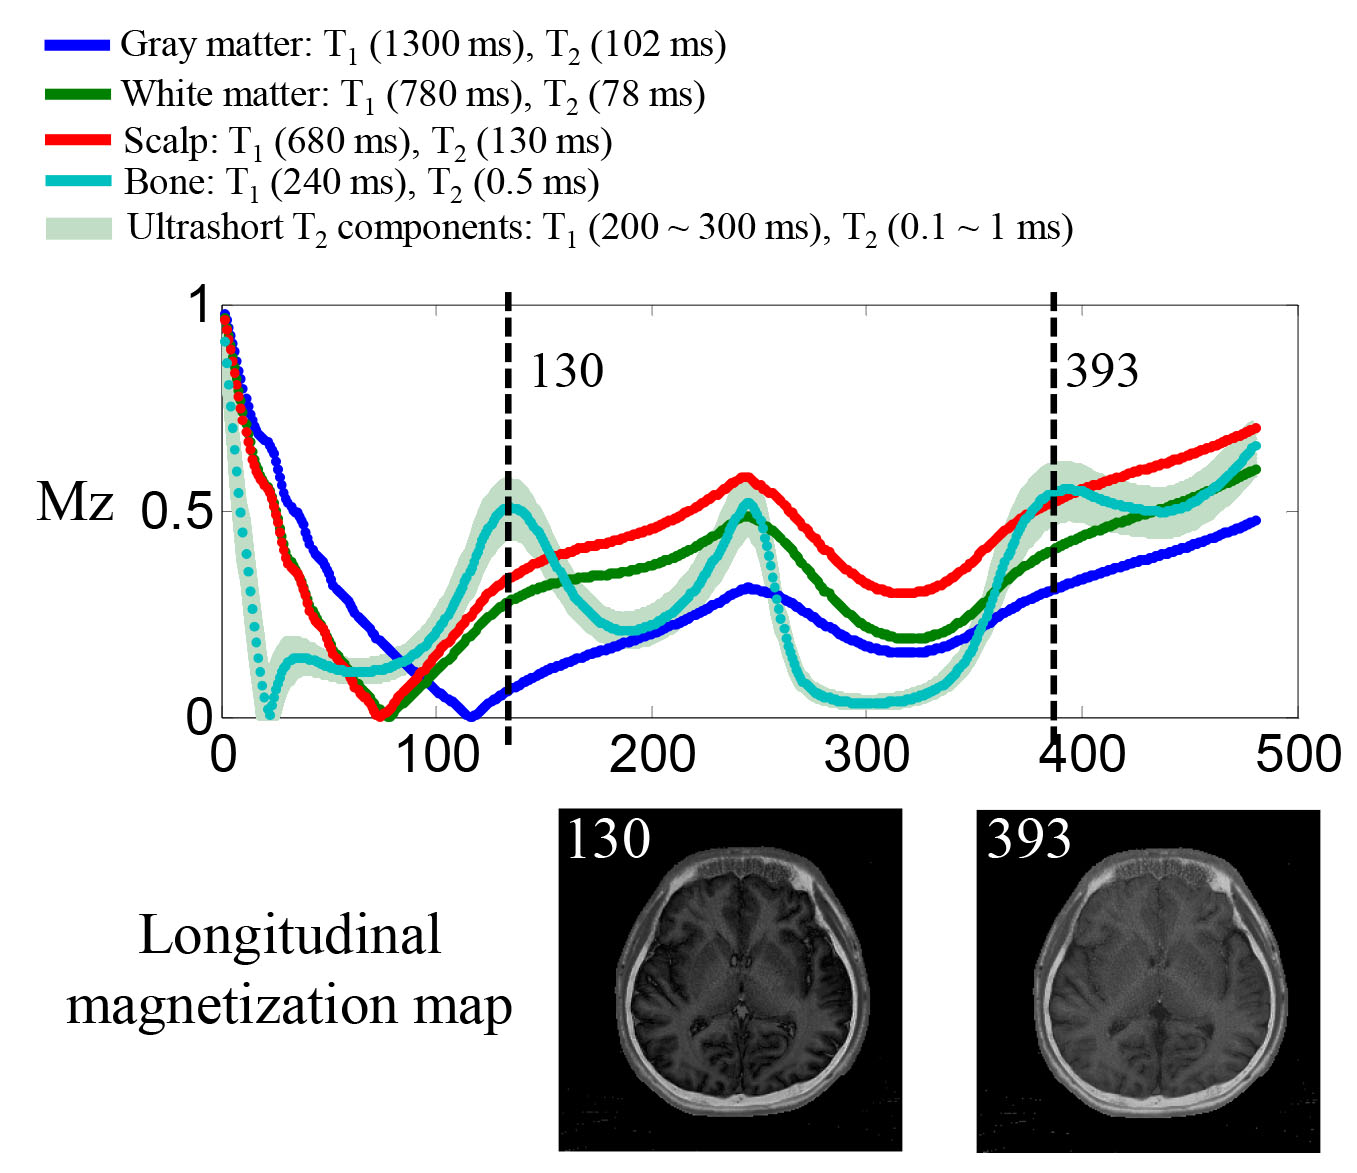
Since adiabatic inversion recovery (IR) pulse was applied, MRF possessed an intrinsic advantage in long T2 suppression near white / gray matter IR-null point. Longitudinal magnetization changes were simulated and shown in Fig. 2 based on imaging parameters and tissue relaxometries using EPG 8. For simplicity, relaxations during excitation and acquisition were ignored for bone and ultrashort T2 components. Since T1 and T2 maps were first calculated through MRF dictionary matching, transverse and longitudinal magnetization maps at any MRF frame could be generated via looking up the dictionary. Herein, longitudinal magnetization (Mz) maps from frame No. 130 and 393 were displayed at the bottom of Fig. 2, where the bone was highlighted. To further suppress long T2 gray matter, white matter, and scalp, the Mz map was divided by T1 map to emphasize the bone which has the shortest T1.
Results
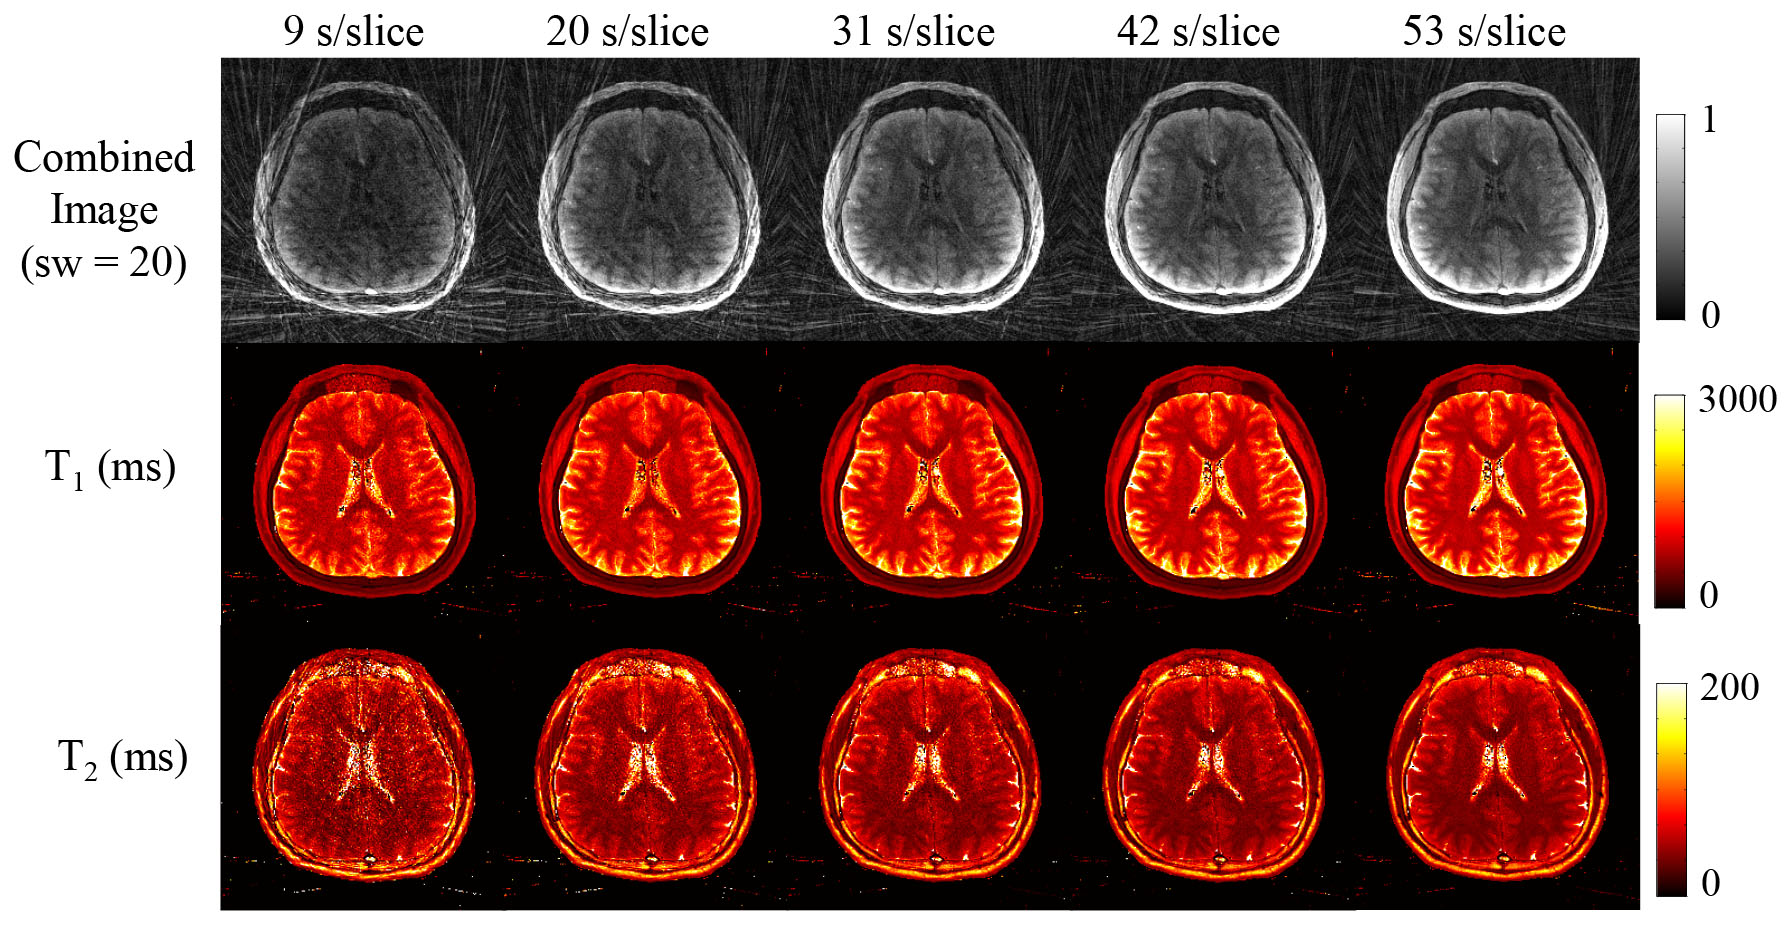
Fig. 3 shows the results of echo 1 using an increased number of deUTE-MRF repetitions from 1 to 5 under the sliding-window size of 20. T1 maps are of higher SNR than T2 maps even with a single repetition.
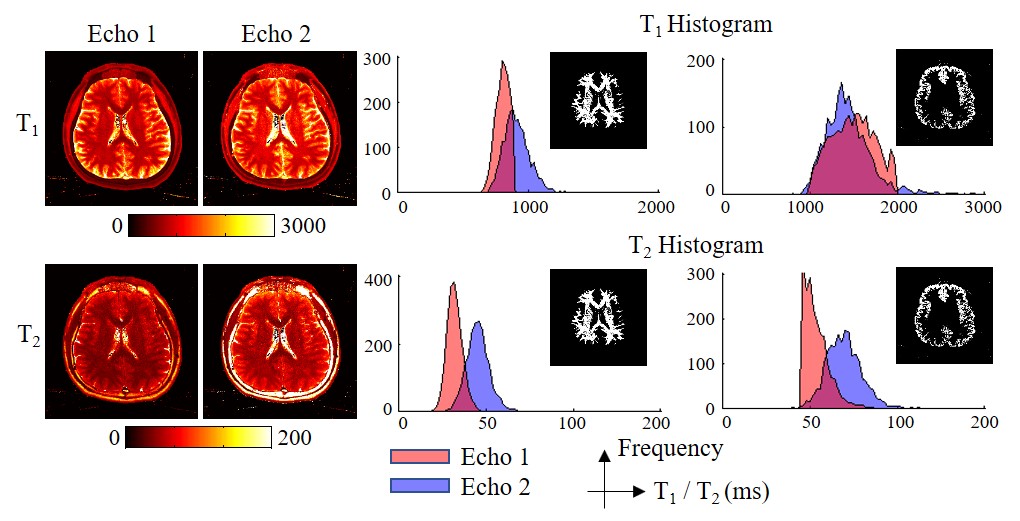
Fig. 4 (left side) shows the T1 and T2 maps reconstructed from echo 1 and echo 2, respectively. Overall, echo 1 shows shift to lower values than echo 2, especially in white matter, likely due to shorter T2 components. The T1 and T2 histograms on the right side show the statistic differences between echo 1 and echo 2 at white matter and gray matter.
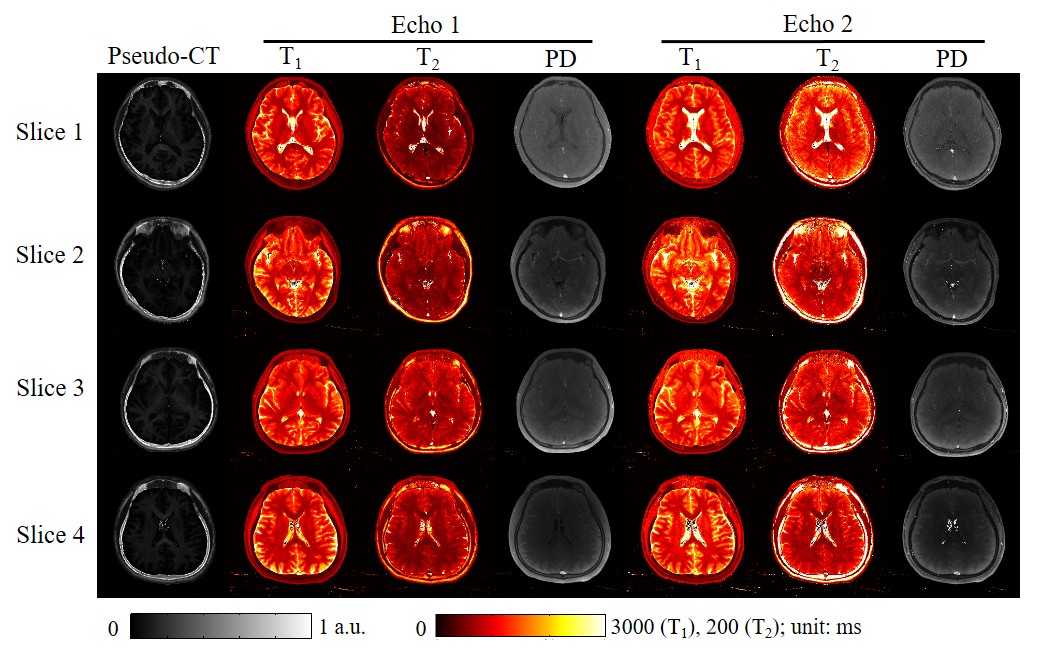
Fig. 5 shows pseudo-CT images, T1, T2, and PD maps from 3 healthy volunteers with 5 deUTE-MRF repetitions.
Discussion
UTE-MRF was first proposed to quantify cortical bone and muscle with sinusoidal TE variations 9. To maximize the SNR of bone, TE1 is minimized to 0.05 ms in deUTE-MRF. With adiabatic IR pulse and ultrashort TE, deUTE-MRF produces accurate T1 quantification of brain including bone and soft tissues. To avoid the T2 and T2* impact in transverse magnetization, morphological image of bone is generated from longitudinal magnetization map (fully depended on T1). To suppress soft tissues, longitudinal magnetization map near white and gray matter IR-null point is chosen and divided by the T1 map.
Since ultrashort T2 signal of brain are acquired using deUTE-MRF, the first echo (TE = 0.05 ms) shows shorter T1 and T2 values than the second echo (TE = 1.88 ms) in Fig. 4. This phenomenon observed in our work is in agreement with the previous studies that have demonstrated myelin membranes contribute to the ultrashort T2 component in white matter 10-11. The T1 and T2 differences between echo 1 and echo 2 in gray matter could be possibly due to membranous structures in gray matter 11, partial volume effect, or both.
Conclusion
We have demonstrated a dual echo UTE-MRF (deUTE-MRF) method to simultaneously obtain high resolution pseudo-CT image and parametric maps of brain, which could complement multi-modality PET/MRI brain studies.Acknowledgements
This work was supported by National Key R&D Program of China (2017YFC0909200), NSFC (81871428, 91632109) and Shanghai Key Laboratory of Psychotic Disorders(13dz2260500).References
[1]. Hofmann M, Pichler B, Schölkopf B, et al. Towards quantitative PET/MRI: a review of MR-based attenuation correction techniques[J]. European journal of nuclear medicine and molecular imaging, 2009, 36(1): 93-104.
[2]. Keereman V, Fierens Y, Broux T, et al. MRI-based attenuation correction for PET/MRI using ultrashort echo time sequences[J]. Journal of nuclear medicine, 2010, 51(5): 812.
[3]. Delso G, Wiesinger F, Sacolick L I, et al. Clinical evaluation of zero-echo-time MR imaging for the segmentation of the skull[J]. J Nucl med, 2015, 56(3): 417-22.
[4]. Ma D, Gulani V, Seiberlich N, Liu K, Sunshine JL, Duerk JL, Griswold MA. Magnetic resonance fingerprinting. Nature 2013;495(7440):187-192.
[5]. Wundrak S, Paul J, Ulrici J, Hell E, Rasche V. A small surrogate for the golden angle in time-resolved radial MRI based on generalized fibonacci sequences. IEEE Trans. Med. Imaging 2015;34:1262–1269.
[6]. Fessler JA, Sutton BP. Nonuniform fast Fourier transforms using min-max interpolation. IEEE Trans. Signal Process. 2003;51:560-574.
[7]. Cao X, Liao C, Wang Z, Chen Y, Ye H, He H, Zhong J. Robust sliding-window reconstruction for Accelerating the acquisition of MR fingerprinting. Magn. Reson. Med. 2017; 78(4): 1579–1588.
[8]. Weigel M. Extended phase graphs: dephasing, RF pulses, and echoes‐pure and simple. J. Magn. Reson. Imaging. 2015; 41(2): 266-295.
[9]. Li Q, Cao X, Ye H, Liao C, He H, Zhong J. Quantification of long and ultra-short relaxation times in tissues with ultra-short TE MR fingerprinting (UTE-MRF). In Proceedings of the 26th Annual Meeting of ISMRM, Paris, 2018. Abstract 680.
[10]. Horch R A, Gore J C, Does M D. Origins of the ultrashort‐T2 1H NMR signals in myelinated nerve: a direct measure of myelin content?[J]. Magnetic resonance in medicine, 2011, 66(1): 24-31.
[11]. Fan S J, Ma Y, Chang E Y, et al. Inversion recovery ultrashort echo time imaging of ultrashort T2 tissue components in ovine brain at 3 T: a sequential D2O exchange study[J]. NMR in Biomedicine, 2017, 30(10): e3767.
Figures