0809
In Vivo Multi-Color Magnetic Resonance Fingerprinting1Biomedical Engineering, Case Western Reserve University, Cleveland, OH, United States, 2Radiology, Case Western Reserve University, Cleveland, OH, United States, 3Molecular Biology and Microbiology, Case Western Reserve University, Cleveland, OH, United States, 4NanoEngineering, University of California-San Diego, La Jolla, CA, United States, 5Radiology, University of California-San Diego, La Jolla, CA, United States, 6Neurosciences, Case Western Reserve University, Cleveland, OH, United States, 7Physiology and Biophysics, Case Western Reserve University, Cleveland, OH, United States, 8Pediatrics, Case Western Reserve University, Cleveland, OH, United States
Synopsis
Contrast enhanced MRI studies are currently limited to observing a single contrast agent at a time. Meanwhile, optical imaging methods frequently utilize multiple fluorophores in “multi-color” imaging studies to track multiple molecular events simultaneously. We propose the novel DC-MRF method as a way to realize an analagous “multi-color” MRI. Herein, we demonstrate the first in vivo application of multi-color MRF and validate its ability to accurately and dynamically map the concentration of multiple contrast agents in vivo. This method creates the opportunity to perform a wide range of novel multi-agent MRI studies that immediately broadens the scope of contrast enhanced MRI.
Purpose
Preclinical optical imaging studies routinely use multiple fluorophores (e.g., red and green fluorescence) simultaneously to detect multiple molecular events in vivo with high specificity. For example, two imaging agents with different fluorophores could be used to simultaneously monitor drug delivery (e.g., theranostic agent) and therapeutic efficacy (e.g., apoptosis). Alternatively, two contrast agents could be used to simultaneously assess blood flow and vascular permeability by combining a blood pool agent and an extravascular agent. Unfortunately, there are no analogous in vivo “multi-color” MRI methods that combine the advantages of MRI and the benefits of simultaneously detecting two different molecular events. Dual-Contrast Magnetic Resonance Fingerprinting (DC-MRF)1 is an option for realizing multi-color MRI. This method accurately measured the concentration of multiple contrast agents present together in solution using quantitative MRI and a multi-agent relaxivity model:
Equation 1: $$$\frac{1}{T_1}=\frac{1}{T_1{_0}}+r_1{_A}\times[A]+r_1{_B}\times[B]$$$
Equation 1: $$$\frac{1}{T_2}=\frac{1}{T_2{_0}}+r_2{_A}\times[A]+r_2{_B}\times[B]$$$
In the prior work gadolinium and manganese contrast agent concentrations were accurately measured in vitro as mixtures and as single agent solutions. Herein, we present the first in vivo “multi-color” MRF study and show that DC-MRF can be used to accurately, dynamically, and simultaneously map the intratumoral concentration of gadolinium and dysprosium chelates in a mouse glioma model.
Methods
Dynamic T1 and T2 mapping was performed via MRF on a 9.4T Bruker Biospec small animal MRI scanner using a fast imaging with steady-state free precession (FISP) imaging kernel and an undersampled spiral trajectory3. Both maps were acquired simultaneously with a temporal resolution of ~2 minutes. Initially, mice bearing LN-229 flank tumors were scanned before and after administration of either a gadolinium contrast agent (Gd-BOPTA, dose range = 0.1-0.4 mg/kg, n=14) or a dysprosium contrast agent (Dy-DOTA-azide, dose range = 0.3-1.3, n=17) to estimate the in vivo relaxivity (r1, r2) of each agent. Ten pre-contrast MRF scans were acquired to establish baseline T10 and T20 values and ten post-contrast MRF scans were acquired to track dynamic T1 and T2 contrast enhancement. A second cohort of mice was injected with both agents simultaneously as a mixture to validate the ability of DC-MRF to measure the concentration of two contrast agents injected simultaneously (dose range: Gd 0.15 – 0.30 mmol/kg, Dy 0.30 – 1.10 mmol/kg, n=8). Finally, one mouse received a serial injection of dysprosium followed by gadolinium after a 10-minute delay. Gadolinium and dysprosium concentration maps were calculated for each imaging timepoint using Equations 1 and 2 and the previously-estimated in vivo relaxivities. After each imaging experiment, flank tumors were immediately excised and the Gd and Dy concentration in each tumor was measured using gold-standard inductively couple plasma - mass spectrometry (ICP-MS).Results
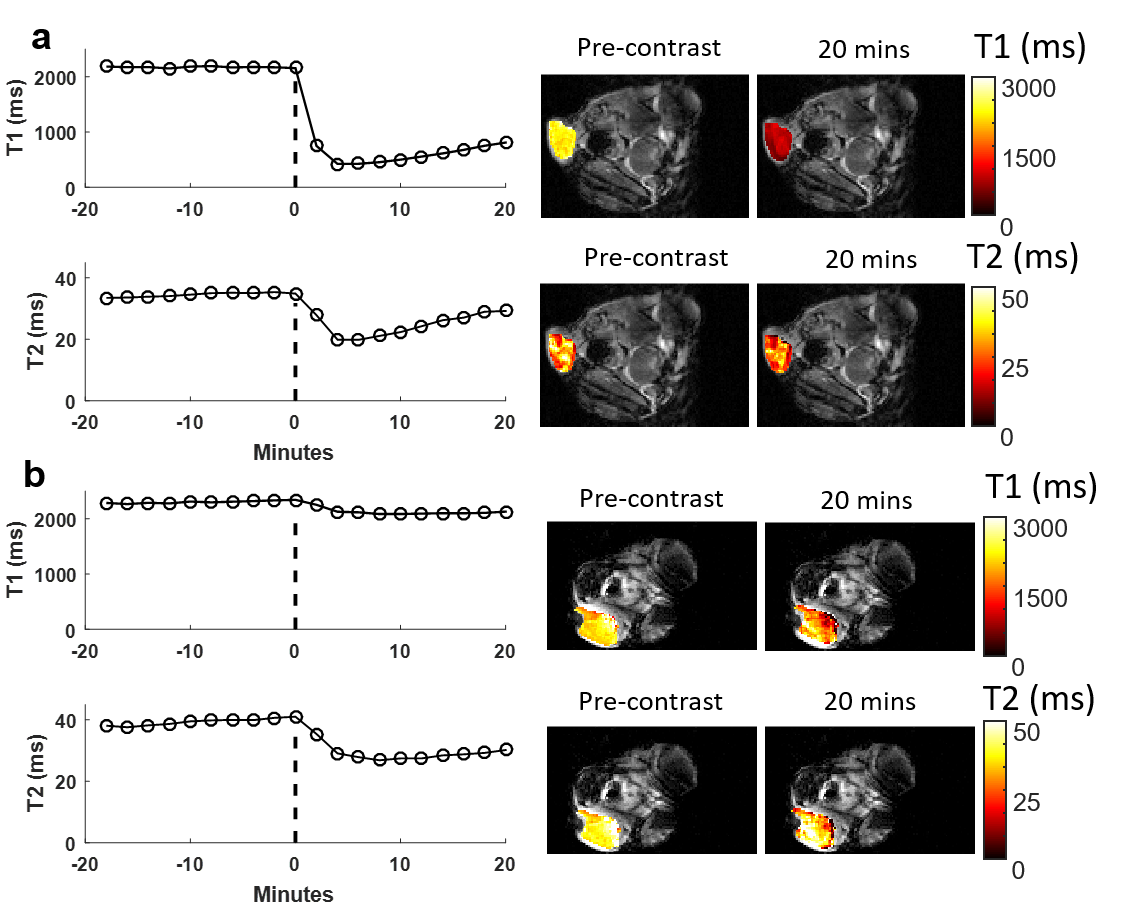
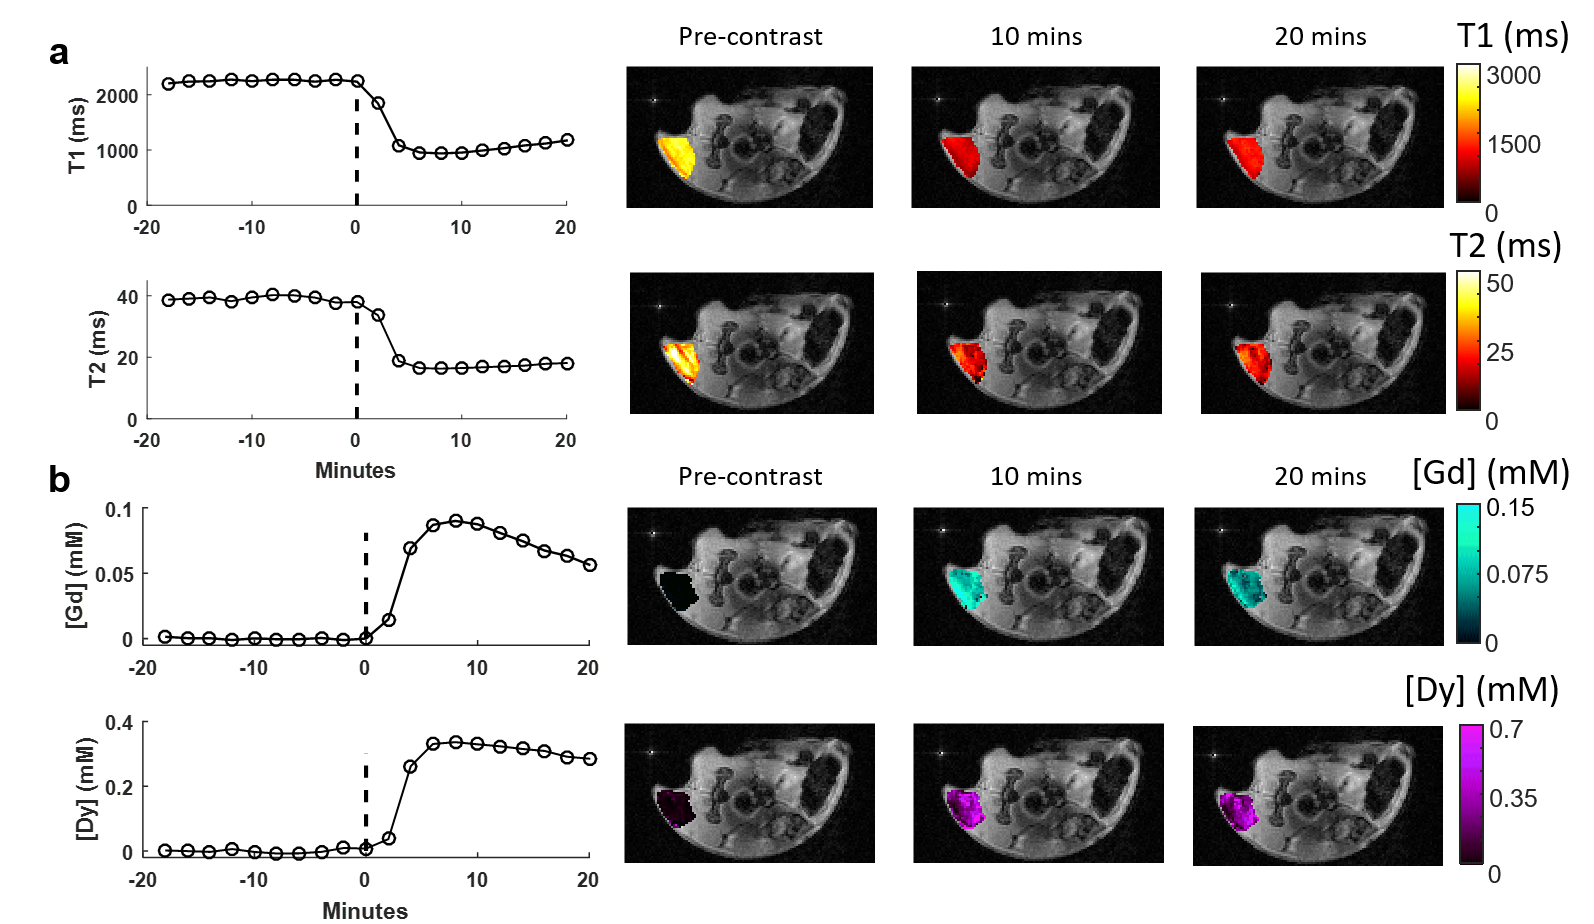
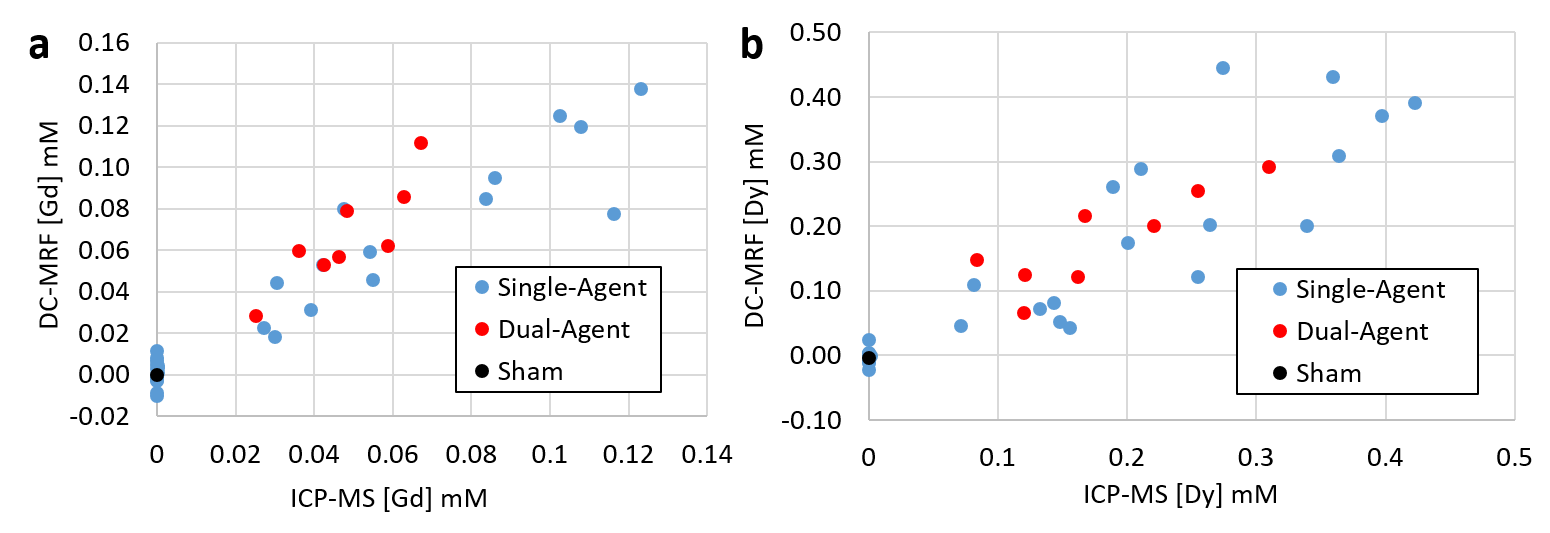
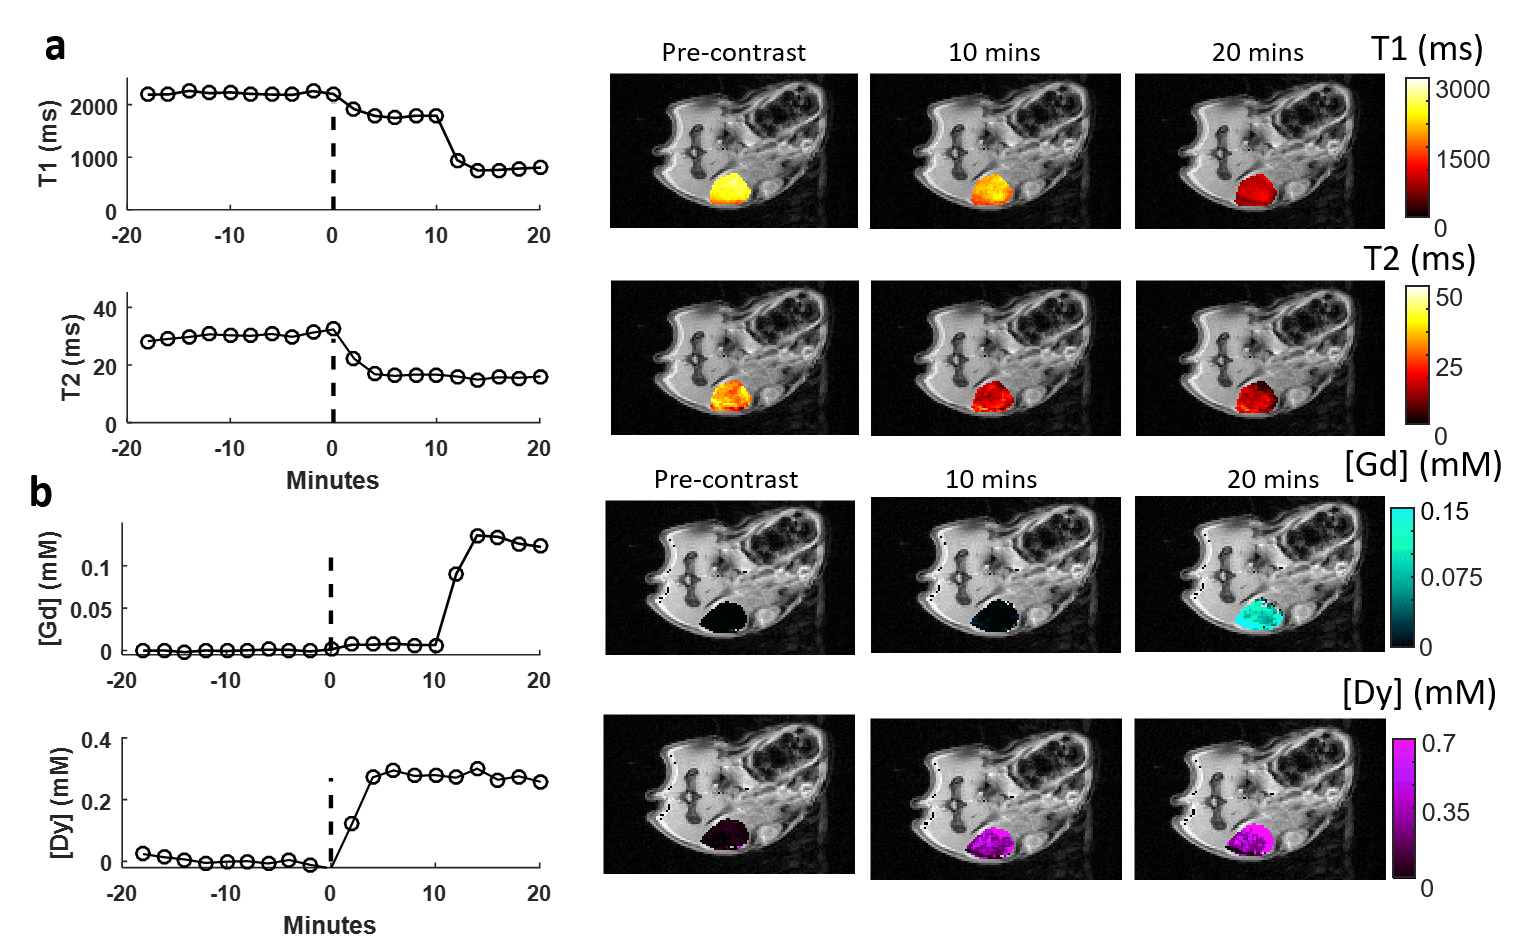
Representative MRF-based T1 and T2 relaxation time curves and pseudo-colored maps show that both contrast agents resulted in detectable reductions of both T1 and T2 relaxation times (Figure 1). A linear least-squares regression of the mean tumor T1 and T2 enhancement (ΔR1 and ΔR2) immediately preceding tumor excision (20th MRF scan) with ICP-MS measured Gd and Dy concentration resulted in in vivo magnetic relaxivity estimates of: Gd-BOPTA, r1 = 5.63 L/mmol/sec, r2 = 37.1 L/mmol/sec; Dy-DOTA-azide, r1 = 0.249 L/mmol/sec, r2 = 93.6 L/mmol/sec (R2>0.65) (Figure 2). Injection of both agents simultaneously resulted in simultaneous T1 and T2 enhancement as seen in representative datasets in Figure 3A. Representative Gd and Dy concentration time curves and maps demonstrate increased agent concentration following injection (Figure 3B). Comparison of DC-MRF and ICP-MS concentration measurements for all mice (n=40, Figure 4) showed that DC-MRF measurements correlated well with ICP-MS measurements (R2>0.83). Concentration measurements following serial injection of the two agents (Dy and Gd injections separated by 10 minutes) showed that the concentration estimates provided by DC-MRF are independently determined for each agent (Figure 5).Discussion and Conclusions
This study demonstrates, for the first time, in vivo multi-color imaging using DC-MRF. Dynamic MRF-based quantification of T1 and T2 allowed accurate mapping of absolute agent concentration, regardless of if the agents were injected simultaneously or in series. Importantly, DC-MRF independently measures the absolute concentration of each agent and only requires that the pair of agents have different ratios of their magnetic relaxivities. While this initial in vivo study focused on conventional MRI contrast agents, virtually any novel paramagnetic MRI contrast agent/sensor could be studied creating a highly versatile multi-color MRI methodology appropriate for a wide range of in vivo studies.Acknowledgements
R21 HL130839, F30 HL136190, Cancer Imaging Program of the Case Comprehensive Cancer Center (P30 043703), T32 EB007509, T32 GM007250, Joseph G. Lawrence, PhD and Gazelle Vaseghi at the University of Toledo Center for Materials and Sensor CharacterizationReferences
1. Anderson, C. E. et al. Dual Contrast - Magnetic Resonance Fingerprinting (DC-MRF): A platform for simultaneous quantification of multiple MRI contrast agents. Sci. Rep. 7, 8431 (2017).
2. Ma, D. et al. Magnetic Resonance Fingerprinting. Nature 495, 187–192 (2013).
3. Gu, Y. et al. Fast Magnetic Resonance Fingerprinting for dynamic contrast-enhanced studies in mice. Magn. Reson. Med. 80, 2681–2690 (2018).
Figures