0804
Feasibility of Thermo-Acoustic Ultrasound for Non-invasive Monitoring of Temperature at Lead Tips During MRI1Electrical Engineering, Stanford University, Stanford, CA, United States
Synopsis
The amplification of local SAR at device lead tips that causes RF-induced heating has previously been shown to be detectable using thermo-acoustic ultrasound (TAUS). Due to the temperature dependence of the thermal expansion coefficient in tissue, the thermo-acoustic pressure generated at a lead tip is a function of the temperature at the lead tip. By observing how the TAUS signal amplitude changes over time, real-time tracking of lead tip temperature during an MRI scan should be possible. Here, we experimentally demonstrate the temperature-dependence of the TAUS signal, showing the feasibility of TAUS for temperature monitoring at lead tips during MRI.
Introduction
RF-induced heating near the lead tips of implanted medical devices is a safety concern for patients undergoing MRI scans.1,2 Coupling between the RF transmit and a conductive device lead can create a significant temperature increase at the lead tip, causing tissue damage.3,4
Previous work has demonstrated that thermo-acoustic ultrasound (TAUS), in which acoustic waves generated by thermal expansion are used to characterize RF power absorption, can detect large peaks in local SAR near lead tips in an MRI setting.5-7 Here, we demonstrate that the temperature dependence of the TAUS signal amplitude also allows for temperature monitoring at lead tips.
Theory
The amplitude of the thermo-acoustic pressure excited in tissue by an RF transmit depends linearly on both the SAR and the tissue's thermal expansion coefficient β. The amplification in local SAR near lead tips creates a large thermo-acoustic pressure there relative to background tissue. Because β is a temperature dependent parameter, the amplitude of the thermo-acoustic pressure will vary with temperature.8-12 With knowledge of how β varies with temperature, the change in temperature at a lead tip can be determined by observing how the TAUS signal amplitude changes.Methods
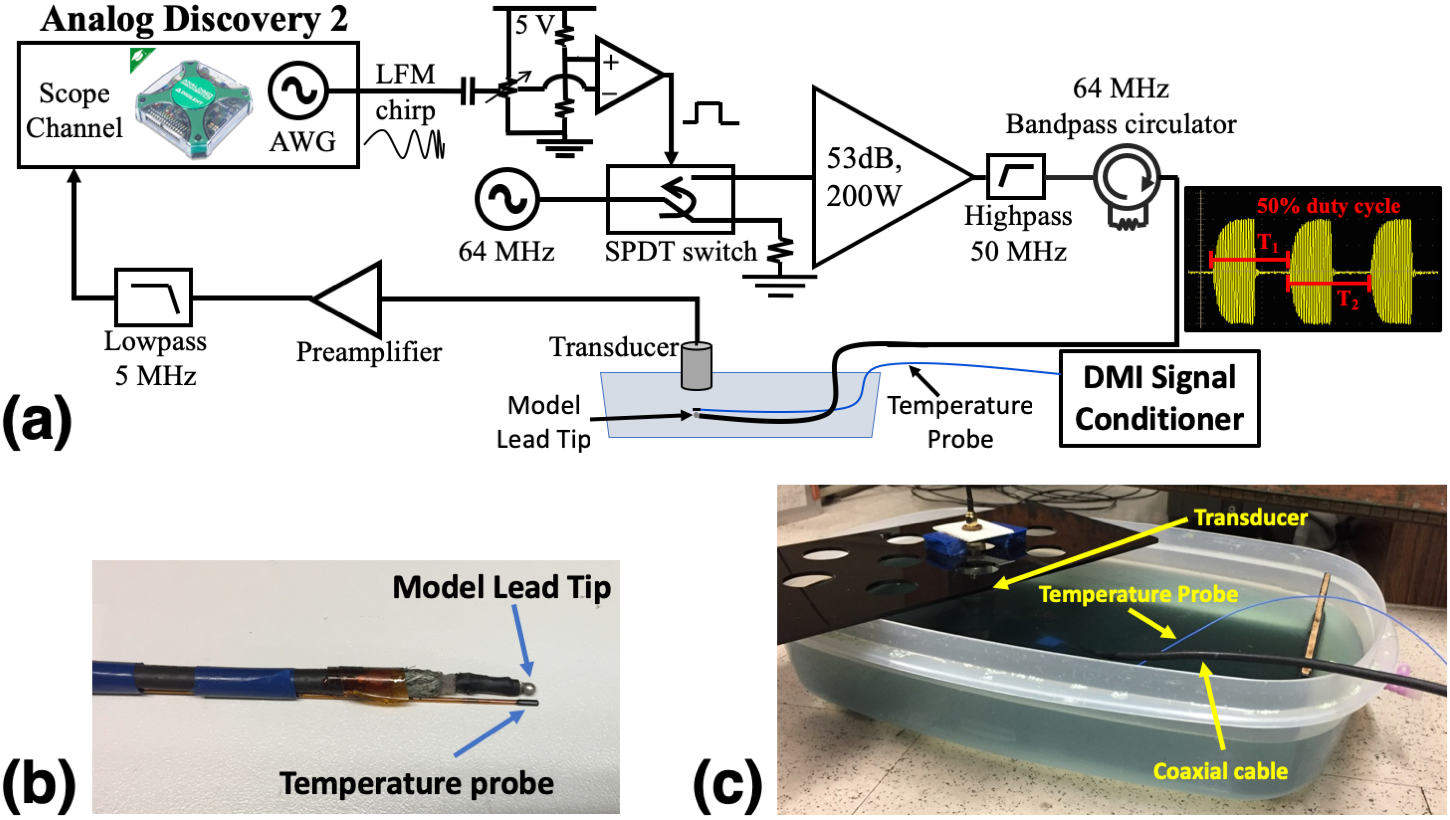
The setup illustrated in Figure 1 was used to simultaneously measure the TAUS signal from a model lead tip and the temperature near that lead tip. To serve as a model lead tip, one end of a coaxial cable was modified so that only a ball of solder electrically connected to the center conductor was exposed. This modified end was placed in a saline gel phantom composed of a mixture of distilled water, 8g/L polyacrylic acid, and 0.7g/L sodium chloride. The cable was directly driven by a 64MHz signal modulated by a chirp, which increased in frequency from 125kHz to 875kHz over a 2ms duration, using the square-wave modulation technique that has been described previously.7
An 0.5MHz immersion ultrasonic transducer (V318-SU, Olympus) was placed in the phantom to receive the TAUS signal. A programmable oscilloscope (Analog Discovery 2, Digilent, Inc.) synchronously transmitted the chirp and gating signals and received the amplified and filtered transducer signal.13 A fiber optic temperature sensor (FOT-L-NS-967C, FISO Technologies Inc.) connected to a signal conditioner (DMI, FISO Technologies Inc.) was secured near the model lead tip.
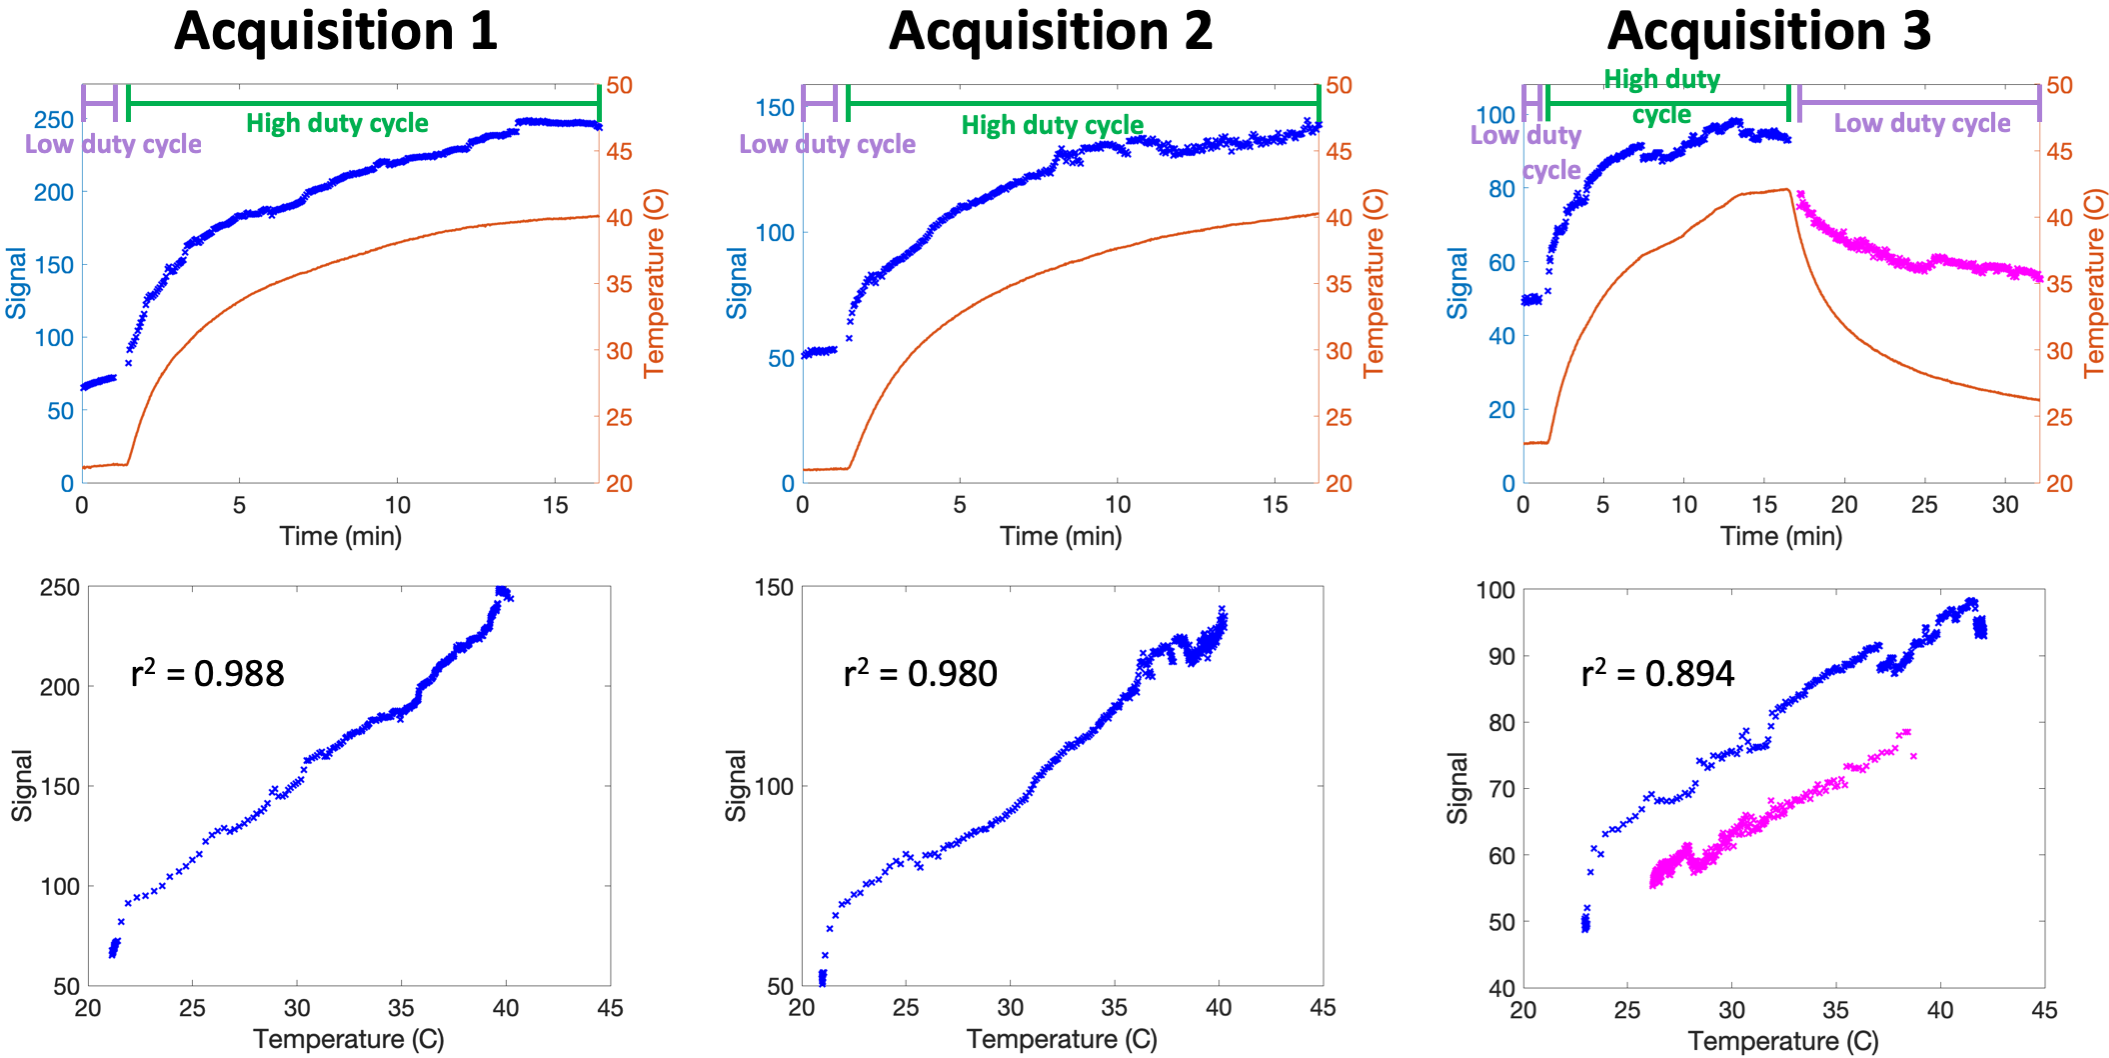
For the first minute of each acquisition, one 2ms signal was transmitted every 1s, resulting in an average transmit power of 0.2W. Soon afterwards, the duty cycle was increased to transmit one 2ms signal every 50ms for 15 minutes, raising the time-averaged transmit power to 4W and creating a notable temperature increase. For one acquisition, the duty cycle was then again decreased back to one 2ms transmit every 1s to perform TAUS signal acquisition during cooling. The received signals were averaged to provide a TAUS measurement every 3s.
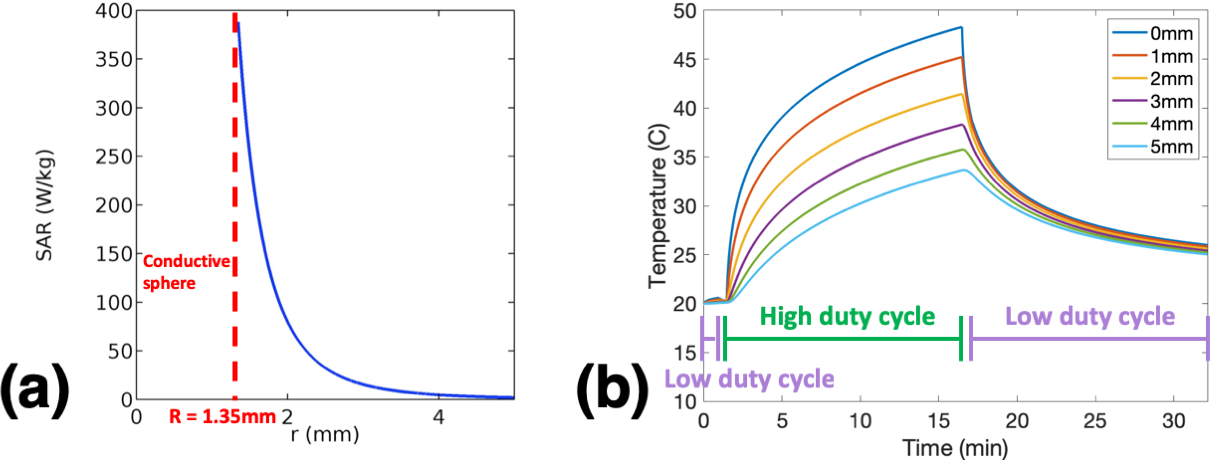
A heat transfer simulation in COMSOL Multiphysics (COMSOL Inc.) was utilized to estimate the temperature distribution throughout the acquisitions. The SAR distribution around the model lead tip was approximated by using the analytic solution for when power is driven into a conductive sphere. A time-averaged power was used to approximate heating during the low and high duty cycle regions, and the power level was scaled so that the simulated temperatures were similar to the experimental observations. The thermal diffusivity of the medium was set to 0.125mm2/s, and a thermal insulation boundary condition was used at the interface between the medium and the conductive sphere.
Results & Discussion
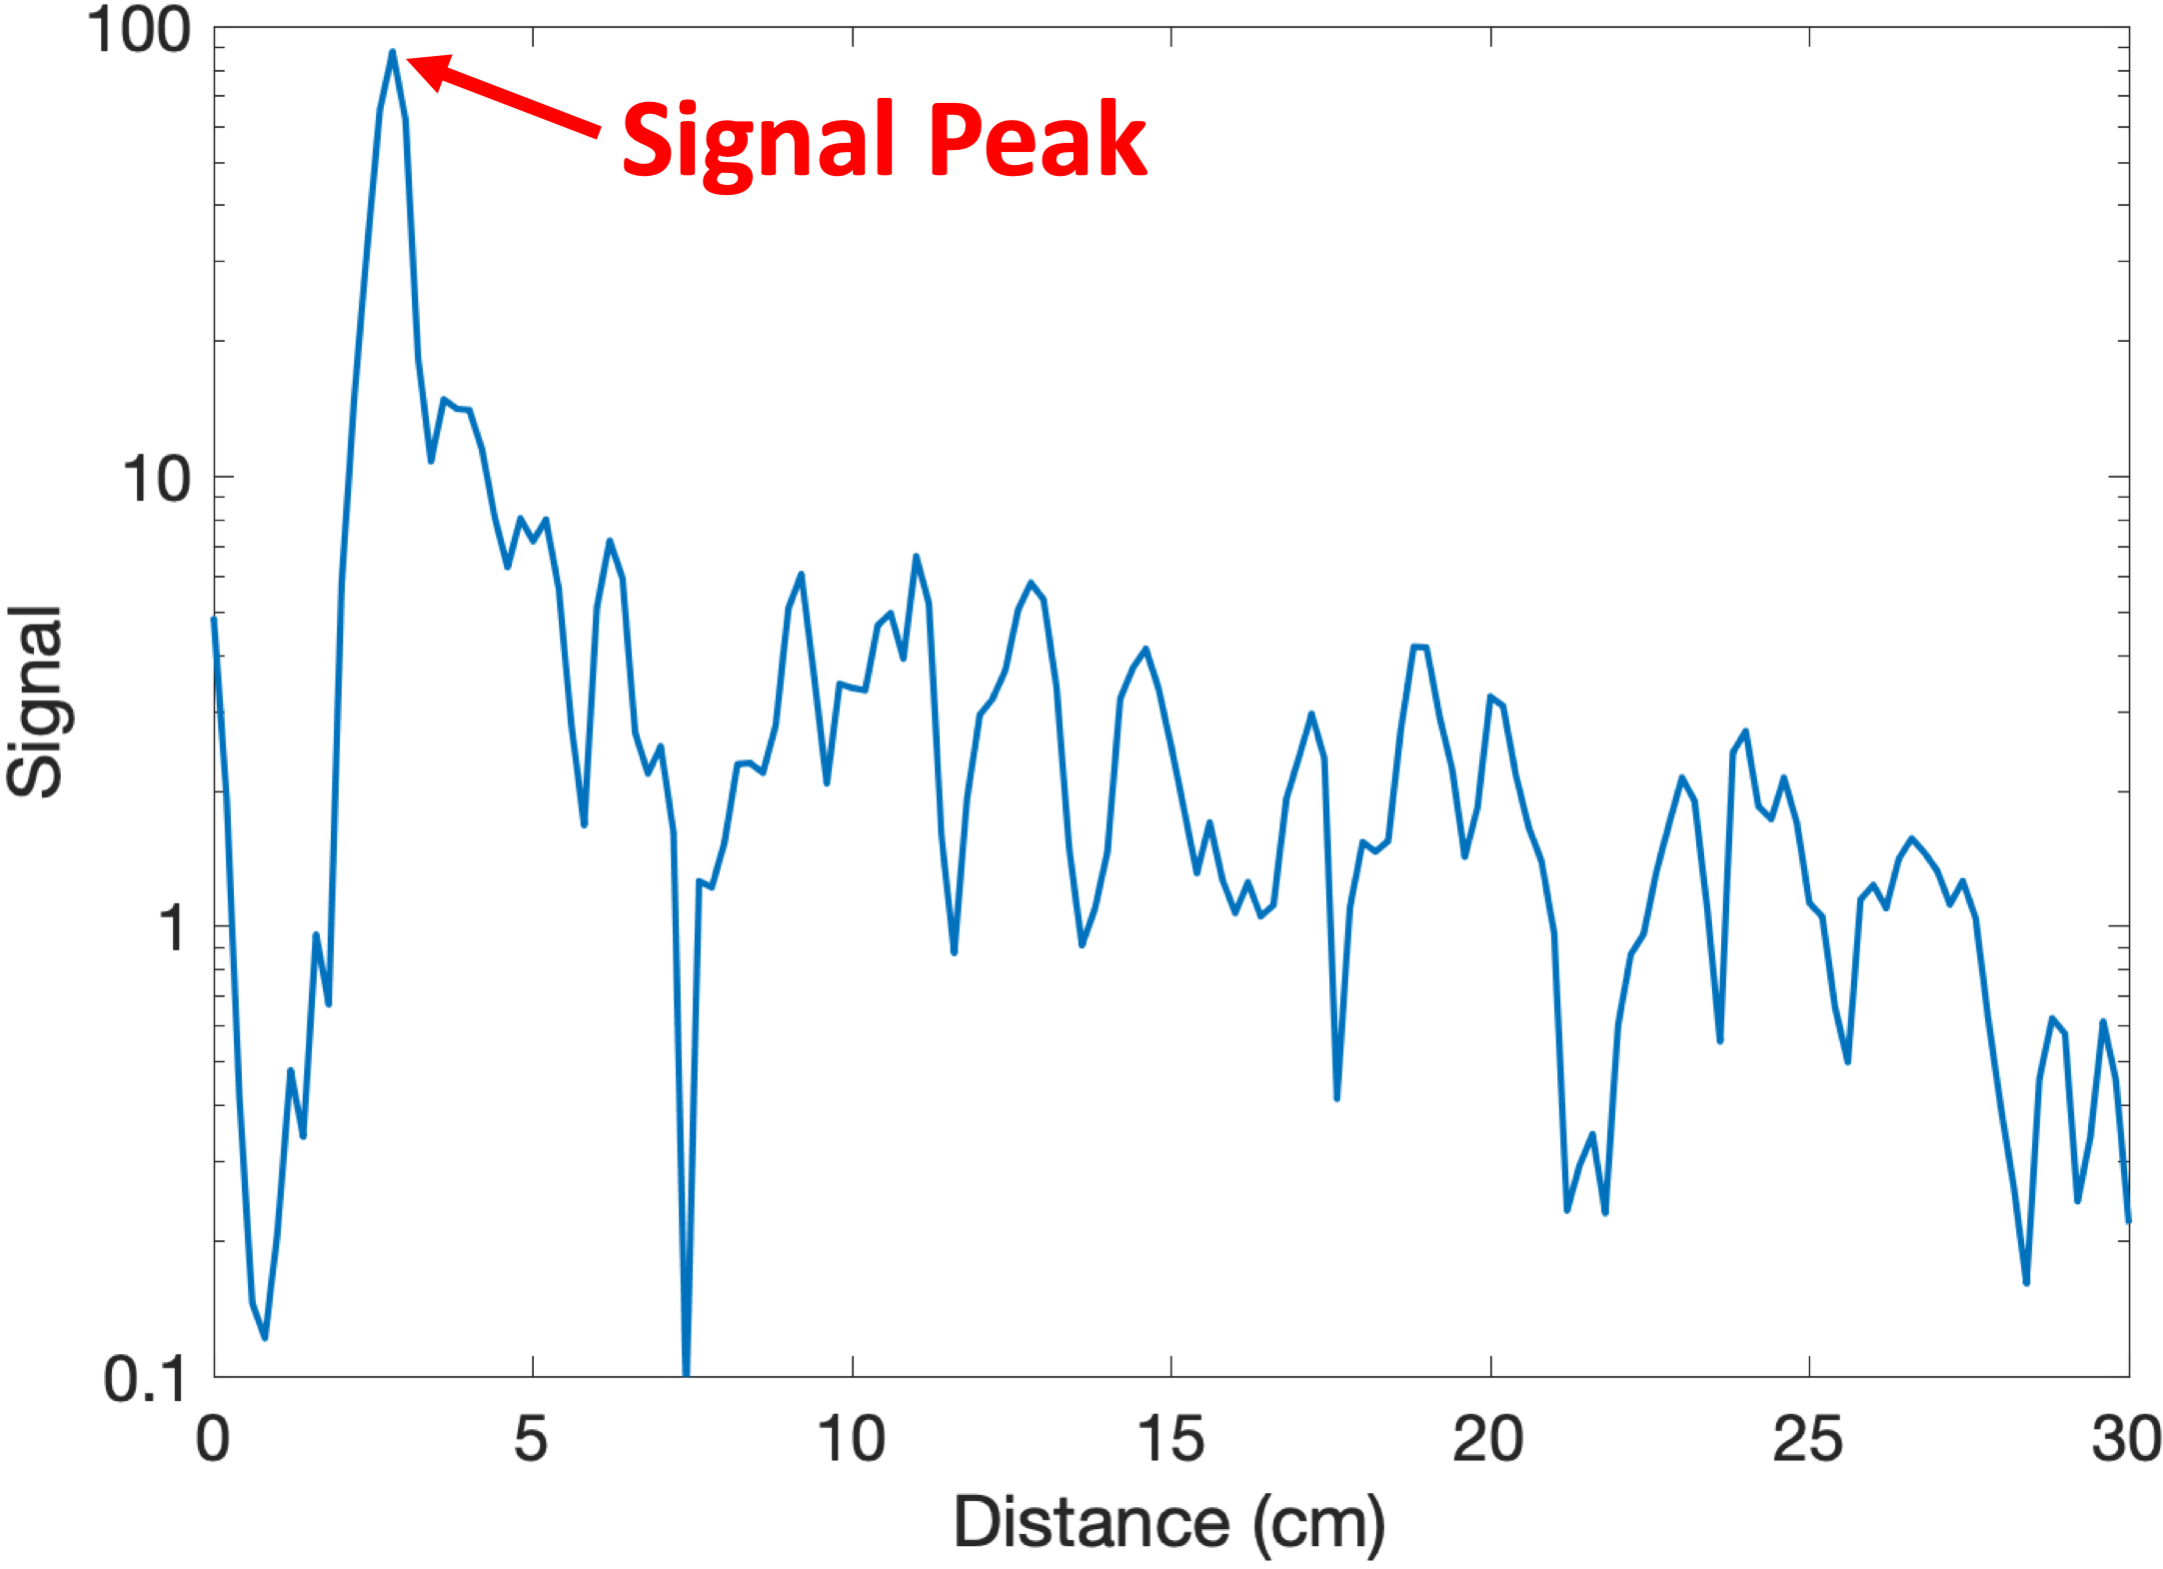
Each TAUS acquisition showed a clear signal peak at the distance between the transducer and the model lead tip (Figure 2). The amplitude at this peak appeared to track the temperature over time (Figure 3, top row), resulting in a near-affine fit between the recorded temperature and the TAUS signal level (Figure 3, bottom row).
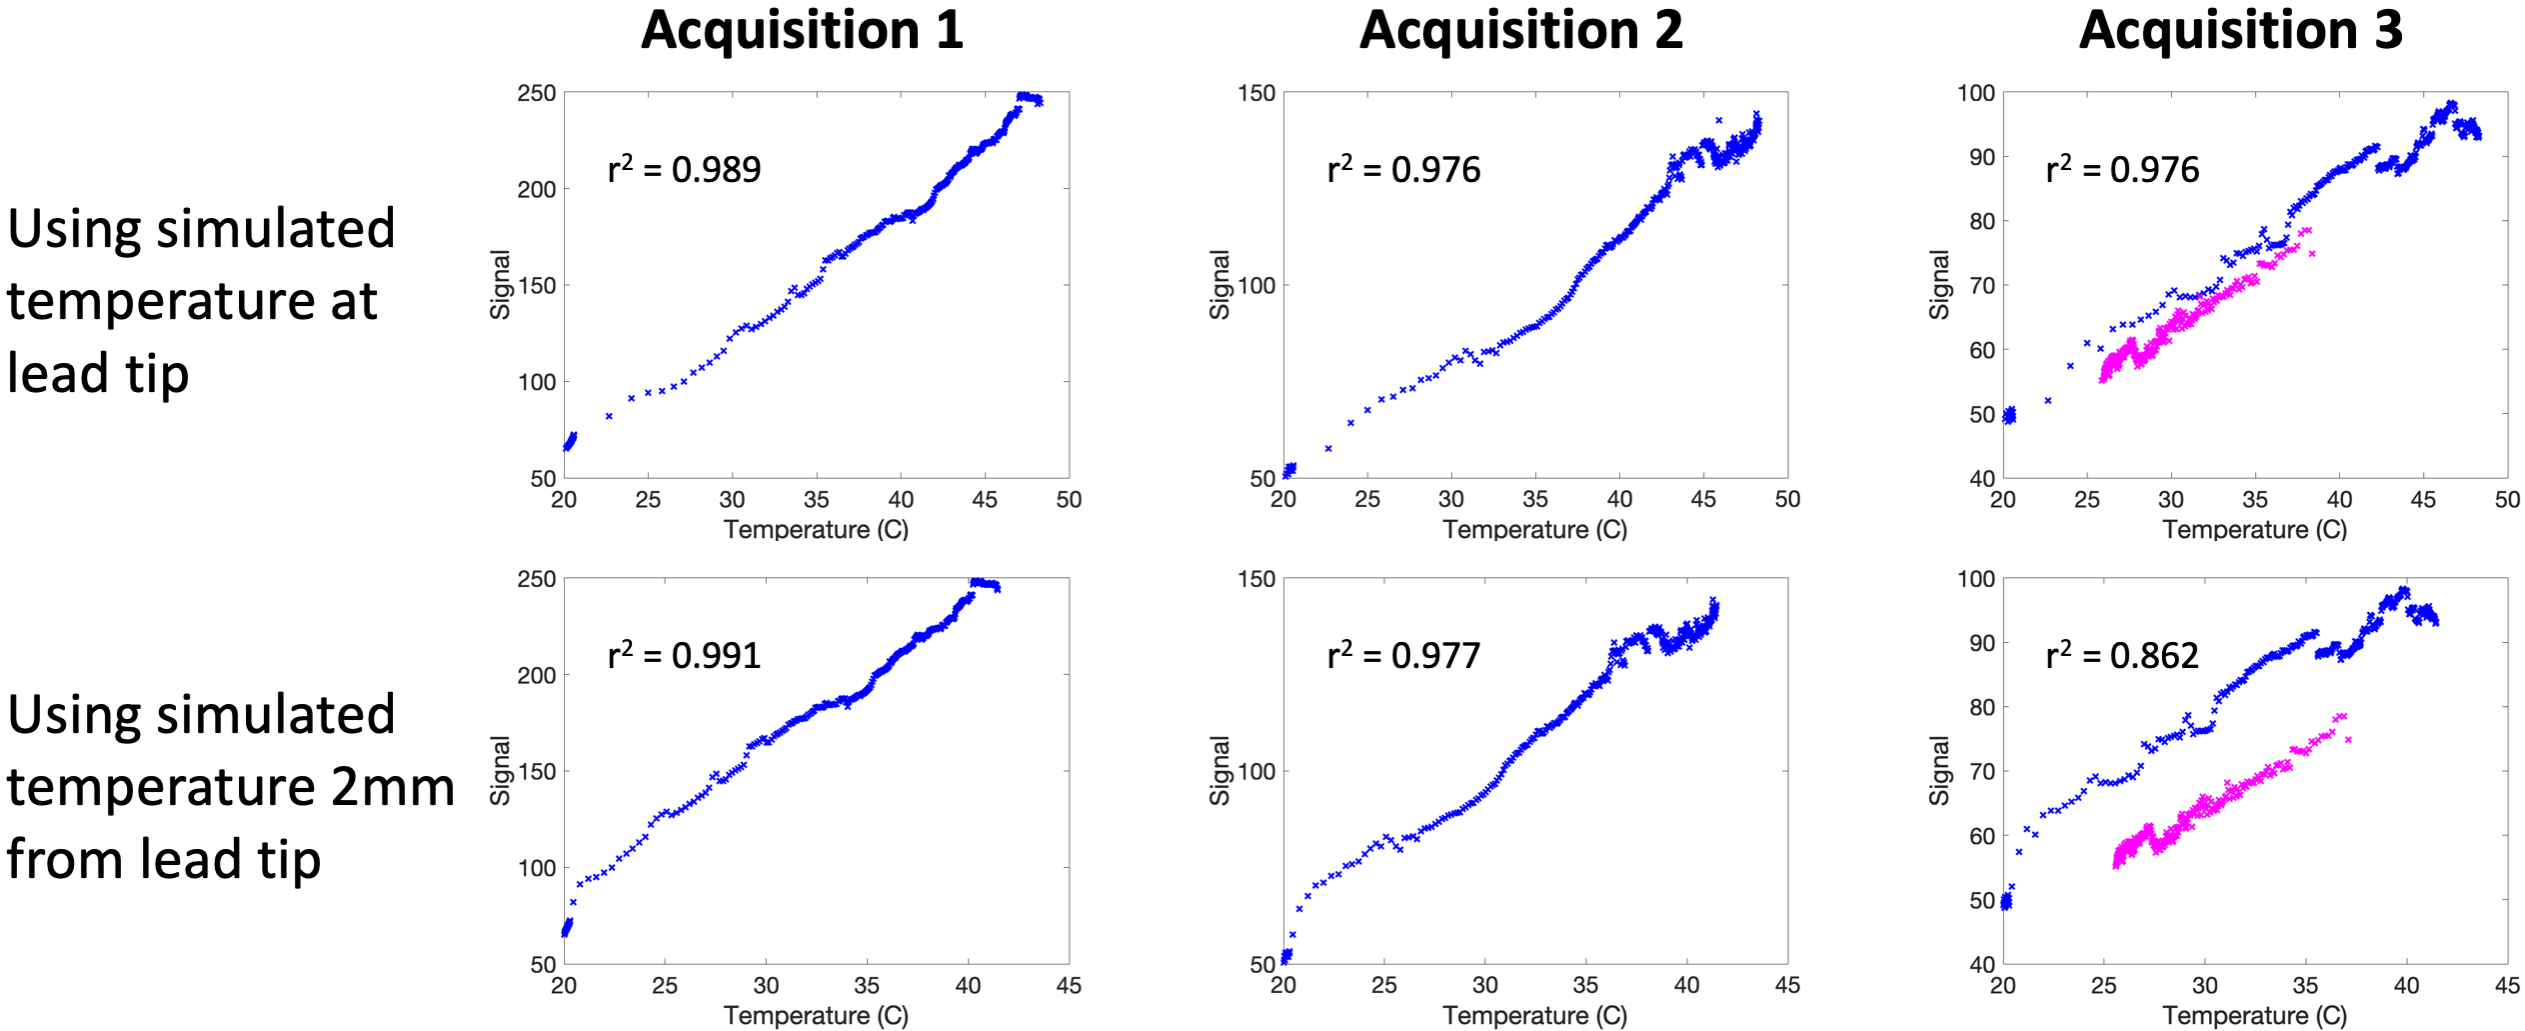
The simulation results (Figure 4) demonstrated that the temperature directly at the lead tip can differ significantly from the temperature nearby. Therefore, the distance of a few millimeters between the temperature sensor and the model lead tip could account for some of the deviation from the expected affine fit between the recorded signal and measured temperature. Plots of the experimentally recorded signal against the simulated lead tip temperature (Figure 5, top row) more closely show the expected affine fit, whereas plots of the signal against the simulated temperature 2mm away from the lead tip (Figure 5, bottom row) resemble the fit obtained using the experimentally measured temperature (Figure 3, bottom row).
Conclusion
The amplitude of the TAUS signal from a lead tip depends on the temperature at the lead tip. Interleaving a TAUS scan with an MRI imaging sequence should allow for real-time monitoring of the lead tip temperature during imaging.Acknowledgements
The work was supported by the NIH under grants R01EB008108 and P01CA159992, the Department of Defense (DoD) through the National Defense Science & Engineering Graduate Fellowship (NDSEG) program, and the William R. Hewlett Stanford Graduate Fellowship.
References
1. Nitz WR, Oppelt A, Manke C, Lenhart M, Link J. On the heating of linear conductive structures as guide wires and catheters in interventional MRI. J Magn Reson Imag. 2001;13(1):105-114.
2. Nyenhuis JA, Park S-M, Kamondetdacha R, Amjad A, Shellock FG, Rezai AR. MRI and implanted medical devices: Basic interactions with an emphasis on heating. IEEE Trans Device Mater Rel. 2005;5(3):467-480.
3. Spiegel J, Fuss G, Backens M, et al. Transient dystonia following magnetic resonance imaging in a patient with deep brain stimulation electrodes for the treatment of Parkinson disease. J Neurosurg. 2003;99(4):772-774.
4. Henderson JM, Tkach J, Phillips M, Baker K, Shellock FG, Rezai AR. Permanent neurological deficit related to magnetic resonance imaging in a patient with implanted deep brain stimulation electrodes for Parkinson's disease: Case report. Neurosurgery. 2005;57(5):E1063.
5. Scott G, Etezadi-Amoli M, Stang P, Nan H, Arbabian A, Pauly J. Thermo-acoustic ultrasound detection of RF coil and tip SAR. Proc Intl Soc Mag Reson Med. 2015;23:377.
6. Winkler SA, Picot PA, Thornton MM, Rutt BK. Direct SAR mapping by thermoacoustic imaging: a feasibility study. Magn Reson Med. 2017;78(4):1599-1606.
7. Dixit N, Stang PP, Pauly JM, Scott GC. Thermo-acoustic ultrasound for detection of RF-induced device lead heating in MRI. IEEE Trans Med Imaging. 2018;37(2):536-546.
8. Pramanik M, Wang LV. Thermoacoustic and photoacoustic sensing of temperature. Journal of Biomedical Optics. 2009;14(5):054024.
9. Lou C, Xing D. Temperature monitoring utilising thermoacoustic signals during pulsed microwave thermotherapy: A feasibility study. Int J Hyperthermia. 2010;26(4):338-346.
10. Ke H, Erpelding TN, Jankovic L, Wang LV. Temperature mapping using photoacoustic and thermoacoustic tomography. Proc SPIE 8223. 2012;8223:82230T.
11. Petrova E, Ermilov S, Su R, Nadvoretskiy V, Conjusteau A, Oraevsky A. Using optoacoustic imaging for measuring the temperature dependence of Gruneisen parameter in optically absorbing solutions. Optics Express. 2013;21(21):25077-25090.
12. Xu F, Zhong J, Chen Q, Yang S, Xing D. Nonlinear thermoacoustic imaging based on temperature-dependent thermoelastic response. IEEE Trans Med Imaging. preprint.
13. Dixit N, Stang P, Pauly J, Scott G. A reproducible and lower-cost thermo-acoustic ultrasound system for detection of RF-induced lead tip heating in MRI. Proc Intl Soc Mag Reson Med. 2018;26:648.
Figures