0802
Predicting final lesion size using Thermometry information during MR-guided focused ultrasound treatment of Parkinson’s DiseaseSijia Guo1, Jiachen Zhuo1, Rao Gullapalli1, and Dheeraj Gandhi1
1Department of Diagnostic Radiology and Nuclear Medicine, University of Maryland School of Medicine, Baltimore, MD, United States
Synopsis
Recently, the MR-guided focused ultrasound technology (MRgFUS) offers the possibility to perform subthalamic thermal ablation with reduced risks and optimized accuracy. However, the ability to reliably predict lesion size is still evolving. The goal of this study was to improve the predictability of lesion size by thermal thresholding areas on MR thermometry during treatment procedures.
Introduction
The success of MR-guided focused ultrasound (MRgFUS) to ablate the ventral intermediate nucleus to treat essential tremors (ET) has opened the door for other treatments including Parkinson’s disease (PD) where Globus Pallidum (GP) is targeted. Of specific interest is to be able to arrive at a thermal threshold that reliably predicts the lesion size when targeting GP. Here we assessed the temperature threshold that best predicts the 24-hour lesion as seen on T2-weighted MRI using the MR thermometry data acquired on PD patients during the feasibility study where unilateral lesioning was performed.Methods
Data from 13 subjects that participated in the treatment of PD was retrospectively analyzed. Whole brain T2-weighted MR images were obtained 24 hours (all 13 patients) and 30 days (9 patients) after the treatment to visualize the thermal lesion size. Unlike essential tremor [1] where the VIM is targeted, the GP is slightly off-center and hence the shape of the lesion is elongated and more ellipsoid in shape due to the limitation of current MRgFUS system. MR thermometry images at the end of each sonication were used and the maps were thresholded at various temperatures (52°C, 50°C, 48°C, and 46°C). The thresholded regions indicate the minimum temperature received in that area. We compared this area at each temperature threshold with area seen in the lesion on T2-weighted images at 24 hours and 30 days. Two vectors (x and y) were used for area determination of the lesion and also to assess the shape and the direction on the 24-hour and 30 day T2-weighted images (Fig. 1), with θ being the angle between x-vector and the horizontal axis in the images. Similar vectors (x2, y2) were also created on the thresholded thermal maps on the day of the procedure. As the targeted location is typically moved (typically 2~3 times) during the treatment as shown in Fig. 1, for better localization, we considered that the movement on RL, AP and SI directions would have an effect on the thermal threshold acheived. The temperature at which there was maximum concordance with the area determined by the temperature map and the 24-hour lesion volume was determined from all cases.Results
An example of thermal thresholding areas at different temperature acquired from MR thermometry images is shown in Fig. 2 along with the peak temperature rise at the spot, in which the red line indicates the peak temperature and the green line is the average temperature of the surrounding pixels. These thermal areas were compared with the thermal lesion from 24-hour T2-weighted MR images (Fig. 3) and also 30 day images. Based on an average of the differences on 13 patients, 48°C threshold provided the best estimation for 24-hour T2-weighted lesions. The 48°C threshold model also provided good correlations with the long and short axis of the lesions (Fig. 4). Such correlation was not possible with the 30 day T2-lesion and therefore was not predictive.Conclusions
In this retrospective review of 13 PD patients, sonication at a minimum temperature of 48oC appeared to predict the 24-hour T2-weighted lesion. In contrast, previous reports for ET reported a minimum temperature of 51°C to create a lesion. The low-temperature threshold of PD is due to the focal spot spread when targeting GP which is more off-center compared to essential tremor cases.Acknowledgements
No acknowledgement found.References
[1] A. Bond and W. Elias, ‘Predicting lesion size during focused ultrasound thalamotomy: a review of 63 lesions over 3 clinical trials’, Neurosurgical Focus, 44(2), 2018.Figures
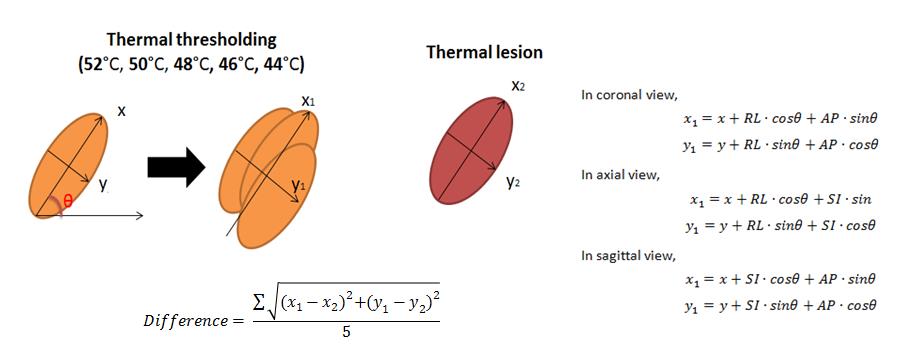
Thermal thresholding areas from MR thermometer and thermal lesion of post-treatment T2-weighted images. The differences between thermal thresholding areas and thermal lesion were calculated based on the five sonications which caused the most temperature rises.
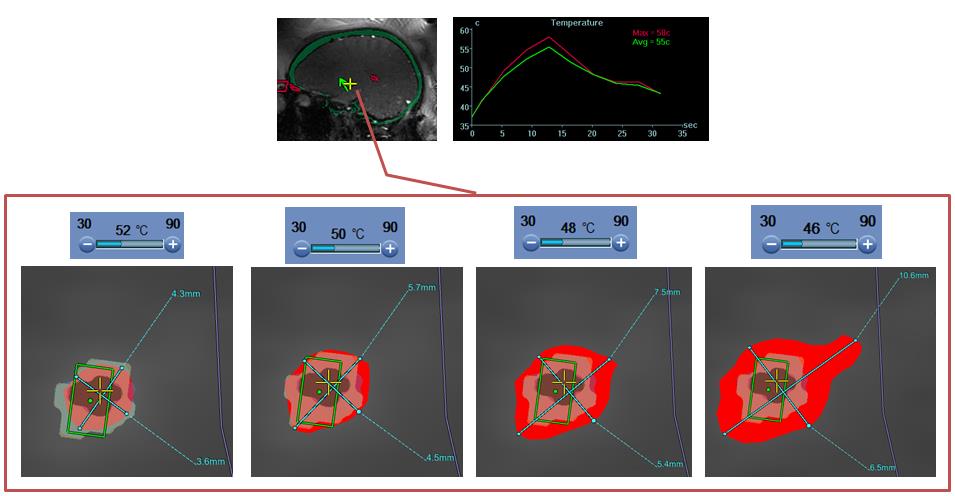
Thermal
areas with different thresholds acquired from MR thermometry during PD
treatment.
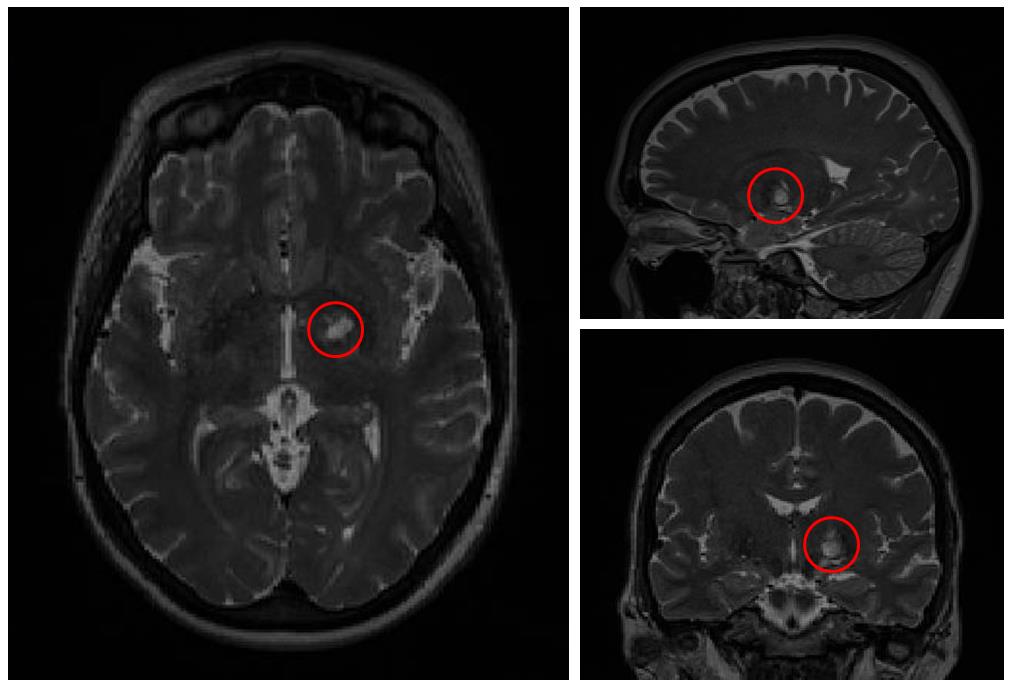
Visible thermal lesion from 24-hour post-treatment T2-weighted MR images.
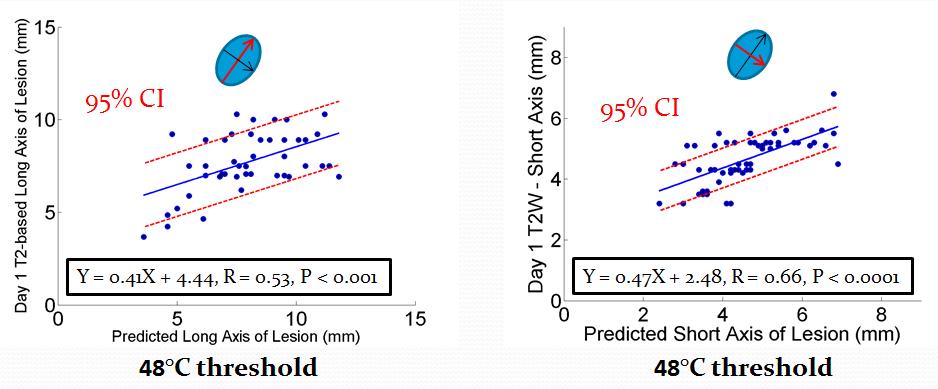
Correlations on the long and short axis of predicted lesions and 24-hour
T2-weighted lesions based on sonications on 13 patients.