0800
Localization of GPi for MRgFUS pallidotomy: a comparison between high-resolution FGATIR, R2* and QSM at 3 T1Radiology, University of Calgary, Calgary, AB, Canada
Synopsis
Precise localization of the internal globus pallidus (GPi) is critical for MRgFUS pallidotomy for movement disorders such as Parkinson’s disease. In this study, high-resolution FGATIR, R2* and QSM are compared for localizing GPi in six healthy subjects (age from 21 to 41). All three methods displayed some image contrasts in the GP area. QSM demonstrated the best delineation of GPi from the internal capsule, which is generally considered a risk zone for pallidotomy. GPi also appeared smaller in FGATIR, where GPi was hypointense, than in QSM, where GPi was hyperintense.
Introduction
MR-guided focused ultrasound (MRgFUS) pallidotomy surgery has been applied to treat movement disorders, such as Parkinson’s disease, targeting the internal globus pallidus (GPi).1 However, conventional MRI methods usually give poor image contrast in the region of GP, which makes precise localization of GPi challenging and also makes internal capsule (IC) a risk zone for pallidotomy. The Fast Grey Matter Acquisition T1 Inversion Recovery (FGATIR) 2 is a white-matter nulling MPRAGE method that has demonstrated improved visualization of the deep grey matter (DGM) structures, including GPi. Magnetic susceptibility imaging methods, such as R2* and QSM, are known to provide excellent contrast in DGM. QSM also displays clear seperation between GP and IC. Here we compare high-resolution FGATIR, R2* and QSM for the localization of the GPi at 3 T, for accurate MRgFUS pallidotomy targeting.Methods
Six healthy subjects (age: 21-41, 3 females) were scanned at a 3 T MRI system with a 32-channel head coil. Sequences and parameters are: (1) Sagittal MPRAGE: TE 3ms, TR 6.8ms, TI 650ms, 1mm3 voxel, bandwidth 244Hz/px, flip angle 9 degree, GRAPPA factor of 2, scan time 4:31 mins. (2) Sagittal FGATIR: A radial fan-beam k-space scheme 3 was implemented with each fan-beam segment starts with an inversion preparation and ends with a post-segment delay for inversion recovery. To match with the previous study,3 TE was set to 4.6ms, TR 10ms, flip angle 7 degree, segment TR 4.5s, number of segments 240, bandwidth 122Hz/px, GRAPPA of 1.5*1.5, 1mm3 voxel, scan time 6:33 mins. 4 different TIs (400,450,500,550ms) were tested. (3) Axial multi-echo GRE: first TE 3.9ms, echo spacing 4.3ms, 6 unipolar echoes, TR 30ms, bandwidth 244Hz/px, 0.8*0.8*1mm3 voxel, SENSE factor of 2, scan time 6:50 mins.
All images were rigidly registered to T1w-MPRAGE using FLIRT. QSM was processed using the iLSQR method.4 Window levels for displaying of all images are adjusted to best visualize the GP and distinguish GPi and GPe.
Results
Figure 1 shows DGM regions of a 41-year-old male subject with 4 different imaging methods in orthogonal views. GP shows no apparent contrast in MPRAGE, while hypointense in FGATIR, and hyperintense in R2* and QSM. The best delineation between GPi and GPe is observed in FGATIR and QSM.
Figure 2 shows the best two FGATIR results from the 4 inversion times tested. A TI of 500ms results in low signal contrast in GP, which makes localization of GPi difficult, especially in axial view. A TI of 450ms enhances the signal contrast of GP, and the size of GPi and GPe also appear larger than in TI of 500ms.
Figure 3 displays DGM of a 27-year-old subject in axial view using 4 different methods, as well as the signal intensity profiles crossing IC, GPi, GPe and putamen. QSM illustrates the best separation between IC, GPi, GPe and putamen. This is also confirmed by the QSM profile plot. The excellent contrast between the hyperintense GPi and the hypointense internal capsule in QSM provides clean boundary of GPi.
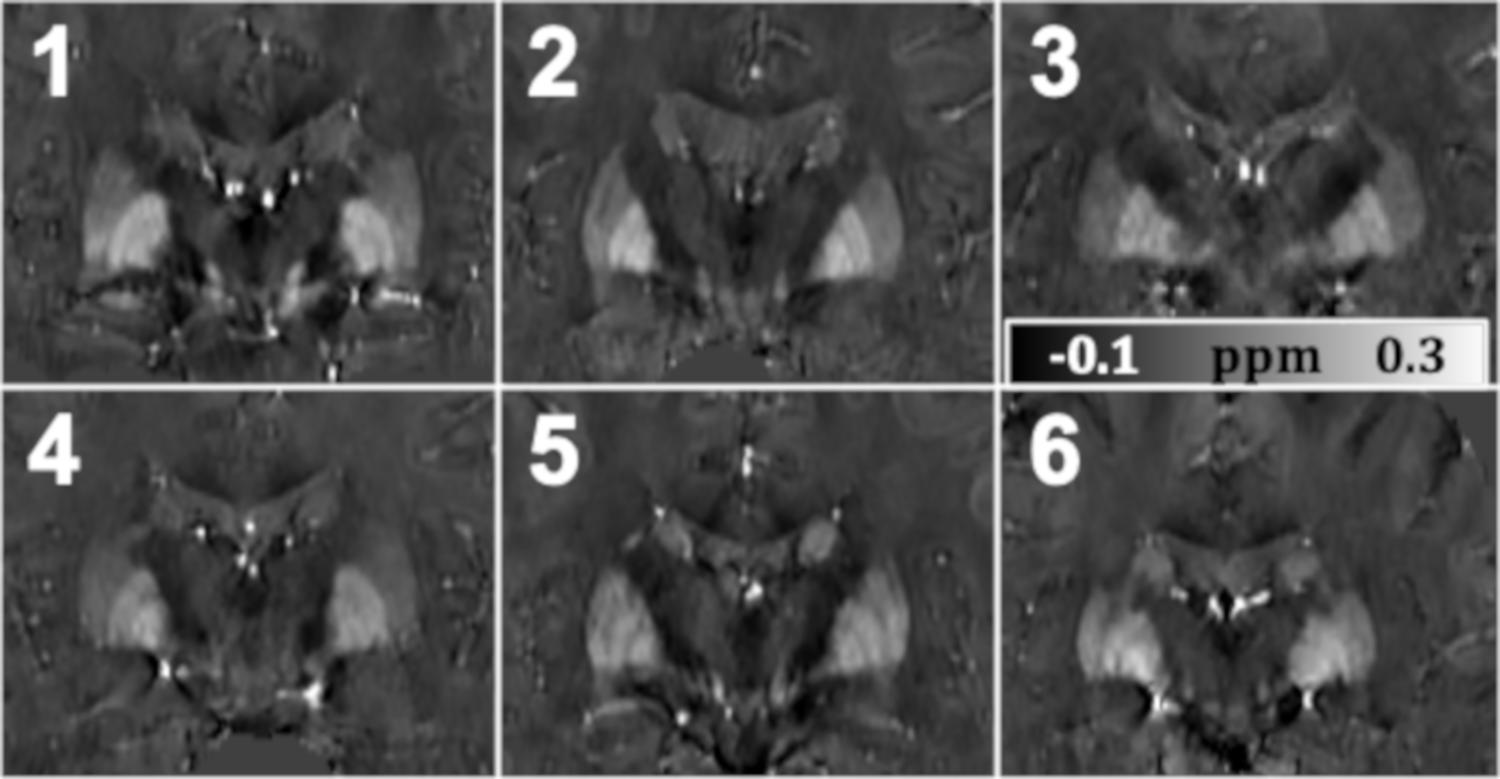
Figure 4 illustrates zoomed-in DGM region in coronal QSM for all six subjects. The GP and putamen can be easily delineated from the surrounding tissue. The internal and external segments of GP are also distinguishable with careful exam.
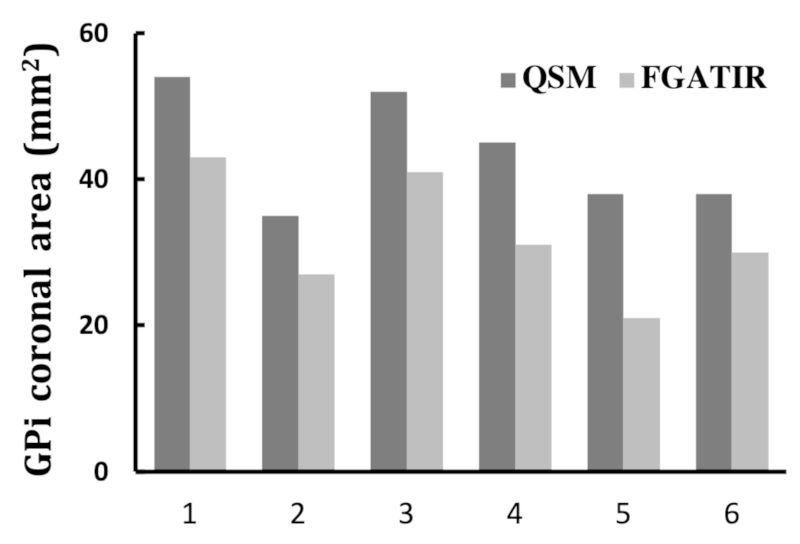
Figure 5 compares GPi sizes (2D area) drawn independently on the same coronal slice of registered QSM and FGATIR for all six subjects. The GPi areas measured by FGATIR are consistently smaller (27% on average) in all subjects.
Discussion
FGATIR displays relatively low SNR in GP area, which makes GPi appear smaller and only partially visible. FGATIR is also sensitive to scan parameters such as TI, segment TR, FOV, matrix size and parallel imaging factors. R2* and QSM show high signal intensity in GP area, and are, in theory, independent of sequence parameters with high reproducibility. QSM displays clearer separation between GPi and GPe than R2*. Moreover, the highly diamagnetic internal capsule, which is adjacent to GPi and is generally a risk area for pallidotomy, appears hypointense in QSM and provides distinct border with GPi. Future studies may explore the use of both FGATIR and QSM to reassure the accurate localization of GPi. A recent multi-echo MP2RAGE method 5 has demonstrated the feasibility of simultaneously acquiring FGATIR-liked image and QSM, without the need for image registration.Acknowledgements
This work was supported by grants from Alberta Innovates Health Solutions (AIHS); Canadian Institutes of Health Research (CIHR) (FDN-143290); Campus Alberta Innovates Program (CAIP).References
[1] Lozano AM, Lang AE. Pallidotomy for Parkinson's disease. Neurosurg Clin N Am. 1998 Apr;9(2):325-36.
[2] Sudhyadhom A, Haq IU, Foote KD, Okun MS, Bova FJ. A high resolution and high contrast MRI for differentiation of subcortical structures for DBS targeting: the Fast Gray Matter Acquisition T1 Inversion Recovery (FGATIR). Neuroimage. 2009 Aug;47 Suppl 2:T44-52.
[3] Saranathan M, Tourdias T, Bayram E, Ghanouni P, Rutt BK. Optimization of white-matter-nulled magnetization prepared rapid gradient echo (MP-RAGE) imaging. Magn Reson Med. 2015 May;73(5):1786-94.
[4] Li W, Wang N, Yu F, Han H, Cao W, Romero R, Tantiwongkosi B, Duong TQ, Liu C. A method for estimating and removing streaking artifacts in quantitative susceptibility mapping. Neuroimage. 2015 Mar;108:111-22.
[5] Metere R, Kober T, Möller HE, Schäfer A. Simultaneous Quantitative MRI Mapping of T1, T2* and Magnetic Susceptibility with Multi-Echo MP2RAGE. PLoS One. 2017 Jan 12;12(1):e0169265.
Figures
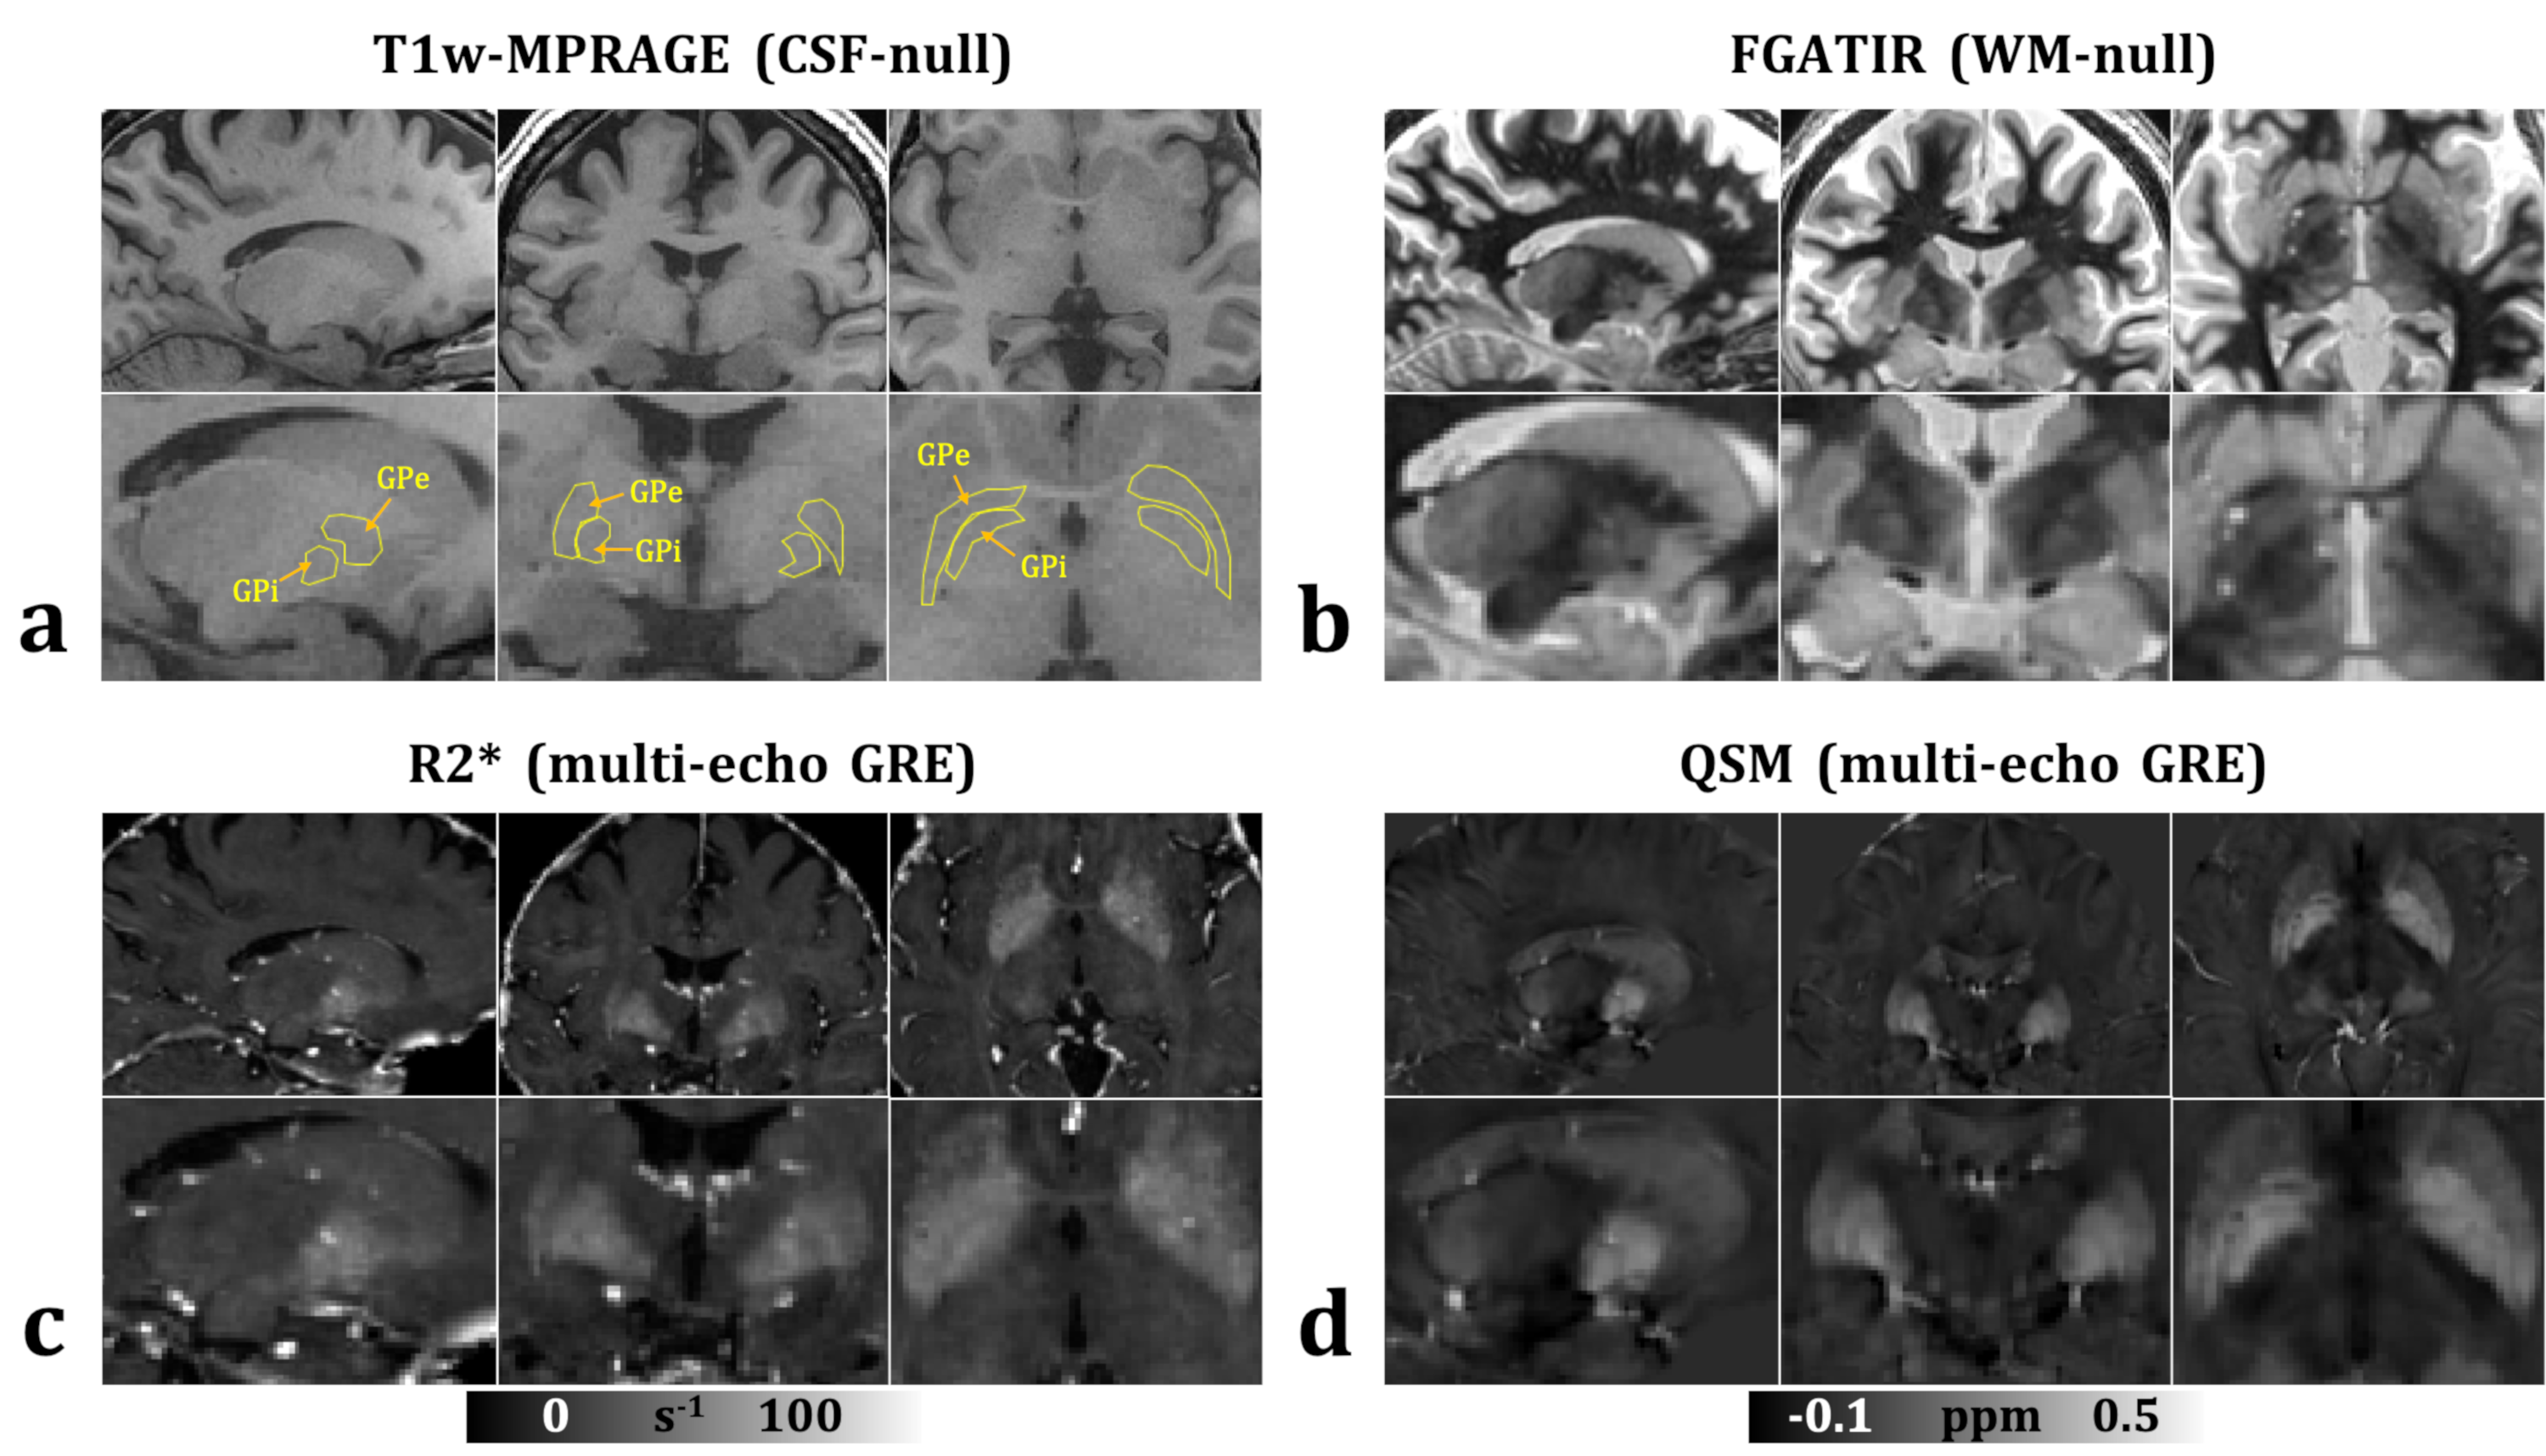
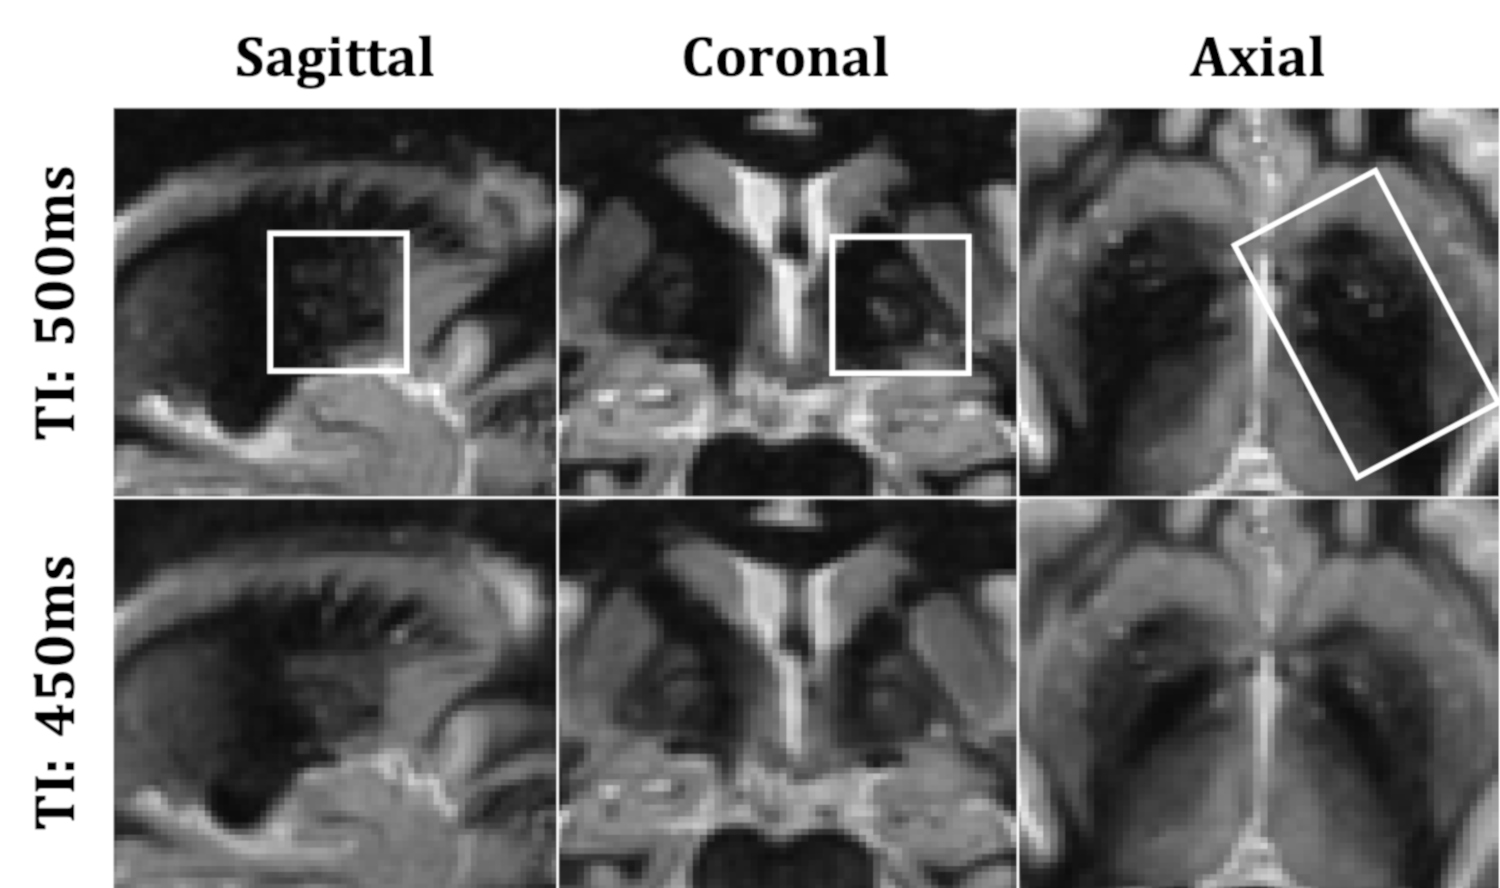
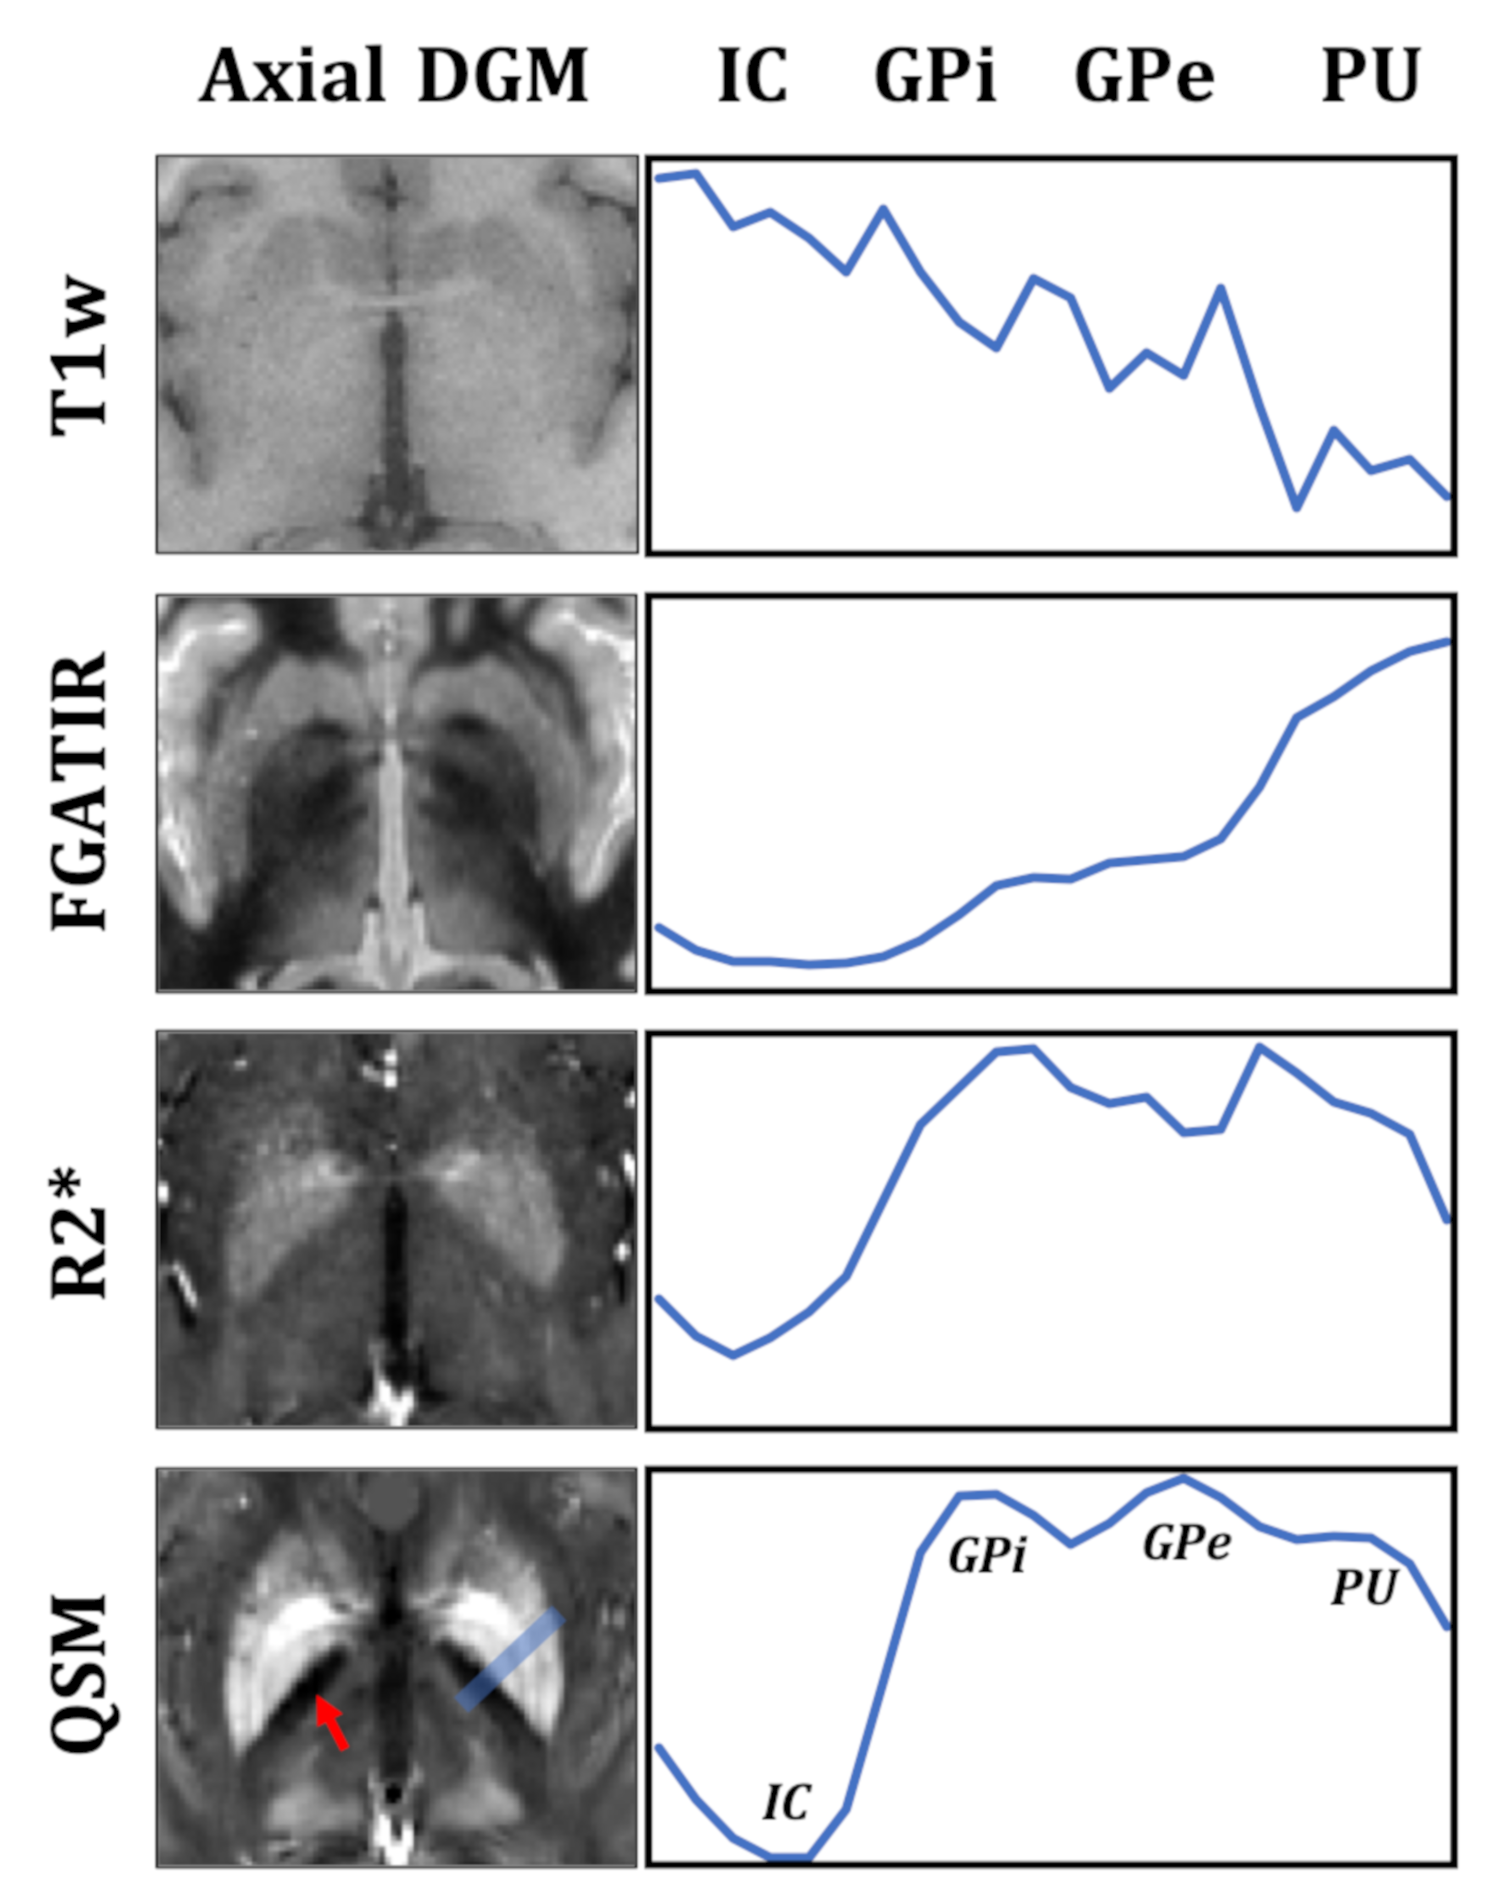
Fig. 3: Axial slice containing deep grey matter from a 27-year-old male as well as line profile crossing internal capsule, GPi, GPe, and putamen (blue rectangular) for all methods. Red arrow points to internal capsule (hypointense).