0799
Magnetic resonance shear wave elastography in cadaver breast1Radiology and Imaging Sciences, University of Utah, Salt Lake City, UT, United States, 2Bioengineering, University of Utah, Salt Lake City, UT, United States
Synopsis
Tissue stiffness is a known marker of malignancy and has been shown to change due to thermal therapies. A shear wave elastography technique compatible with magnetic resonance guided focused ultrasound technology is demonstrated in a cadaver breast specimen. Volumetric shear wave speed maps acquired using a multiple-point sonication pattern before and after an MRgFUS ablation demonstrate that a change in shear wave speed can be detected. This technique provides a functional stiffness metric that is complementary to currently used monitoring and assessment techniques in MRgFUS treatments.
Introduction
Breast cancer remains an important disease, adversely affecting a large population of women and presents a worldwide socioeconomic burden. New image-guided minimally invasive therapies have expanded options for breast conserving therapies by providing patient-specific treatment planning, monitoring and assessment. Magnetic resonance guided focused ultrasound (MRgFUS) is a completely non-invasive technique to treat localized breast cancer. While proton resonance frequency (PRF)-based MR thermometry techniques can accurately measure temperature in aqueous tissues, they do not work in fat, making monitoring and assessing MRgFUS treatments in the breast challenging1. Tissue stiffness is a known marker of malignancy and has been demonstrated to change during ablative therapies2,3. This work demonstrates an MRgFUS compatible magnetic resonance shear wave elastography (MRSWE) technique that can quantitatively measure volumetric shear wave speed in breast tissue, providing a complementary method for treatment assessment. This work demonstrates technique feasibility in cadaver breast tissue.Methods
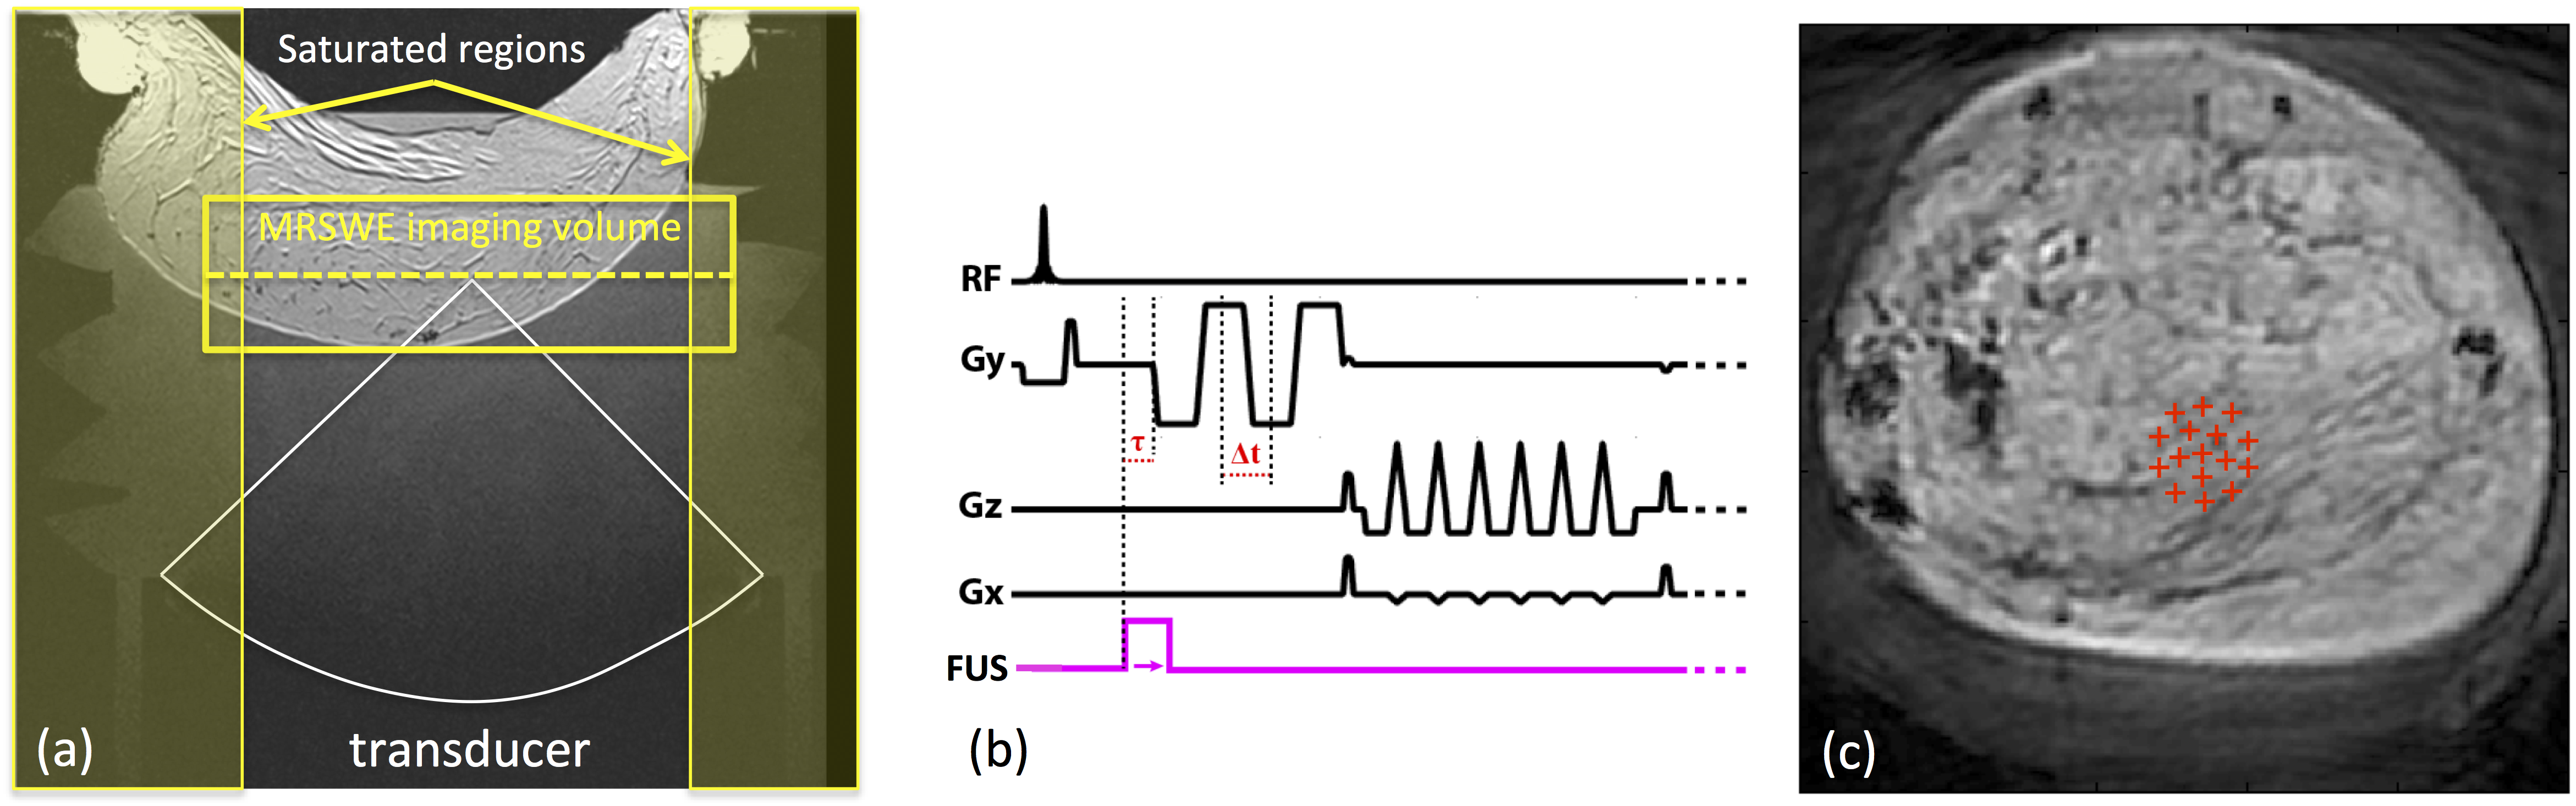
All experiments were performed with a preclinical MRgFUS system (256-element, 940 kHz, 10 cm focal length, 14.4 x 9.8 cm aperture, Image Guided Therapy, Inc). The transducer was coupled to the specimen with a column of deionized, degassed water. A single loop, custom RF-coil was used to acquire the 3T MRI signal (MAGNETOM PrismaFIT, Siemens) from a cadaver breast specimen (Figure 1a). MRSWE measurements were acquired by incorporating four motion encoding gradient (MEG) lobes in a 3D gradient echo segmented echo planar imaging pulse sequence (Figure 1b, TR/TE = 34/65 ms, FA=45°, ETL=7, 128x128x8 matrix, 1x1x5 mm resolution, MEG amplitude/duration/slew rate = 60 mT/m, 5 ms, 80 mT/m/ms). The acquisition volume was oriented perpendicular to the focused ultrasound beam and an optical trigger synchronized the acoustic radiation force (ARF) impulses generated by the FUS transducer with the MEG lobes. Using the MRgFUS phased array transducer, this implementation generated ARF impulses4 (3 ms, 83 acoustic W, τ = 1.5 ms as defined in Figure 1c) at 16 co-planar spatial positions interleaved at a TR level. A separate image volume was obtained for each ARF impulse. A final image with no ARF impulse, but interleaved on the TR level with the 16 other images, was acquired as a reference volume that was subtracted from all ARF encoded images to remove background and temperature induced phase changes.
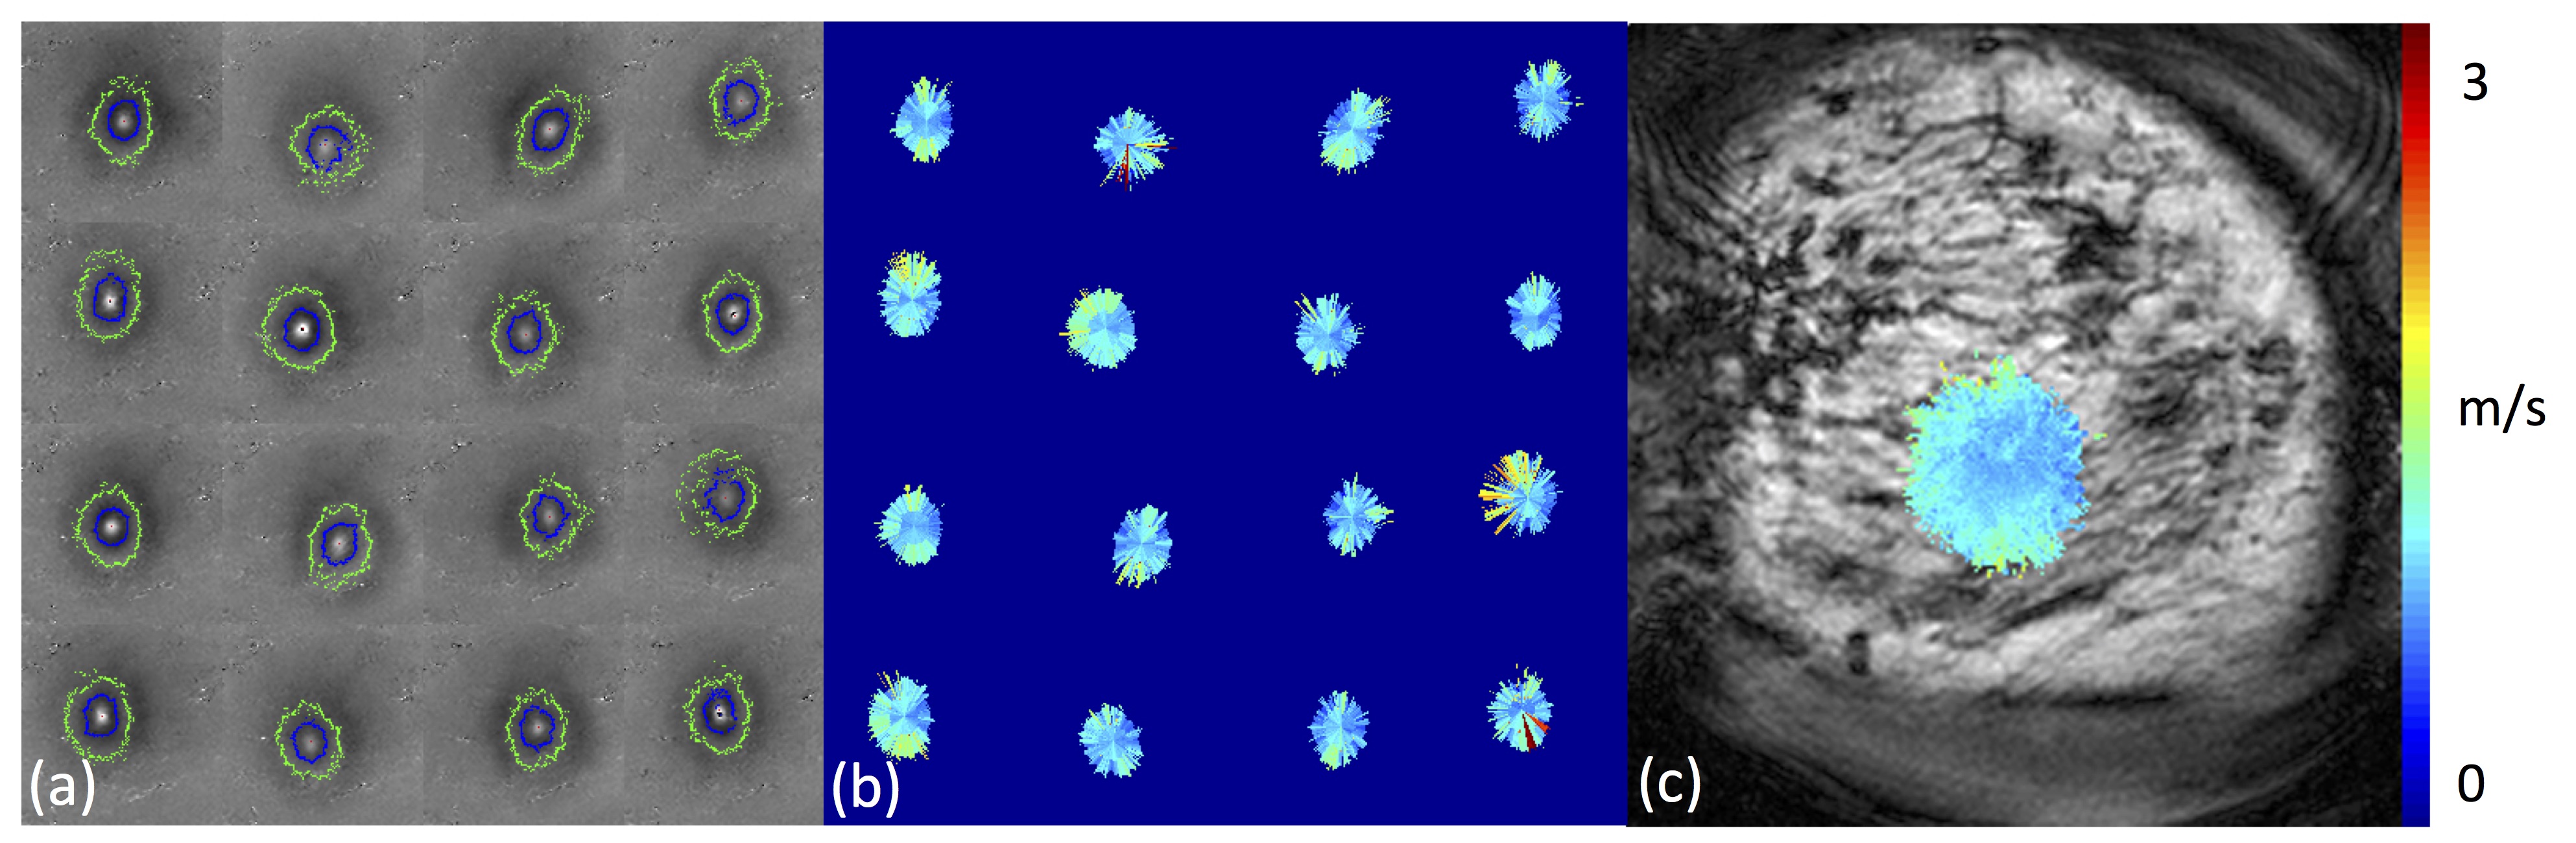
Figure 2a shows the propagating shear wave fronts at each of the 16 ARF impulse locations. The wave front is visible in the alternating positive and negative rings in the phase difference images. Normalized 2D cross-correlation template matching with a 2D Gaussian shaped filter was used to extract the initial ARF impulse location for each ARF point, using this location as the source of the cylindrically propagating wave, 1D template matching was used to generate an initial position estimate of the shear wavefront displacement peak along each radial line. Shear wave speed is calculated by dividing the distance between adjacent wavefronts by the MEG spacing (Figure 2b). A composite shear wave speed map (Figure 2c) is generated using the median combination of all ARF impulses.
To evaluate the ability of MRSWE to complement existing MRgFUS monitoring and assessment measurement techniques, a baseline MRSWE measurement was obtained, a volumetric ablation (60 s, 100 acoustic W ablation, 4 mm diameter) was performed, and two additional MRSWE measurements were obtained to evaluate the effect of the volumetric sonication on the measured shear wave speed.
Results
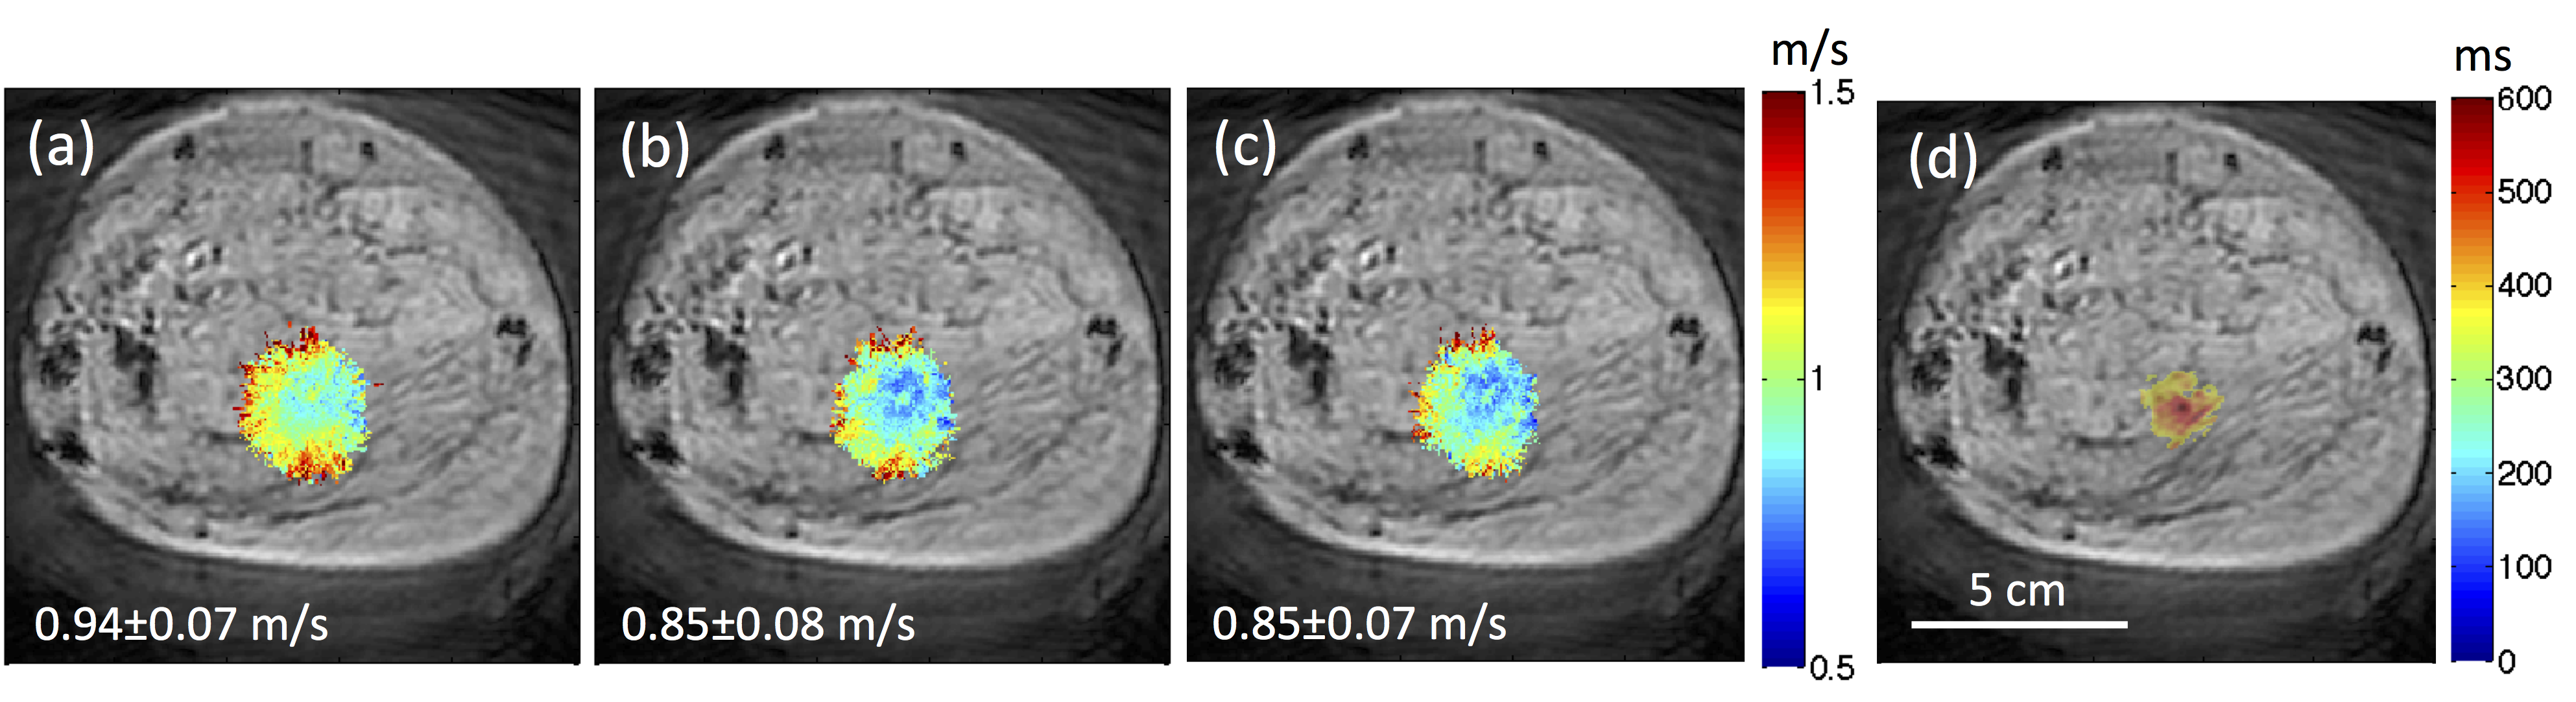
Figure 3 shows the MRSWE maps obtained before ablation and at three and ten minutes after ablation. As seen in the T1w image in Figure 1a, the cadaver breast tissue was composed mostly of fat, and therefore PRF thermometry could not be obtained during the sonication. However, an increase in T1 can be seen in the region that was sonicated. Figure 3d shows the area where the T1 value of the fat was increased 25% above baseline value of 280 ms. The shear wave speed values of these voxels were 0.94±0.07 m/s before ablation and 0.85±0.08 and 0.85±0.07 m/s three and ten minutes after the ablation, respectively.Discussion and Conclusions
This work demonstrates the ability of MRSWE to acutely measure a statistically significant (p < 0.001) shear wave speed change after an MRgFUS ablation in cadaver breast tissue. A 10% decrease in shear wave speed was detected in the heated tissue after an MRgFUS ablative sonication. We will quantitatively investigate different tissue damage mechanisms in future work. While this feasibility study is limited, MRSWE provides a quantitative, functional measurement that will potentially be complementary to other MRgFUS monitoring and assessment metrics, increasing the utility of this non-invasive therapy.Acknowledgements
This project was funded through R03EB023712, R37CA224141 and S10OD018482.References
1. Todd et al., In vivo evaluation of multi-echo hybrid PRF/T1 approach for temperature monitoring during breast MR-guided focused ultrasound surgery treatments (2014), Magn Reson Med, 72(3), 793-9.
2. McDannold et al., Magnetic resonance acoustic radiation force imaging (2008), Med Phys, 35(8), 3748-3758.
3. Bitton et al., Toward MR-guided high intensity focused ultrasound for presurgical localization: focused ultrasound lesions in cadaveric breast tissue (2012), MRI 35(5), 1089-1097.
4. Odeen et al., Multiple-point magnetic resonance acoustic radiation force imaging, Magn Reson Med, 2018:1-14.
Figures