0798
Residual magnetization of human subjects after exposure to magnetic fields1SIr Peter Mansfield Imaging Centre, School of Physics and Astronomy, University of Nottingham, Nottingham, United Kingdom
Synopsis
It is known that subjects who have recently had an MRI scan can produce greater "magnetic noise" in magnetoencephalography (MEG) studies. We investigated this phenomenon, which may be related to remanent magnetization of magnetite particles that have been identified in post mortem tissue, by analyzing the field variation produced by controlled head movements in a MEG scanner, before and after subjects had been exposed to the local magnetic field of a small permanent magnet or inserted in a 3T magnet. The results show significant variability across subjects, but with a general elevation of the measured field variation after field exposure.
Introduction
A common, but unexplained, anecdotal observation from neuroimaging studies is that “magnetic noise” in magnetoencephalography (MEG) experiments is elevated when subjects have had a recent MRI scan [1]. It has been shown in experiments on post mortem samples, that human tissue, including brain tissue, display isothermal remanent magnetization [2-4] – i.e. tissue that has been exposed to a magnetic field maintains a weak residual magnetization even when the applied magnetic field is removed. This effect has been related to the presence of biogenic magnetite particles which display a remanent magnetization that can persist over days. Interest in this effect has been increased by the suggestion that magnetite levels are elevated in post mortem brain samples affected by Alzheimer’s disease [5]. The elevated magnetic noise in MEG experiments [1], which can persist for a few days after an MRI scan, could result from remanent magnetization induced in biogenic or anthropogenic [6] magnetite by exposure to the magnetic field of the MRI scanner [7] . To investigate these effects, we have measured the field perturbations generated by head movement inside an MEG scanner, before and after controlled exposure to magnetic fields.Methods
Measurements were made on 5 subjects (age 40±17;2F) using a 275-channel cryogenic MEG system (CTF, BC, Canada) with a 600 Hz sampling frequency, while head movement was monitored at 120 Hz using a dual infra-red camera system (NaturalPoint Inc., Corvallis) and a small reflective marker attached to the chin. Recordings were made over 60s-periods with the subject instructed to: (i) keep still; (ii) repeatedly shake his/her head; repeatedly nod his/her head. Subjects wore scrubs and removed jewelry and make-up as would be the case in a standard MEG experiment. Recordings were made: (A) before the subject was exposed to any magnetic field; (B) then after a cylindrical 0.5T NdFeB permanent magnet (7 cm dia. 6 cm height) had been applied to the back of the subject’s head for around 20 s; (C) and then, immediately after the subject had spent ~20 s in the bore of a 3T MRI scanner (moved into and out of scanner while lying supine on the scanner bed).
MEG and motion capture data were temporally aligned, filtered and down-sampled to a 60 Hz sampling rate. We assessed the standard deviation of the fields measured on the different channels for the different experimental conditions, as a measure of the size of the field fluctuations produced by head movements. We also cross-correlated the measured field variation with the dominant motion parameter (up down for nod and left-right for shake) and identified the sensors in which the maximum cross-correlation was greater than 0.75, so as to test whether the measured field fluctuations were coherent with the head movements. Data are reported using the standard channel groupings (Temporal, Central, Frontal and Occipital) which are based on the sensors’ locations relative to the head (Fig. 1).
Results
Figure 2 shows plots of the field variation measured on five occipital sensors along with the up-down movement, when Subject 2 executed head nods in the three different conditions (A-C). Field variations of up to 5 pT which are coherent with the head movements are evident in the measurements made after exposure to the magnetic fields. Smaller variations (less than 1 pT) can be seen in the pre-magnetisation measurements. Figure 3 shows histograms indicating the average over sensors of the temporal standard deviation of the field measurements in the different sensor groups for the different subjects and conditions. Figure 4 shows the numbers of sensors in the different groups which display a correlation coefficient that is greater than 0.75.Discussion
The results indicate that there is significant variability in the fields produced by different subjects, and that some subjects show significant effects before being exposed to magnetic fields, but on average the measured effects increase following exposure to the permanent magnet, particularly in the occipital sensors which are closest to the site on the head where the magnet was applied, and become more widespread after exposure to the 3T magnet. In particular, the mean across subjects of the standard deviations increases in all sensor groups for head nodding and shaking after exposure to the permanent magnet, and increases further after 3T exposure in all sensor groups except the occipital sensors. There are no coherent differences in the measurements made with the stationary subjects. These observations are consistent with the presence of remanent head magnetization after magnetic field exposure, but further work is needed to identify the tissues in which this magnetization resides and to measure its lifetime.Acknowledgements
This work is supported by the Oxford/Nottingham Biomedical Imaging CDT which is funded by EPSRC and MRC.References
1. Gross, J., S. Baillet, G.R. Barnes, R.N. Henson, A. Hillebrand, O. Jensen, K. Jerbi, V. Litvak, B. Maess, R. Oostenveld, L. Parkkonen, J.R. Taylor, V. van Wassenhove, M. Wibral, and J.M. Schoffelen, Good practice for conducting and reporting MEG research. Neuroimage, 2013. 65: p. 349-363. 2. Gilder, S.A., M. Wack, L. Kaub, S.C. Roud, N. Petersen, H. Heinsen, P. Hillenbrand, S. Milz, and C. Schmitz, Distribution of magnetic remanence carriers in the human brain. Scientific Reports, 2018. 8.
3. Dunn, J.R., M. Fuller, J. Zoeger, J. Dobson, F. Heller, J. Hammann, E. Caine, and B.M. Moskowitz, MAGNETIC MATERIAL IN THE HUMAN HIPPOCAMPUS. Brain Research Bulletin, 1995. 36(2): p. 149-153.
4. Kirschvink, J.L., A. Kobayashikirschvink, and B.J. Woodford, MAGNETITE BIOMINERALIZATION IN THE HUMAN BRAIN. Proceedings of the National Academy of Sciences of the United States of America, 1992. 89(16): p. 7683-7687.
5. Pankhurst, Q., D. Hautot, N. Khan, and J. Dobson, Increased levels of magnetic iron compounds in Alzheimer's Disease. Journal of Alzheimers Disease, 2008. 13(1): p. 49-52.
6. Maher, B.A., I.A.M. Ahmed, V. Karloukovski, D.A. MacLaren, P.G. Foulds, D. Allsop, D.M.A. Mann, R. Torres-Jardon, and L. Calderon-Garciduenas, Magnetite pollution nanoparticles in the human brain. Proceedings of the National Academy of Sciences of the United States of America, 2016. 113(39): p. 10797-10801.
7. S., K. and C. D., Using DCMEG to non-invasively measure strongly magnetic particles in the living brain. , in Biomag 2018 2018 p. 438599.
Figures
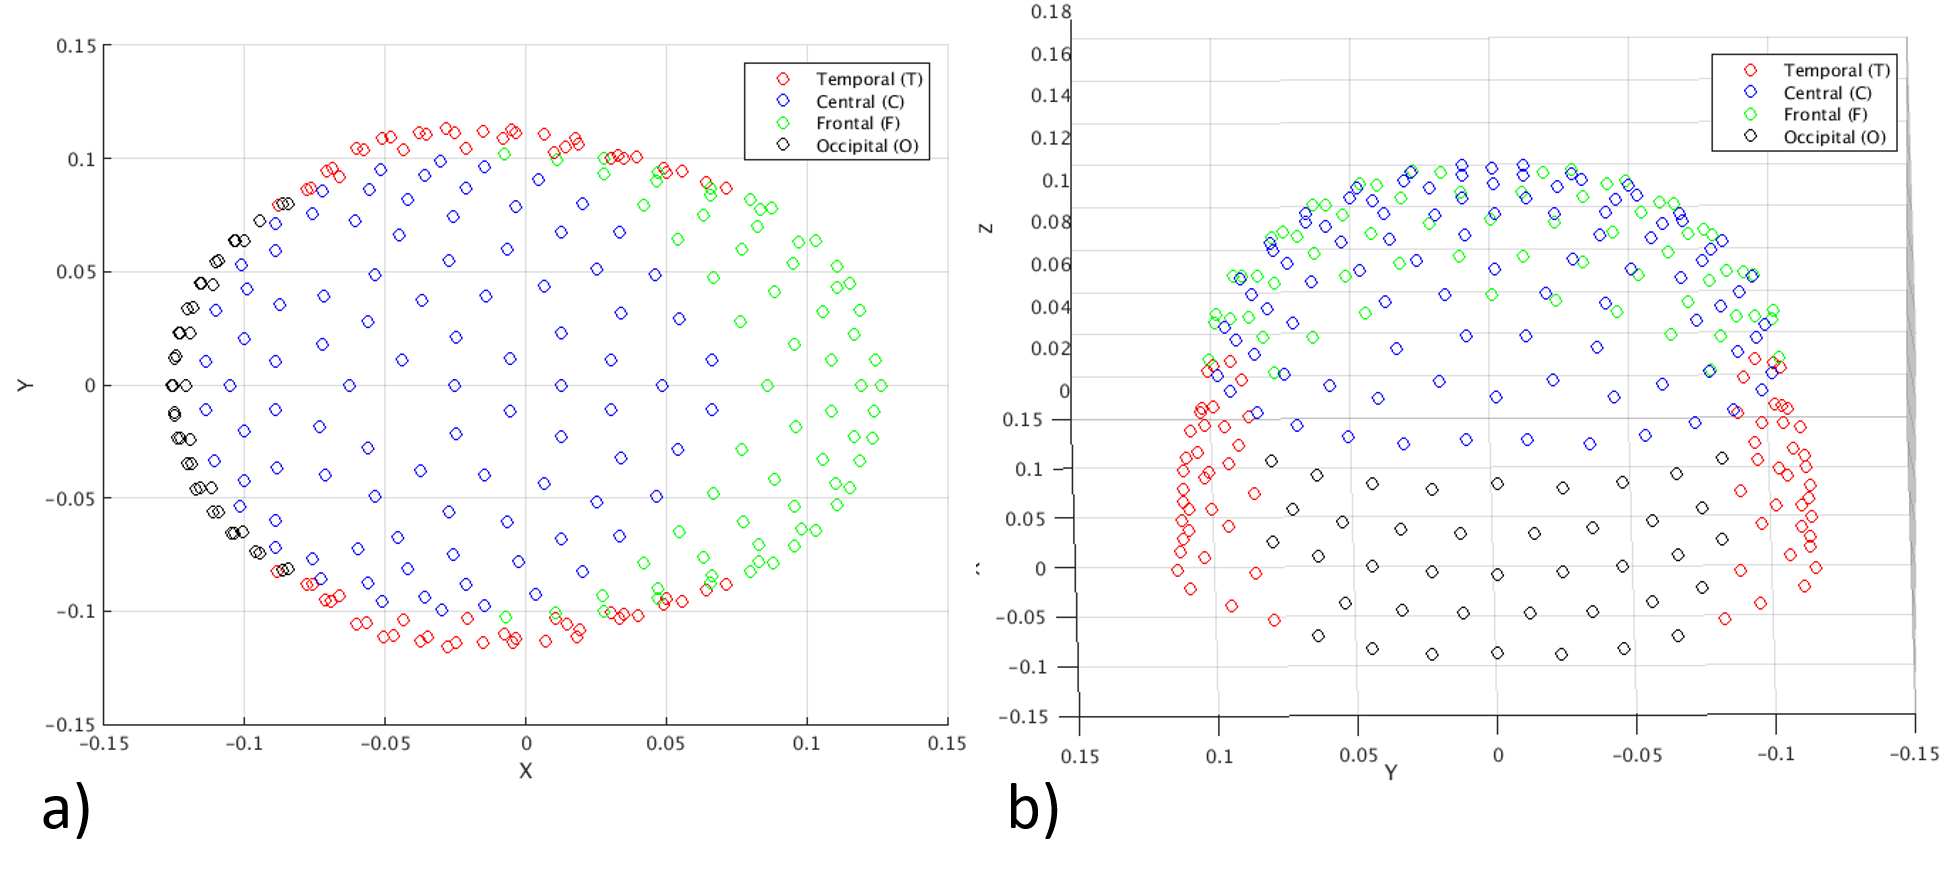

Figure 2 Plots of the field variation (in fT) measured on five occipital sensors (Rows 1- 5), along with the the up-down motion parameter measured using the infra-red camera (Row 6), when Subject 2 executed head nods in the three different conditions (A [before magnetization]= blue; B [after exposure to permanent magnet] = black; C [after exposure to 3T magnet] = green)

