0787
Assessment of postinfarct myocardium metabolic degradation with amide proton transfer magnetic resonance imaging at 3 Tesla1Paul C. Lauterbur Research Center for Biomedical Imaging, Shenzhen Institutes of Advanced Technology, Chinese Academy of Sciences, Shenzhen, China, 2Department of Radiology, West China Hospital, Sichuan University, Chengdu, China, 3Department of Cardiology, West China Hospital, Sichuan University, Chengdu, China, 4Department of Radiology, West China Second Hospital, Sichuan University, Chengdu, China
Synopsis
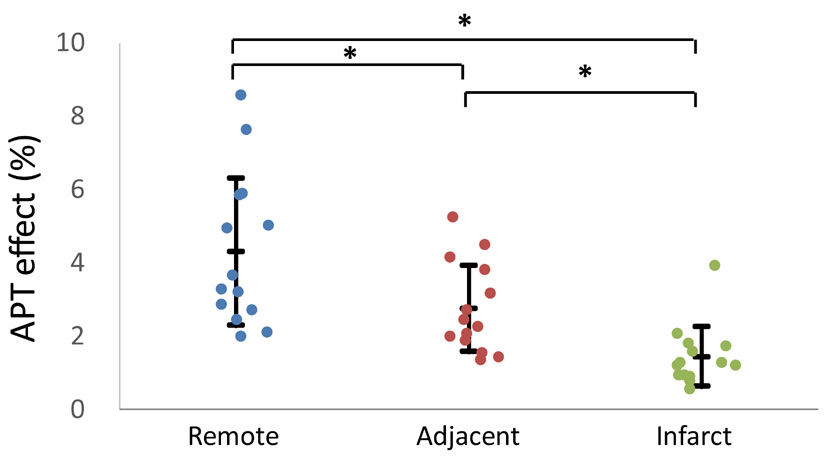
Myocardium ischemia irritates a series of metabolic degradations, including intracellular acidosis and cell damage. Amide proton transfer (APT) effect is associated with microenvironment acidosis and amide protons inside of cytoplasm. In this study, APT imaging was performed on MI patients at 3 Tesla. Results show significant APT effect reduction from the remote (4.29±2.00%), adjacent (2.74±1.18%) to the infarct (1.43±0.80%) regions (P<0.05), implying progressively metabolic alterations from surrounding tissue to the infarct core. The method provides a novel way for noninvasive assessment of myocardium metabolic degradation postinfarction, promising to facilitate therapeutic decision and treatment evaluation.
Introduction
Myocardial infarction (MI) is a dynamic process that begins with the transition from reversible to irreversible ischemic injury and culminates in the replacement of dead myocardium by a fibrous scar [1]. Many biochemical and metabolic changes have been observed early after the onset of ischemia. Specifically, intracellular acidification is a general feature of the ischemic myocardium and a result of accompanying anaerobic metabolism [2]. Disruption of the cell membrane is another major cellular change occurring with MI, leading to loss of the cytoplasmic contents [3]. In recently years, amide proton transfer (APT) imaging has shown to be valuable in characterization of tissue acidosis following ischemic insults. In addition, APT effect is strongly related with the concentration of amide protons in protein and peptide. In this study, APT imaging was performed to evaluate myocardium metabolic degradation on MI patients at 3 Tesla (T) for the first time.Materials and methods
Patient recruitment: The study was approved by the local ethics committee. We prospectively enrolled 18 patients (15 males, 55.8±9.6 years) with 1st time ST-segment elevation MI. All patients received primary percutaneous coronary intervention within 12 hours, and no other treatments were conducted. Informed consent was obtained from each subject before MR imaging on a 3T scanner (Skyra, Siemens).
MR study: Single-slice pulsed-RF CEST scans were performed using a gradient echo readout at the short-axis plane covering suspected infarction determined from scout imaging (1.5×1.5×8.0 mm3, TR/TE = 288/2.82 ms, flip angle = 13°, iPAT = 3). Five saturation pulses with average RF irradiation amplitude of 1.5 μT were applied in the CEST preparation module (pulse duration = 99 ms, inter-pulse delay = 30 ms). Data was acquired at the quiescent period of the end-systolic cardiac phase. In addition to a reference scan without RF irradiation, 35 CEST-weighted images were collected (± 5 ppm with intervals of 0.29 ppm). ECG triggering and breathhold were required during data acquisition. LGE imaging was conducted 10-15 minutes after gadolinium injection using phase sensitive inversion recovery technique.
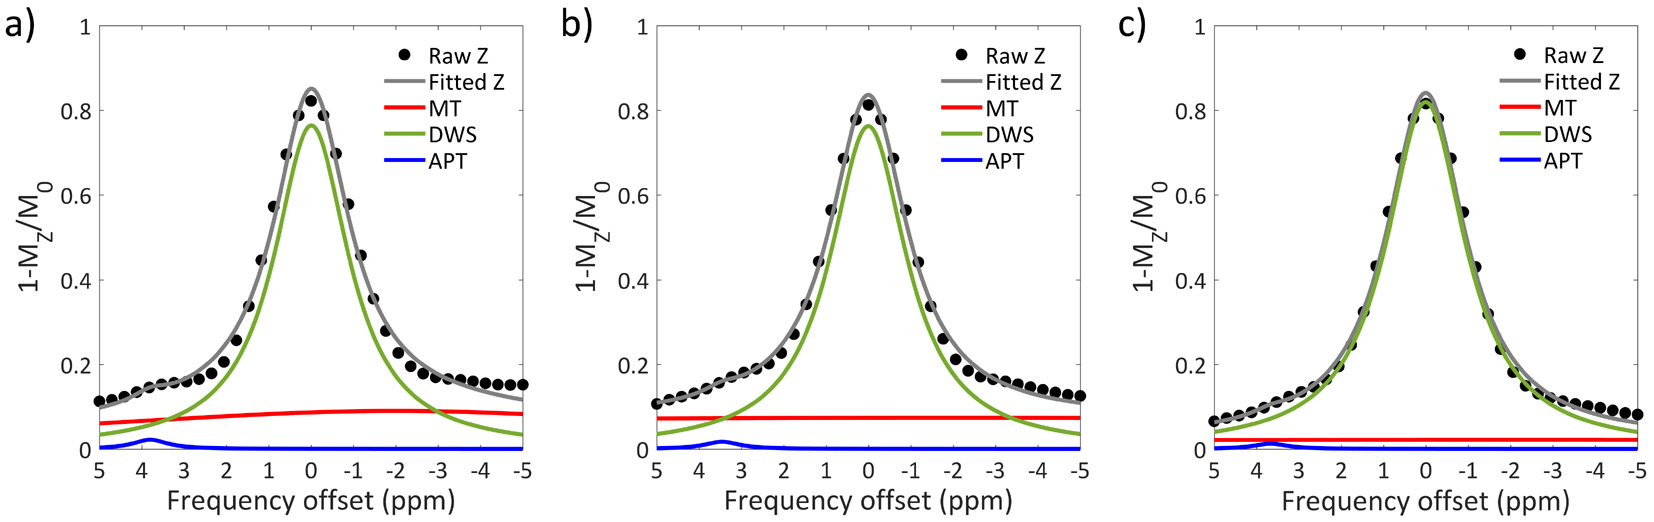
Data analysis: CEST images were first co-registered using an approach of minimizing residual complexity [4] with the unsaturated image (M0) as reference. Pixel-wised Z-spectrum (MZ) was interpolated by smoothing splines, and corrected for B0 inhomogeneity [5, 6]. Then, the normalized Z-spectrum was flipped as Z(ω) = 1-Mz/M0 and fitted using a three-pool Lorentzian model [7],
Z(ω) = ΣLi(ω) (1)
where, Li is the Lorentzian spectrum of the ith pool. Saturation transfer effects of MT, DWS and APT were included with their chemical shifts at -1.5, 0 and 3.5 ppm, respectively [8],
L(ω) = A/(1+4·((ω-ω0)/lw)2) (2)
where, ω is the frequency offset related to water resonance; and A, ω0 and lw are the amplitude, center frequency offset, and line width of the ith saturation transfer effect, respectively. The amplitude of the APT pool is defined as the APT effect. ROIs were placed in the infarct, adjacent, and remote myocardium with LGE as reference. APT effect was measured in each region and averaged among all patients. One-way ANOVA was performed with P<0.05 as statistical significance.
Results
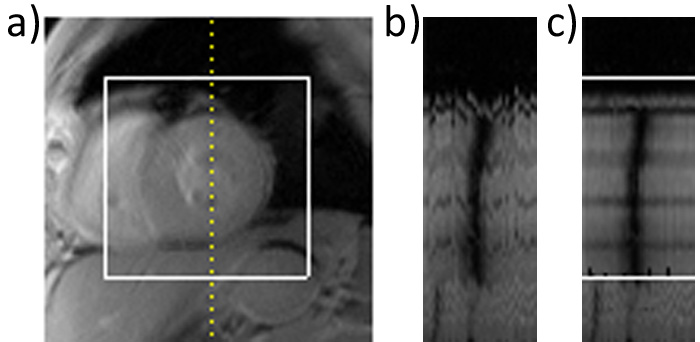
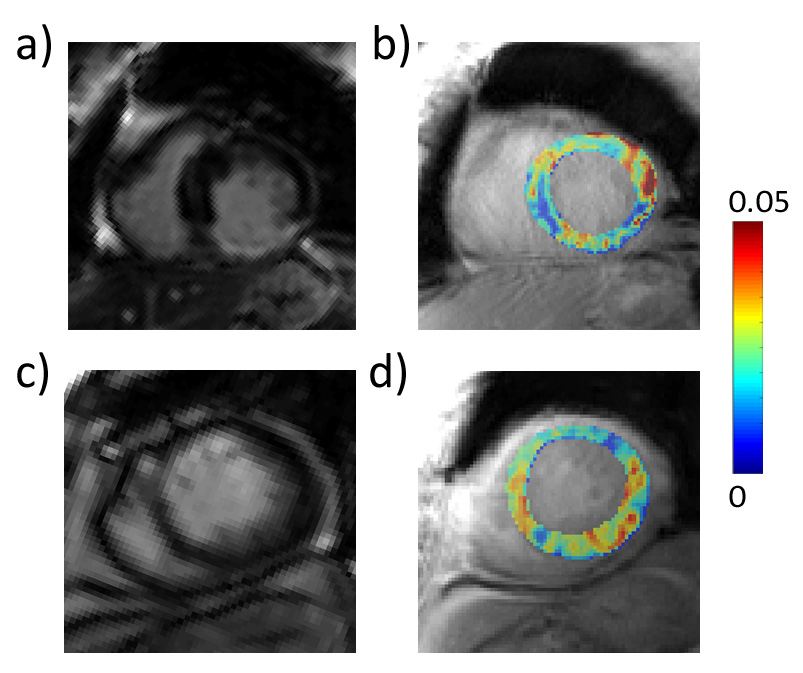
Among the 18 cardiac patients, four patients were excluded from the study due to poor breathhold performance or nonapparent LGE enhancement. Figure 1a shows the CEST signal intensity profile of a vertical line (yellow dot line) drawn through the LV stacked for each frequency offset. Clear jitter arising from heart motion (Fig. 1b) was found to be effectively corrected after image registration (Fig. 1c). Effects of MT, DWS and APT were resolved with a three-pool Lorentzian fitting model (Fig. 2), and the amplitude of the APT pool (i.e., APT effect) was found to gradually reduce from the remote, adjacent to the infarct region. Figure 3 displays post-contrast LGEs and respective APT maps overlaid on CEST-weighted images in two representative MI patients with different infarct location. APT effect shows noticeable negative contrast in the scar region as indicated in the LGE image in both patients. Quantitatively, the average APT effect among all patients was found to significantly progressively decrease from the remote (4.29±2.00%), adjacent (2.74±1.18%), to infarct (1.43±0.80%, P<0.05) regions.Conclusion
The current study measured APT effect in infarct hearts for the first time and showed significant alterations in infarct myocardium and its border zone with compared to remote tissue in a cohort of MI patients at 3T. The method provides a novel way for noninvasive assessment of myocardium metabolic degradation postinfarction, promising to facilitate therapeutic decision and treatment evaluation.Acknowledgements
Grant Support: National Natural Science Foundation of China (81571668 and 81871348), National Basic Research Program of China (2015CB755500), Guangdong Special Support Program (2016TQ03R272), and Shenzhen Science and Technology Program (GJHZ20160229200622417, JCYJ20170307165550864 and JCYJ20170413161350892).References
[1] Jennings RB, Steenbergen C, Jr., Reimer KA. Myocardial ischemia and reperfusion. Monogr Pathol 1995;37:47-80.
[2] Dennis SC, Gevers W, Opie LH. Protons in ischemia: where do they come from; where do they go to? J Mol Cell Cardiol 1991;23:1077-86
[3] Elmore S. Apoptosis: a review of programmed cell death. Toxicol Pathol 2007;35:495-516
[4] Myronenko A, Song X. Intensity-Based Image Registration by Minimizing Residual Complexity. IEEE Transactions on Medical Imaging 2010;29:1882-1891
[5] Stancanello J, Terreno E, Castelli DD, Cabella C, Uggeri F, Aime S. Development and validation of a smoothing-splines-based correction method for improving the analysis of CEST-MR images. Contrast Media Mol Imaging 2008;3:136-49
[6] Kim M, Gillen J, Landman BA, Zhou J, van Zijl PCM. Water saturation shift referencing (WASSR) for chemical exchange saturation transfer (CEST) experiments. Magn Reson Med 2009;61:1441-1450
[7] Nuclear magnetic resonance methods for determining chemical-exchange rates. J Am Chem Soc 1966;88:3185
[8] Cai K, Singh A, Poptani H et al. CEST signal at 2 ppm (CEST@2ppm) from Z-spectral fitting correlates with creatine distribution in brain tumor. NMR Biomed 2015;28:1-8
Figures