0785
Fully Self-Gated Cardiac and Respiratory Motion-Resolved Isotropic 5D T1 Mapping of the Heart: Preliminary Results1Department of Radiology, Lausanne University Hospital (CHUV) and University of Lausanne (UNIL), Lausanne, Switzerland, 2Center for Biomedical Imaging (CIBM), Lausanne, Switzerland, 3Advanced Clinical Imaging Technology, Siemens Healthcare AG, Lausanne, Switzerland, 4LTS5, École Polytechnique Fédérale de Lausanne (EPFL), Lausanne, Switzerland
Synopsis
Current solutions for T1 mapping rely on 2D images of the heart, and require time-inefficient cardiac gating as well as long breath-holds. To address these drawbacks, a Free-running framework for fully self-gated cardiac and respiratory motion-resolved 5D imaging of the heart was extended to include T1 recovery contrast as a 6th dimension. The framework was tested at 3T in an ISMRM-NIST phantom and demonstrated good agreement between the estimated T1 values and reference standard. Preliminary 3D T1 maps in 3 healthy volunteers showed good resolution of the physiological motion and accurate T1 values of the myocardium and blood.
Introduction
Over the last decade, the quantification of T1 relaxation time in the myocardium has become increasingly accepted in clinical routine for monitoring disease progression and therapy response.1 However, most T1 mapping solutions provide 2D images of the heart and require ECG-triggered cardiac gating as well as long breath-holds to avoid motion blurring.2,3 In this work, a Free-running framework for cardiac-and-respiratory-motion-resolved 5D imaging of the heart4,5 was extended to include T1 recovery contrast as the 6th dimension. Here we propose an approach that preserves the self-gating and ease-of-use characteristics of the Free-running framework while providing isotropic T1 maps of the whole-heart.Methods
Acquisition: A prototype Free-running 3D radial sequence with a Phyllotaxis trajectory5,6 was modified to acquire gradient-recalled echoes (GRE) and to play out a 180° pulse every 880 readouts. This sequence continuously acquired data independently of the cardiac and respiratory cycles. The trajectory was subdivided into segments of 22 readouts each. Consecutive segments were rotated by the golden angle, and each started with a readout oriented along the superior-inferior (SI) direction for physiological motion signal extraction. Acquisitions were performed on a clinical 3T scanner (MAGNETOM Prismafit, Siemens Healthcare, Erlangen, Germany) with the following parameters: matrix (112)3, isotropic spatial resolution (1.96mm)3, TE/TR=1.48/3.41ms, flip angle (FA)=5°, inversion pulse every 3s, 261140 total readouts acquired over 17min.
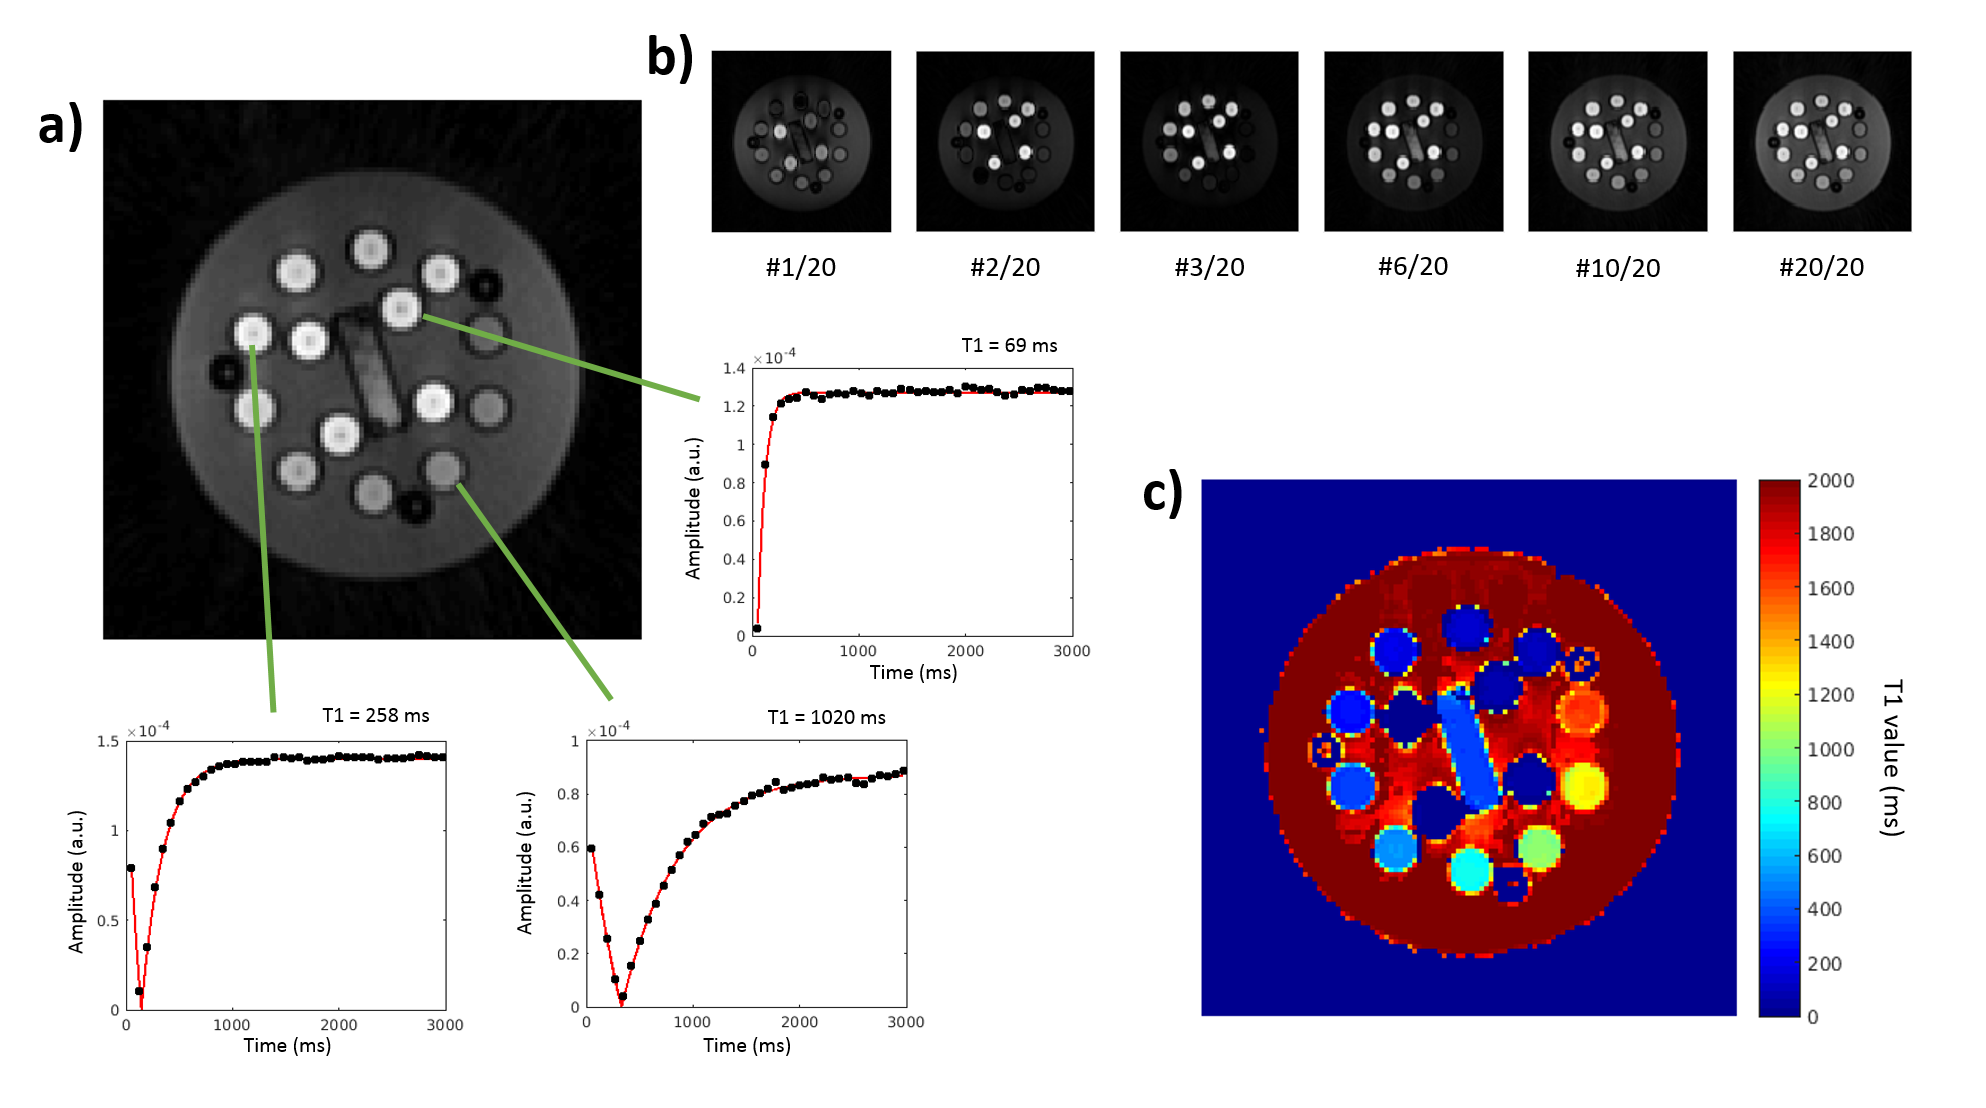
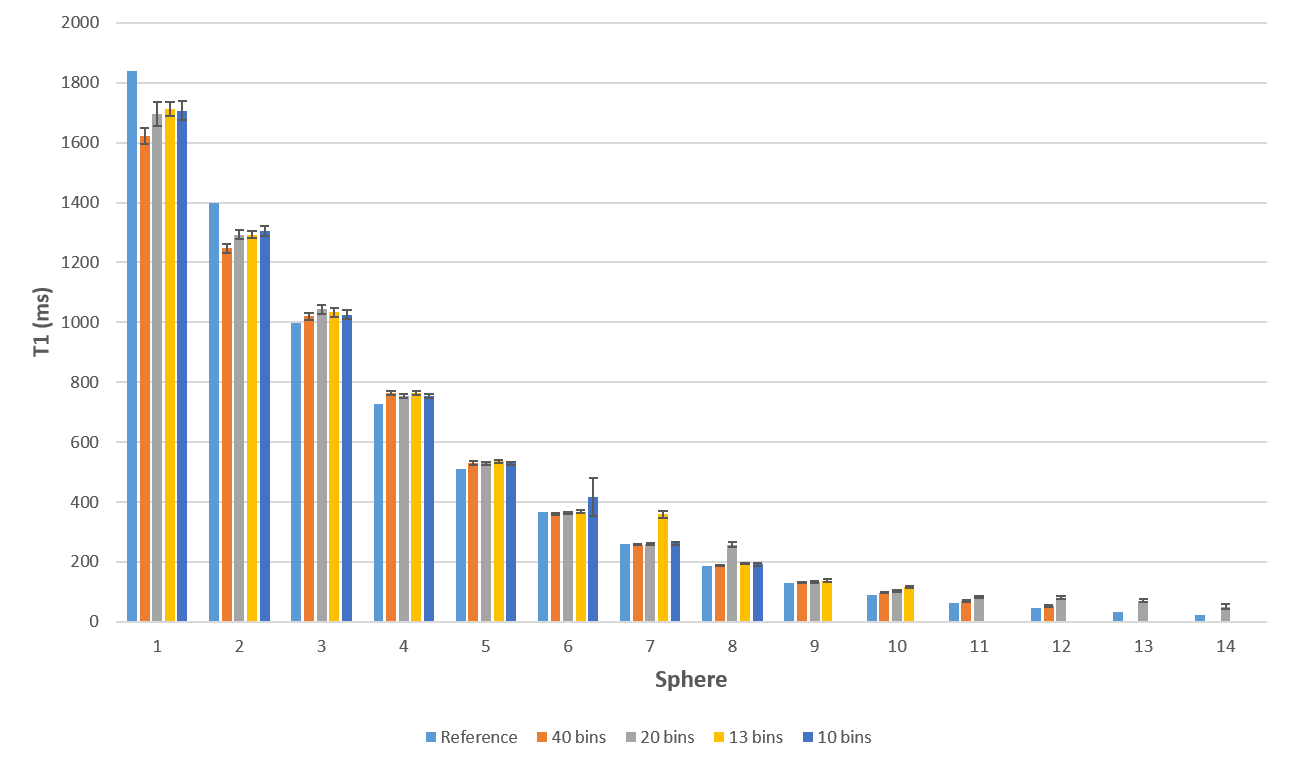
Map reconstruction and phantom calibration: The sequence was first tested on an ISMRM-NIST quantitative MRI phantom7 with 14 spheres with different T1 values. The inversion time (TI) was used to bin the data with 4 different temporal resolutions (75, 150, 225, 300ms) to assess the effect of the bin width on the T1 estimation. 4D gridding reconstructions (x-y-z-TI) were performed, with 40, 20, 13, and 10 bins equally spaced along the magnetization recovery dimension. A pixel-by-pixel 3-parameter fit of the signal S was performed as: $$y\left(t\right)=a\left[1-be^{-\frac{t}{T_1^*}}\right]$$ to extract T1* values. T1 was estimated from T1* by correcting for the GRE pulse train:8 $$T_{1}=\left[\frac{1}{T_1^*}+\frac{\log\left(\cos\left(FA\right)\right)}{TR}\right]^{-1}$$ The coefficient of determination R2 of the fit was retained to discard unreliable T1 values estimations. The true FA in Eq.2 was determined once by matching the T1 values from regions of interest (ROIs) inside the 14 spheres to the reference values.
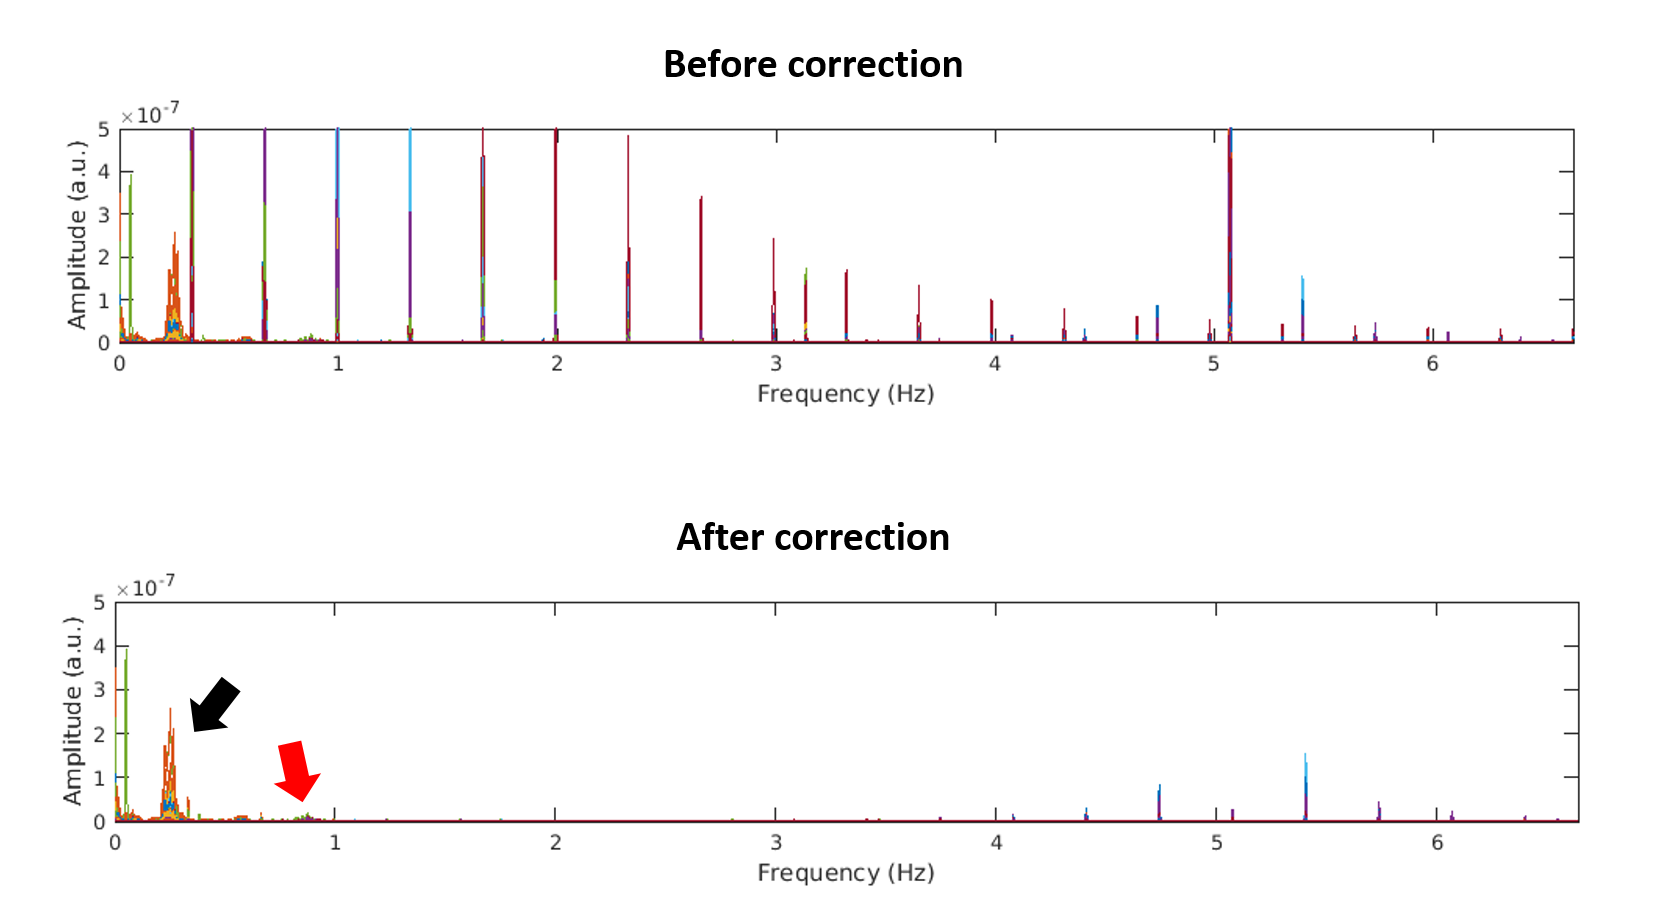
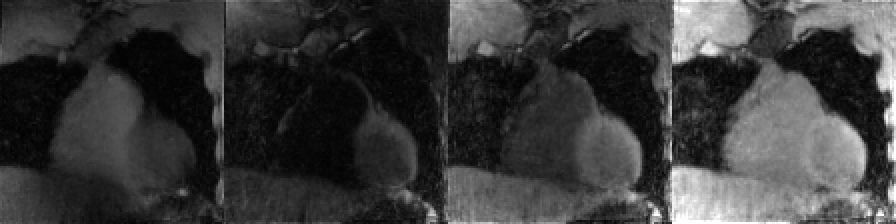
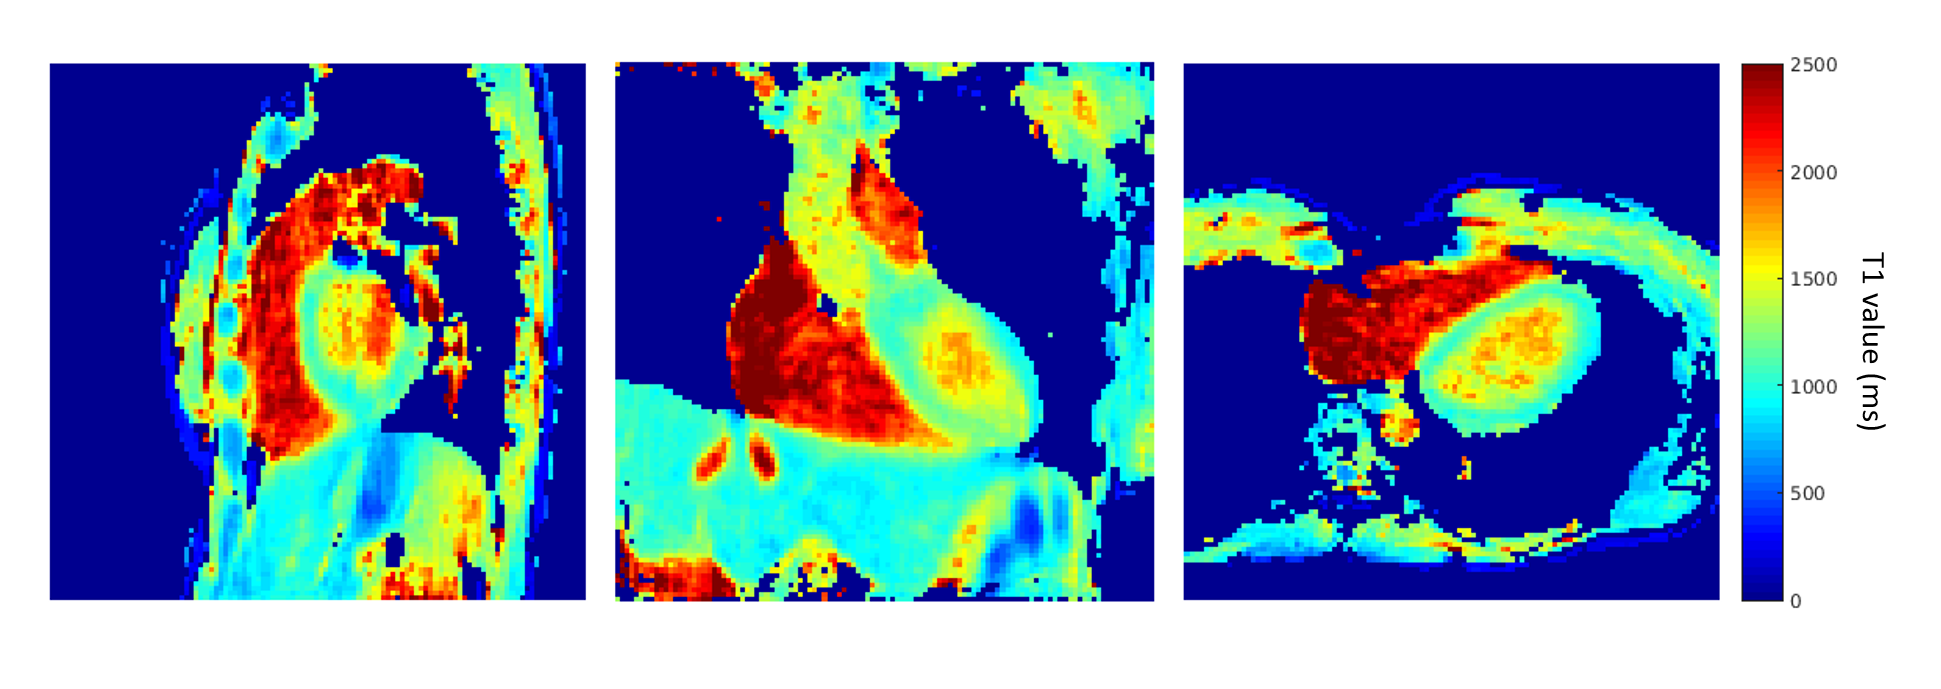
In vivo study and physiological signal extraction: The framework was applied in 3 healthy volunteers who provided written informed consent; the study was IRB approved. A fully self-gated motion extraction framework9 was adapted to correct for the changing contrast: SI readouts were Fourier transformed and filtered to remove signal amplitude oscillations. Principal component analysis (PCA) was then performed on the SI projections,10 and two components corresponding to respiratory and cardiac motion were selected. Physiological signals were used to bin the data into 3 respiratory states and into 10-12 cardiac bins with a temporal resolution of 100ms. The reconstruction of motion-and-contrast-resolved 6D images (x-y-z-cardiac-respiratory-TI) was performed using a k-t sparse SENSE algorithm.4 To improve SNR, respiratory motion states were registered to end-expiration and averaged together, after which T1 maps were generated for a cardiac bin in the diastolic resting phase. Mean and standard deviation of T1 values were estimated from ROIs in the blood pool and myocardium.
Results
The T1 values estimated in the NIST phantom were in good agreement (<15% difference) in the 100-1800ms range (Fig.1-2). Moreover, T1 accuracy did not change at the different temporal resolutions investigated for most T1 values. For this reason, the lowest temporal resolution (10 bins of 300 ms) was used for in vivo reconstruction. Nevertheless, the coefficients of determination R2 indicate that, for reconstructions with lower temporal resolution, the lowest T1 relaxation times (T1<100ms) could not be properly measured. The estimated true flip angle was 4.59°. Physiological motion signals were successfully extracted from all three in vivo datasets (Fig.3) and 6D images with 300-360 3D volumes were successfully reconstructed (Fig.4-5). T1 values estimated from myocardium (T1=1061±163ms) and the blood pool (T1=1634±211ms) agree with those found in previous studies.11Discussion and Conclusion
The Free running framework proposed for T1 mapping showed promising and accurate results in the phantom. The in vivo results presented here demonstrated the feasibility of adding a T1-recovery dimension to 5D imaging during a single uninterrupted isotropic acquisition of the heart, while the modified self-gating approach to motion estimation provided robust cardiac and respiratory motion information despite the changing contrast over time. Nevertheless, further work is required to find the optimal tradeoff between the temporal resolution and the undersampling of resolved bins, the regularization constraints of the compressed sensing reconstruction, as well as the best balance between the TR, the inversion pulses interval and the flip angle applied.Acknowledgements
No acknowledgement found.References
1. Messroghli DR, Moon JC, Ferreira VM, Grosse-Wortmann L, He T, Kellman P, Mascherbauer J, Nezafat R, Salerno M, Schelbert EB, Taylor AJ, Thompson R, Ugander M, van Heeswijk RB, Friedrich MG. Clinical recommendations for cardiovascular magnetic resonance mapping of T1, T2, T2* and extracellular volume: A consensus statement by the Society for Cardiovascular Magnetic Resonance (SCMR) endorsed by the European Association for Cardiovascular Imaging (EACVI). J Cardiovasc Magn Reson 2017;19(1):75.
2. Messroghli DR, Radjenovic A, Kozerke S, Higgins DM, Sivananthan MU, Ridgway JP. Modified Look-Locker inversion recovery (MOLLI) for high-resolution T1 mapping of the heart. Magnetic resonance in medicine 2004;52(1):141-146.
3. Chow K, Flewitt JA, Green JD, Pagano JJ, Friedrich MG, Thompson RB. Saturation recovery single-shot acquisition (SASHA) for myocardial T(1) mapping. Magnetic resonance in medicine 2014;71(6):2082-2095.
4. Feng L, Coppo S, Piccini D, Yerly J, Lim RP, Masci PG, Stuber M, Sodickson DK, Otazo R. 5D whole-heart sparse MRI. Magnetic resonance in medicine 2017.
5. Coppo S, Piccini D, Bonanno G, Chaptinel J, Vincenti G, Feliciano H, van Heeswijk RB, Schwitter J, Stuber M. Free-running 4D whole-heart self-navigated golden angle MRI: Initial results. Magnetic resonance in medicine 2015;74(5):1306-1316.
6. Piccini D, Littmann A, Nielles-Vallespin S, Zenge MO. Spiral phyllotaxis: the natural way to construct a 3D radial trajectory in MRI. Magnetic resonance in medicine 2011;66(4):1049-1056.
7. Keenan, K.E., et al. “Comparison of T1 measurements using ISMRM/NIST system phantom”. Proceedings of the International Society of Magnetic Resonance in Medicine, Singapore, 2016.
8. Wang X, Roeloffs V, Klosowski J, Tan Z, Voit D, Uecker M, Frahm J. Model-based T1 mapping with sparsity constraints using single-shot inversion-recovery radial FLASH. Magnetic resonance in medicine 2018;79(2):730-740.
9. L. Di Sopra, D. Piccini, S. Coppo, J. A.M. Bastiaansen, M. Stuber, and J. Yerly, “Motion-resolved 5d imaging of the heart: time to get rid of the ECG?,” in Proc. Intl. Soc. Mag. Reson. Med. 2017, 3148
10. Pang J, Sharif B, Fan Z, Bi X, Arsanjani R, Berman DS, Li D. ECG and navigator-free four-dimensional whole-heart coronary MRA for simultaneous visualization of cardiac anatomy and function. Magnetic resonance in medicine 2014;72(5):1208-1217.
11. Weingartner S, Messner NM, Budjan J, Lossnitzer D, Mattler U, Papavassiliu T, Zollner FG, Schad LR. Myocardial T1-mapping at 3T using saturation-recovery: reference values, precision and comparison with MOLLI. J Cardiovasc Magn Reson 2016;18(1):84.
Figures