0784
An Analysis of DiffNet Reconstruction Performance in Healthy and Infarcted Cardiac Diffusion Tensor Images1Radiological Sciences Laboratory, Stanford University, Stanford, CA, United States, 2Bioengineering, Stanford University, Stanford, CA, United States, 3University of Virginia, Charlottesville, VA, United States, 4Radiological Sciences, University of California - Los Angeles, Los Angeles, CA, United States
Synopsis
Cardiac diffusion tensor imaging (cDTI) suffers from low signal-to-noise ratios, which results in tensor variability. In order to decrease tensor variability, the number of diffusion directions or number of averages must increase, consequently increasing the scan time. Recent implementations of artificial neural network (ANN) have proven that a non-linear mapping between diffusion signals and tensors is possible and can decrease tensor variability without increasing scan time. We implement an ANN tensor reconstruction for ex vivo porcine hearts to evaluate if a robust ANN diffusion tensor reconstruction is a beneficial technique to decrease tensor variability at no cost in scan time.
Introduction
Diffusion tensor imaging (DTI) characterizes the microstructural organization of soft tissues such as the brain and the heart1. DTI poses several challenges, including long acquisition times, low signal-to-noise-ratios (SNR), and sensitivity to bulk physiologic motion2. Each of these limitations is intensified in cardiac applications and contribute to poor image quality and uncertainty in tensor invariant (shape) and orientation metrics. Two effective ways to reduce uncertainty in cardiac DTI (cDTI) are to either acquire more averages or increase the number of sampling directions, both of which can substantially increase scan times. To reduce uncertainty without increasing scan times, we propose to use a modified version of a previously described artificial neural network (ANN) based DTI reconstruction strategy3 (DiffNet) to improve reconstruction accuracy in accelerated cDTI scans using prospectively undersampled ex vivo data.Methods
Data Acquisition
Nine healthy and seven infarcted porcine hearts were imaged ex vivo on a 3T scanner (Prisma, Siemens) using a transmit/receive knee coil and evaluated at a voxel level (Ntotal=83,002). Two DTI datasets were acquired in each case: (1) A baseline scan (BL) with 2x2x8mm resolution, b=[0, 350s/mm2], TR=2000ms, 10 averages, and 12 directions to approximate the quality of an in vivo cDTI scan; and (2) A ground truth (GT) scan with 2x2x8mm resolution, b=[0, 350s/mm2], TR=7500ms, 10 averages, and 64 directions to provide a nearly ideal SNR and DTI reconstruction quality. The oversampled number of diffusion directions and longer TR in the GT acquisition compared to the BL acquisition increases the confidence in the reconstructed GT diffusion tensors.
Training of DiffNet
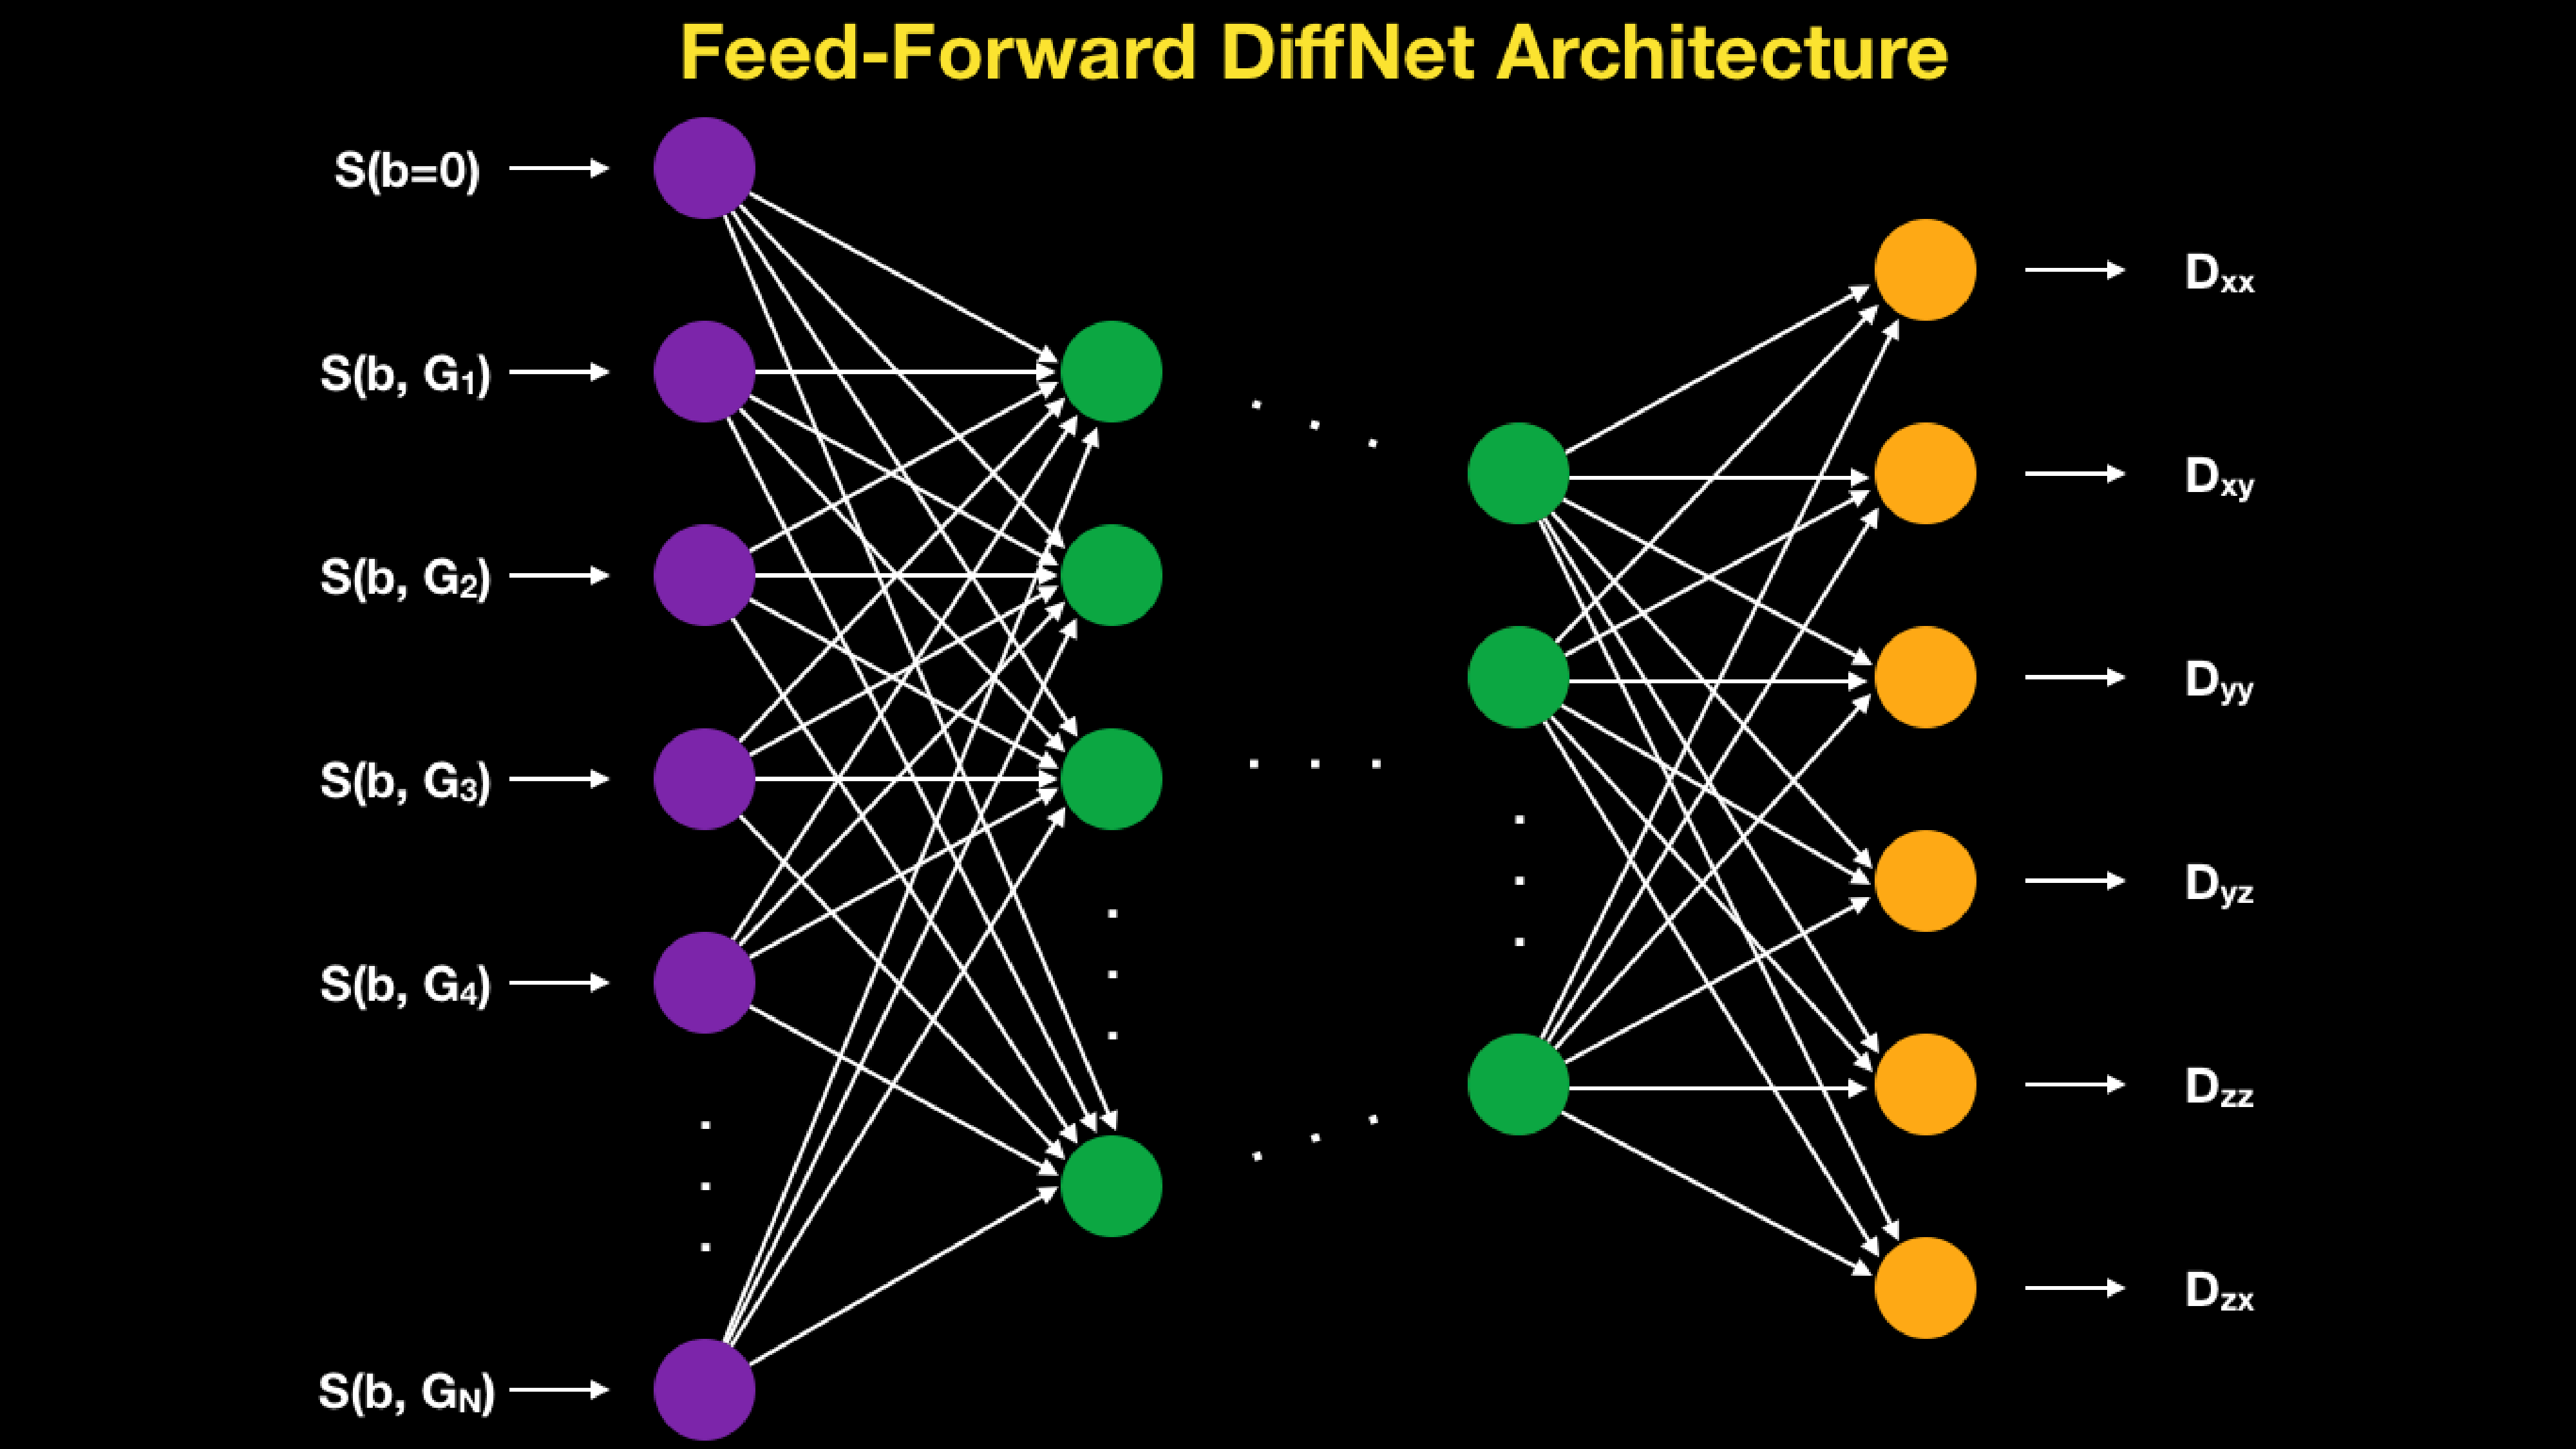
Left and right ventricles were segmented and vectors of BL diffusion weighted imaging (DWI) signals (b=0 plus 12 gradient directions for 10 averages) were fed pixel-wise through a feed-forward neural network and the reconstructed diffusion tensors (six distinct elements) were output at each pixel (DiffNet, Figure 1). DiffNet was implemented using Keras4 and tensorFlow5 libraries with three hidden layers (100, 75, and 25 nodes). DiffNet was trained to reproduce the GT tensors from the BL input data with minimal mean-squared error. The training dataset included N=50,593 training voxels from a mixture of healthy (seven entire volumes) and infarcted (four entire volumes) ventricles.
Validation of DiffNet
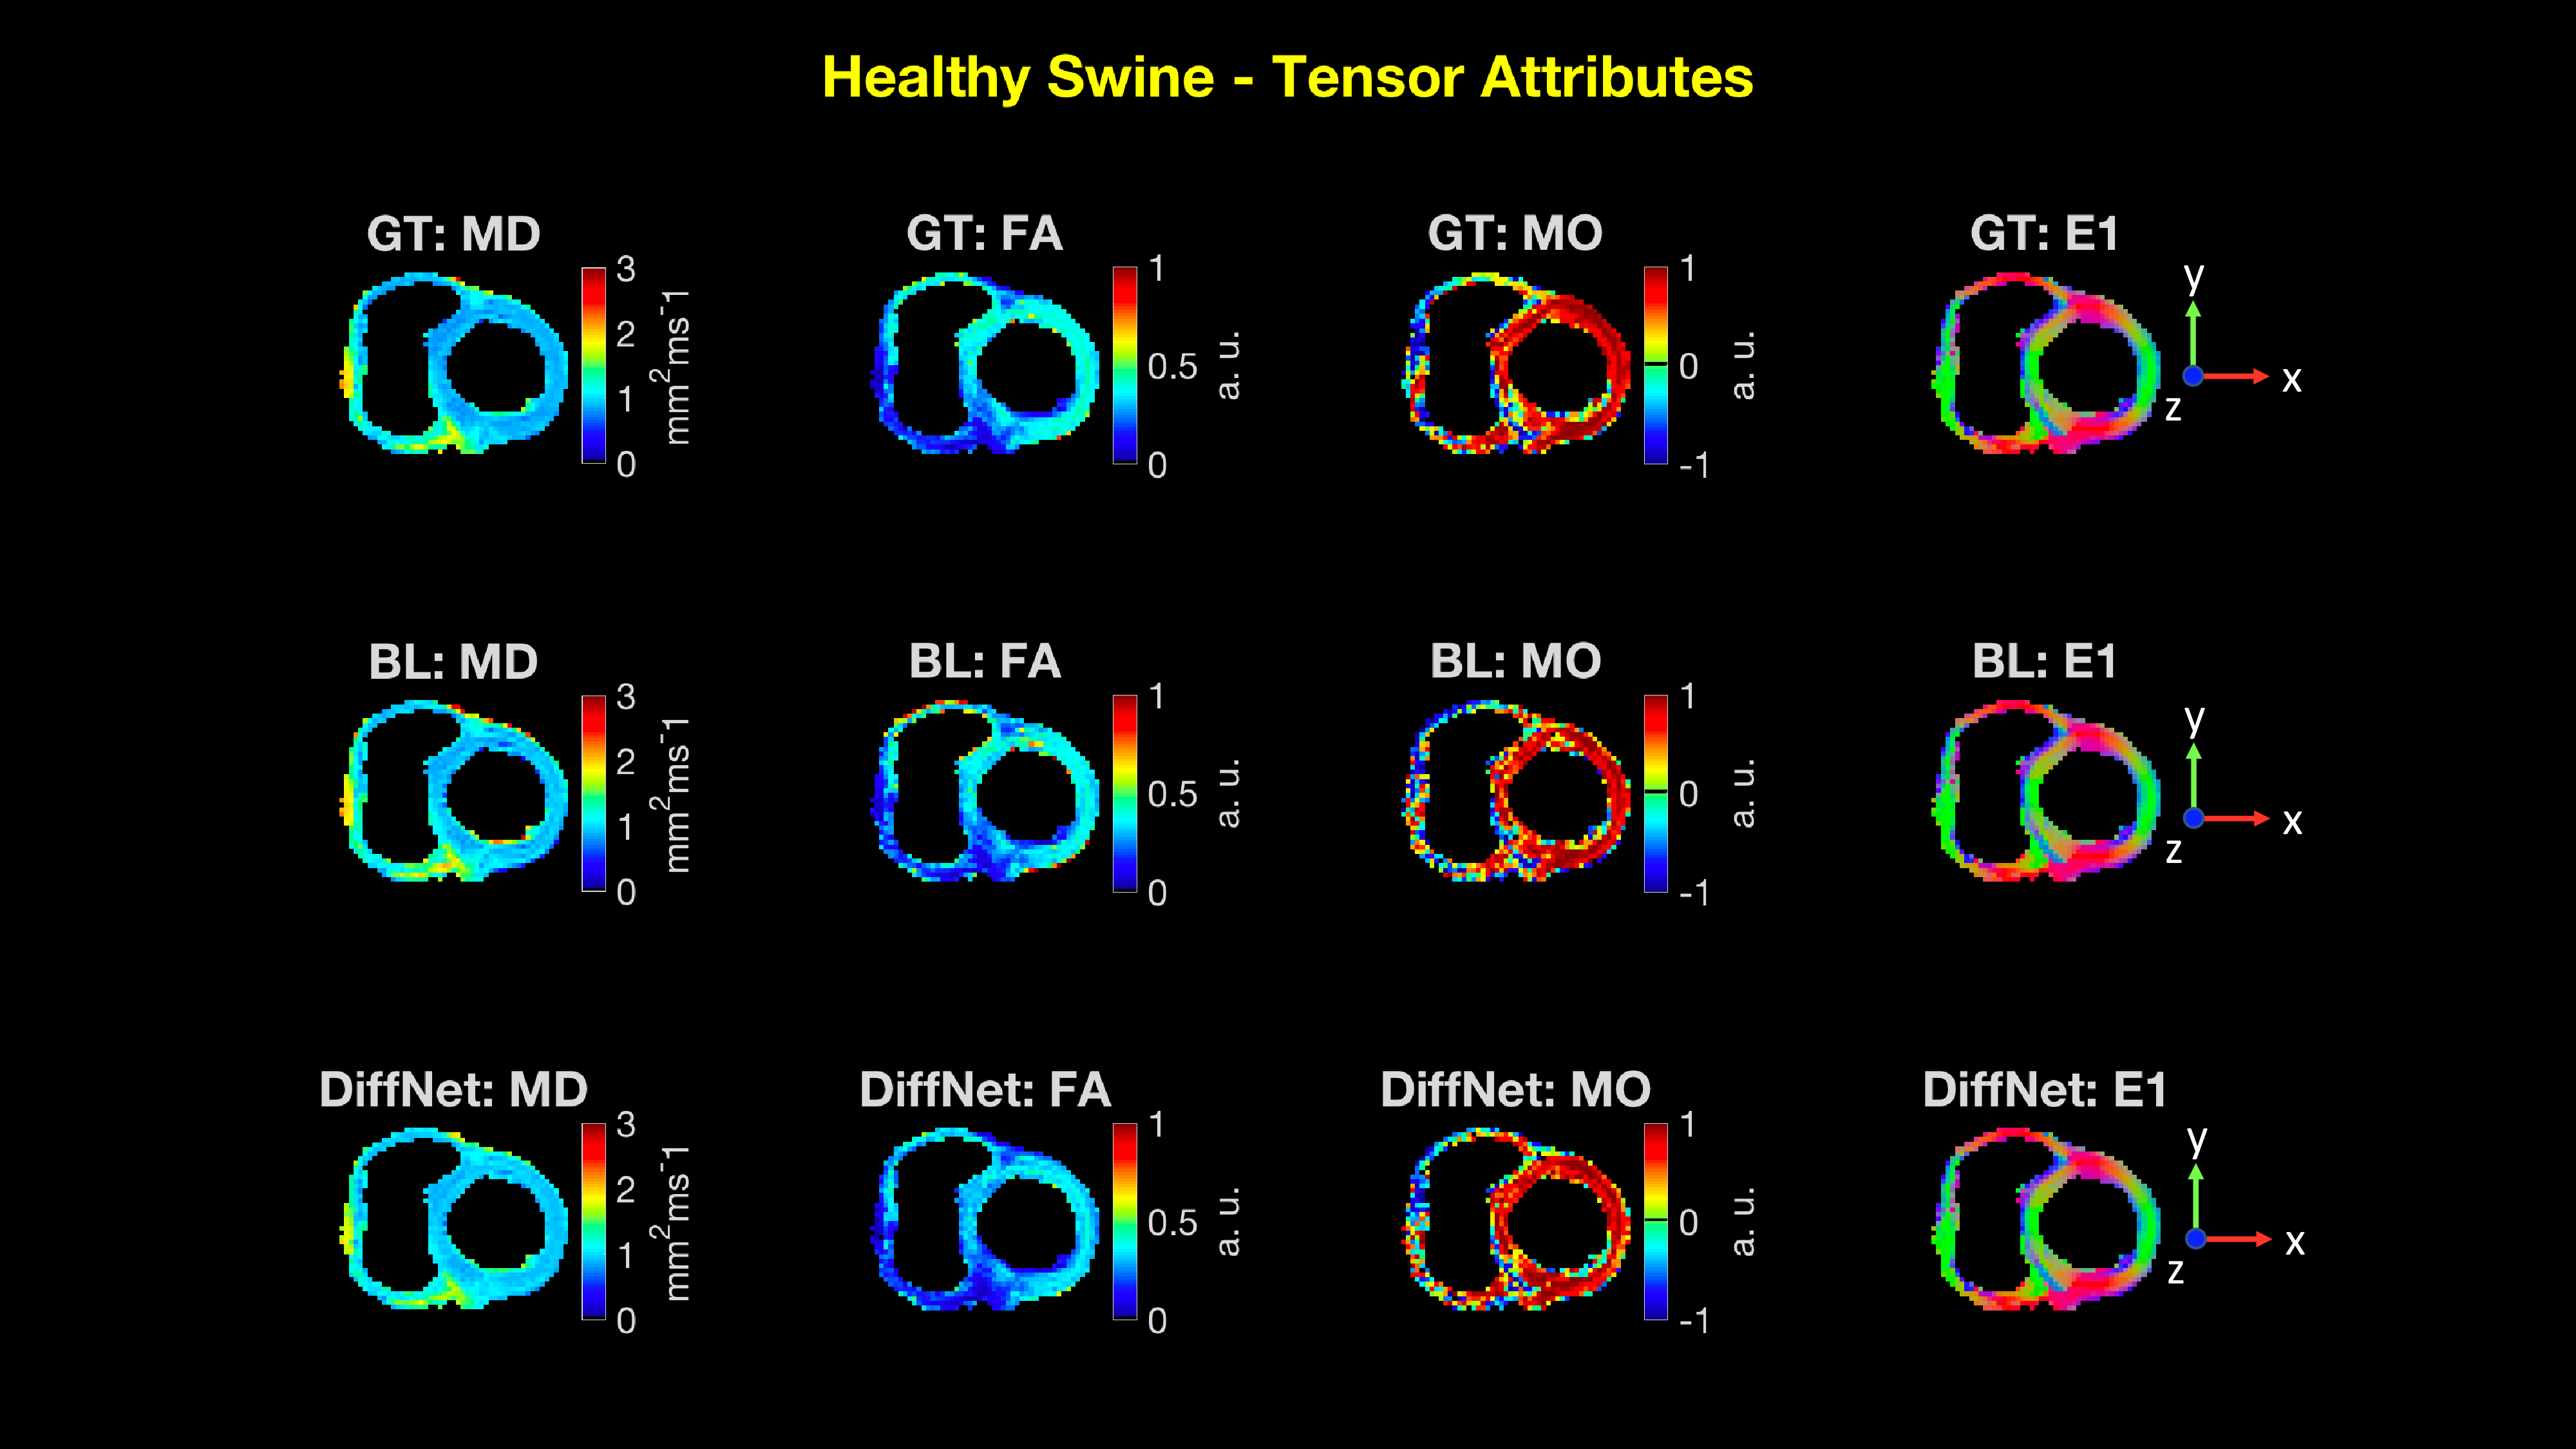
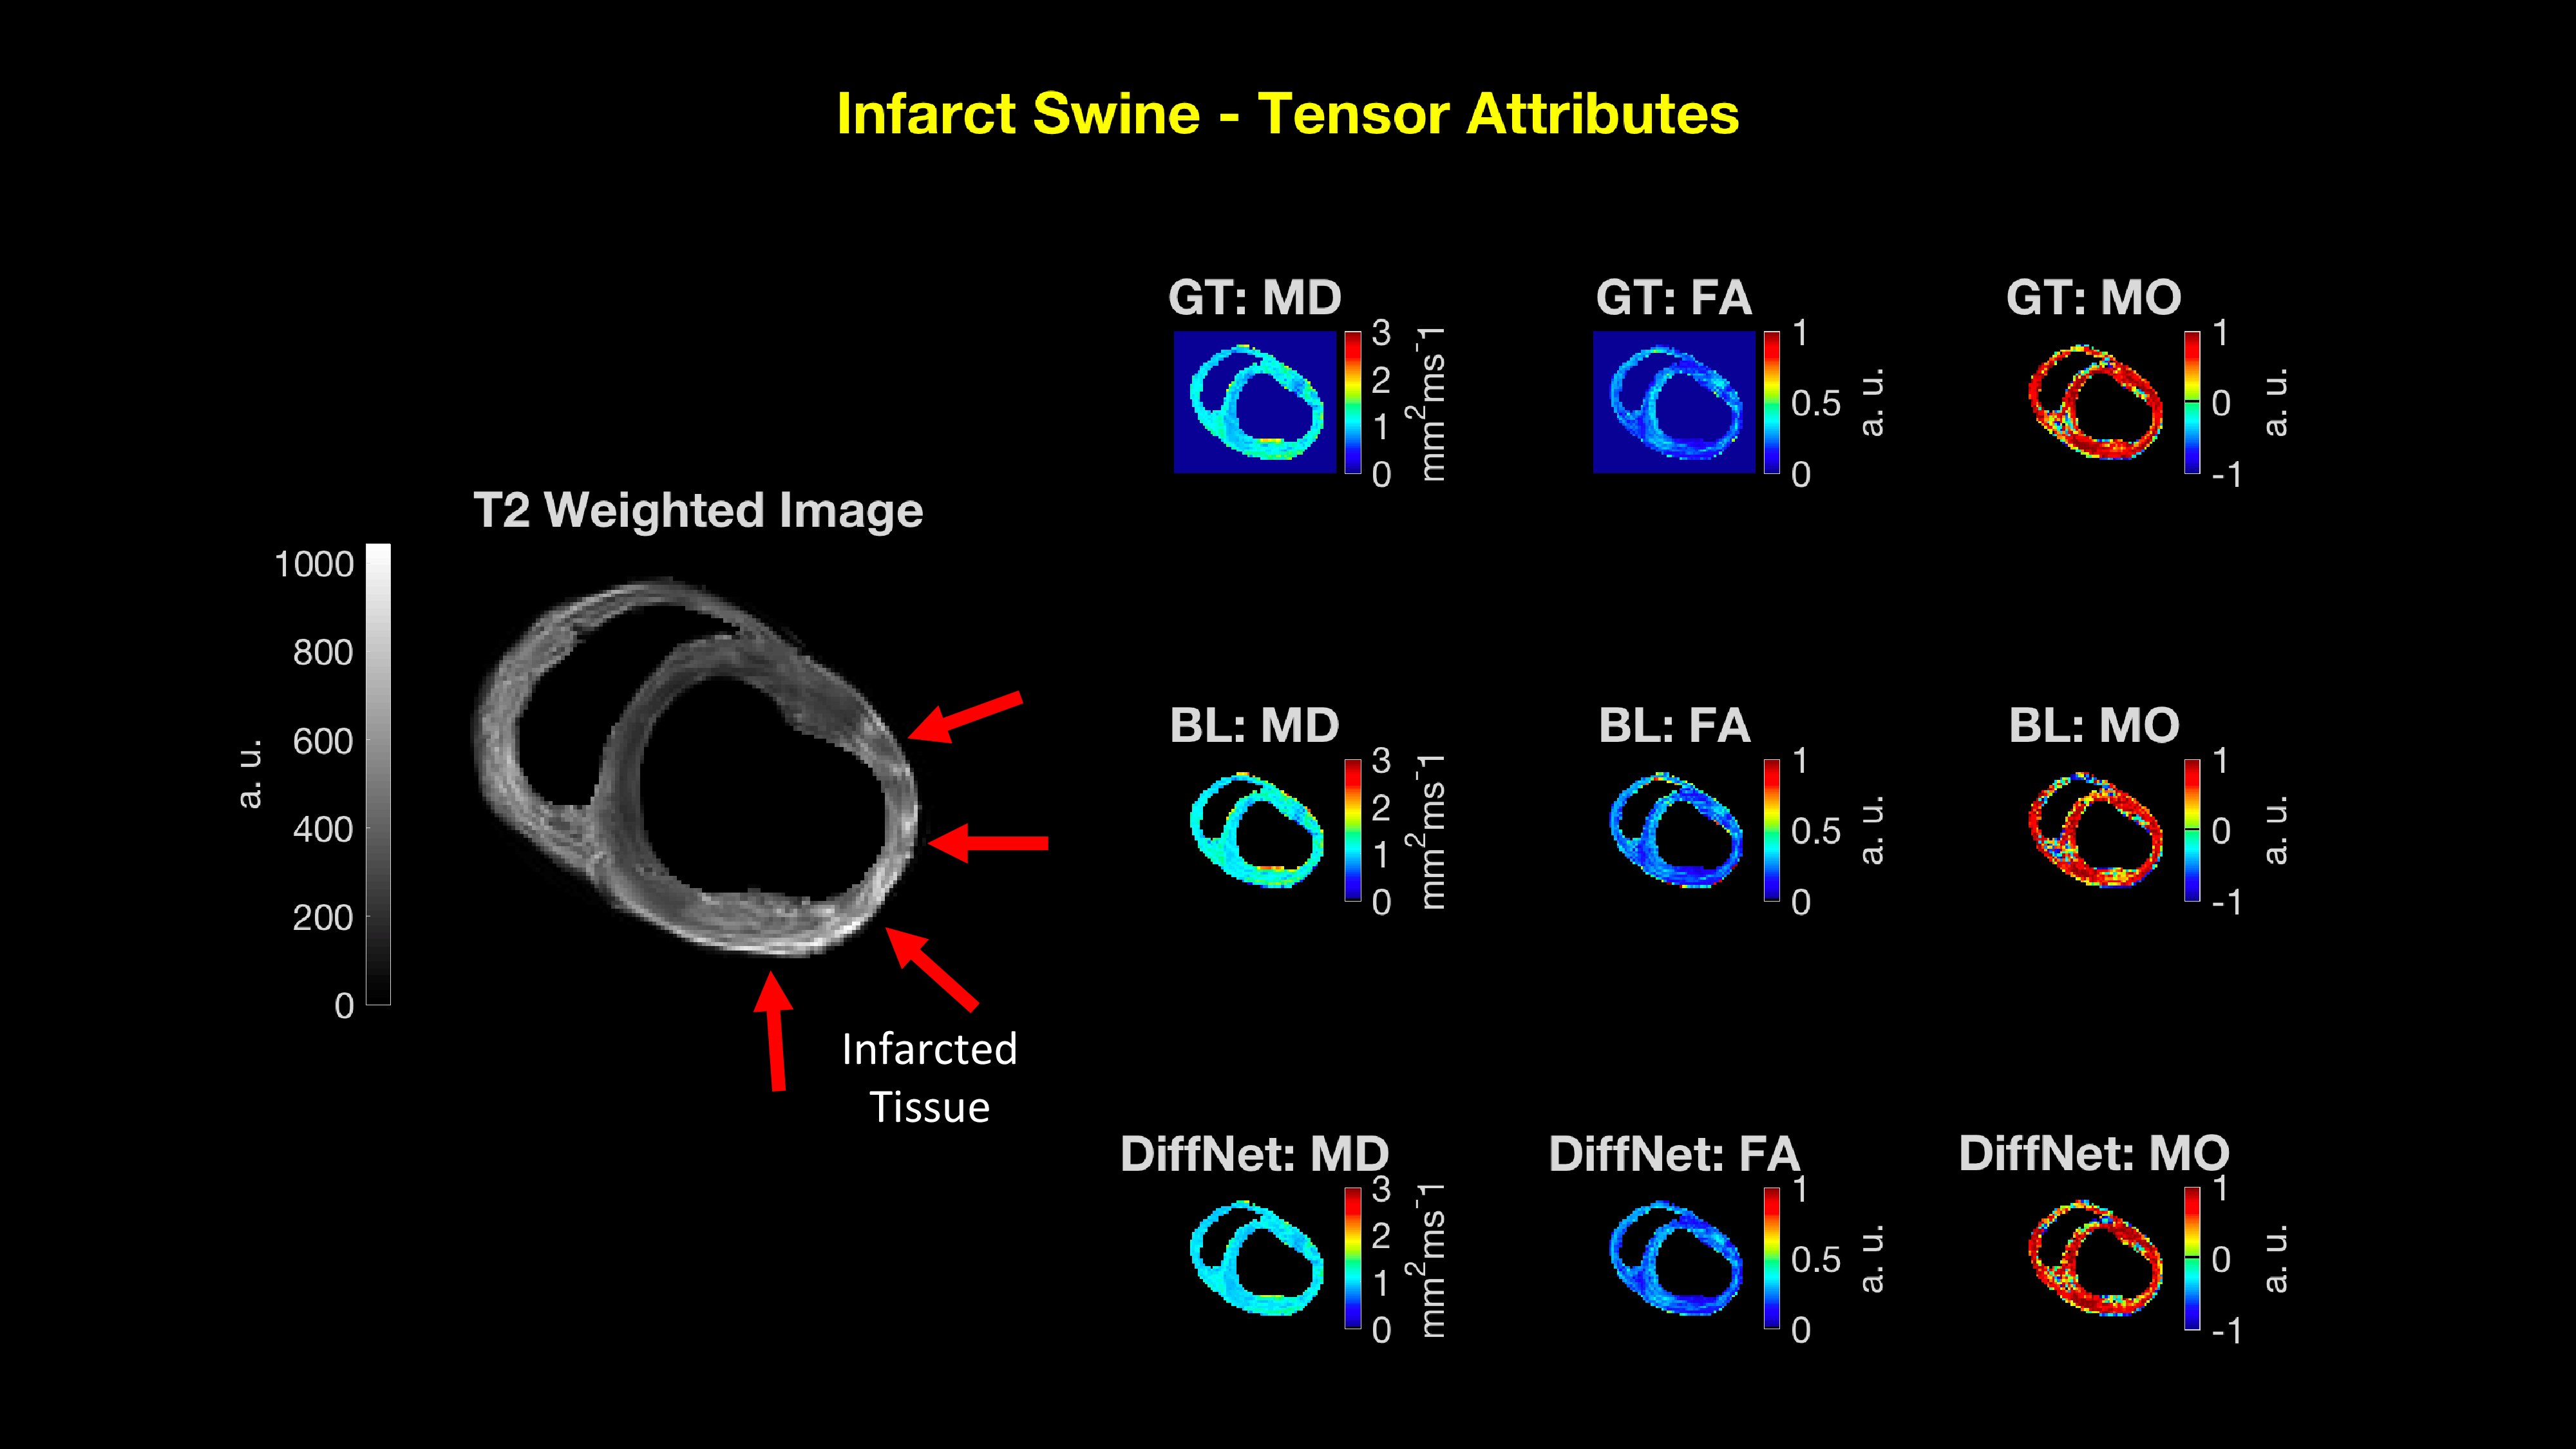
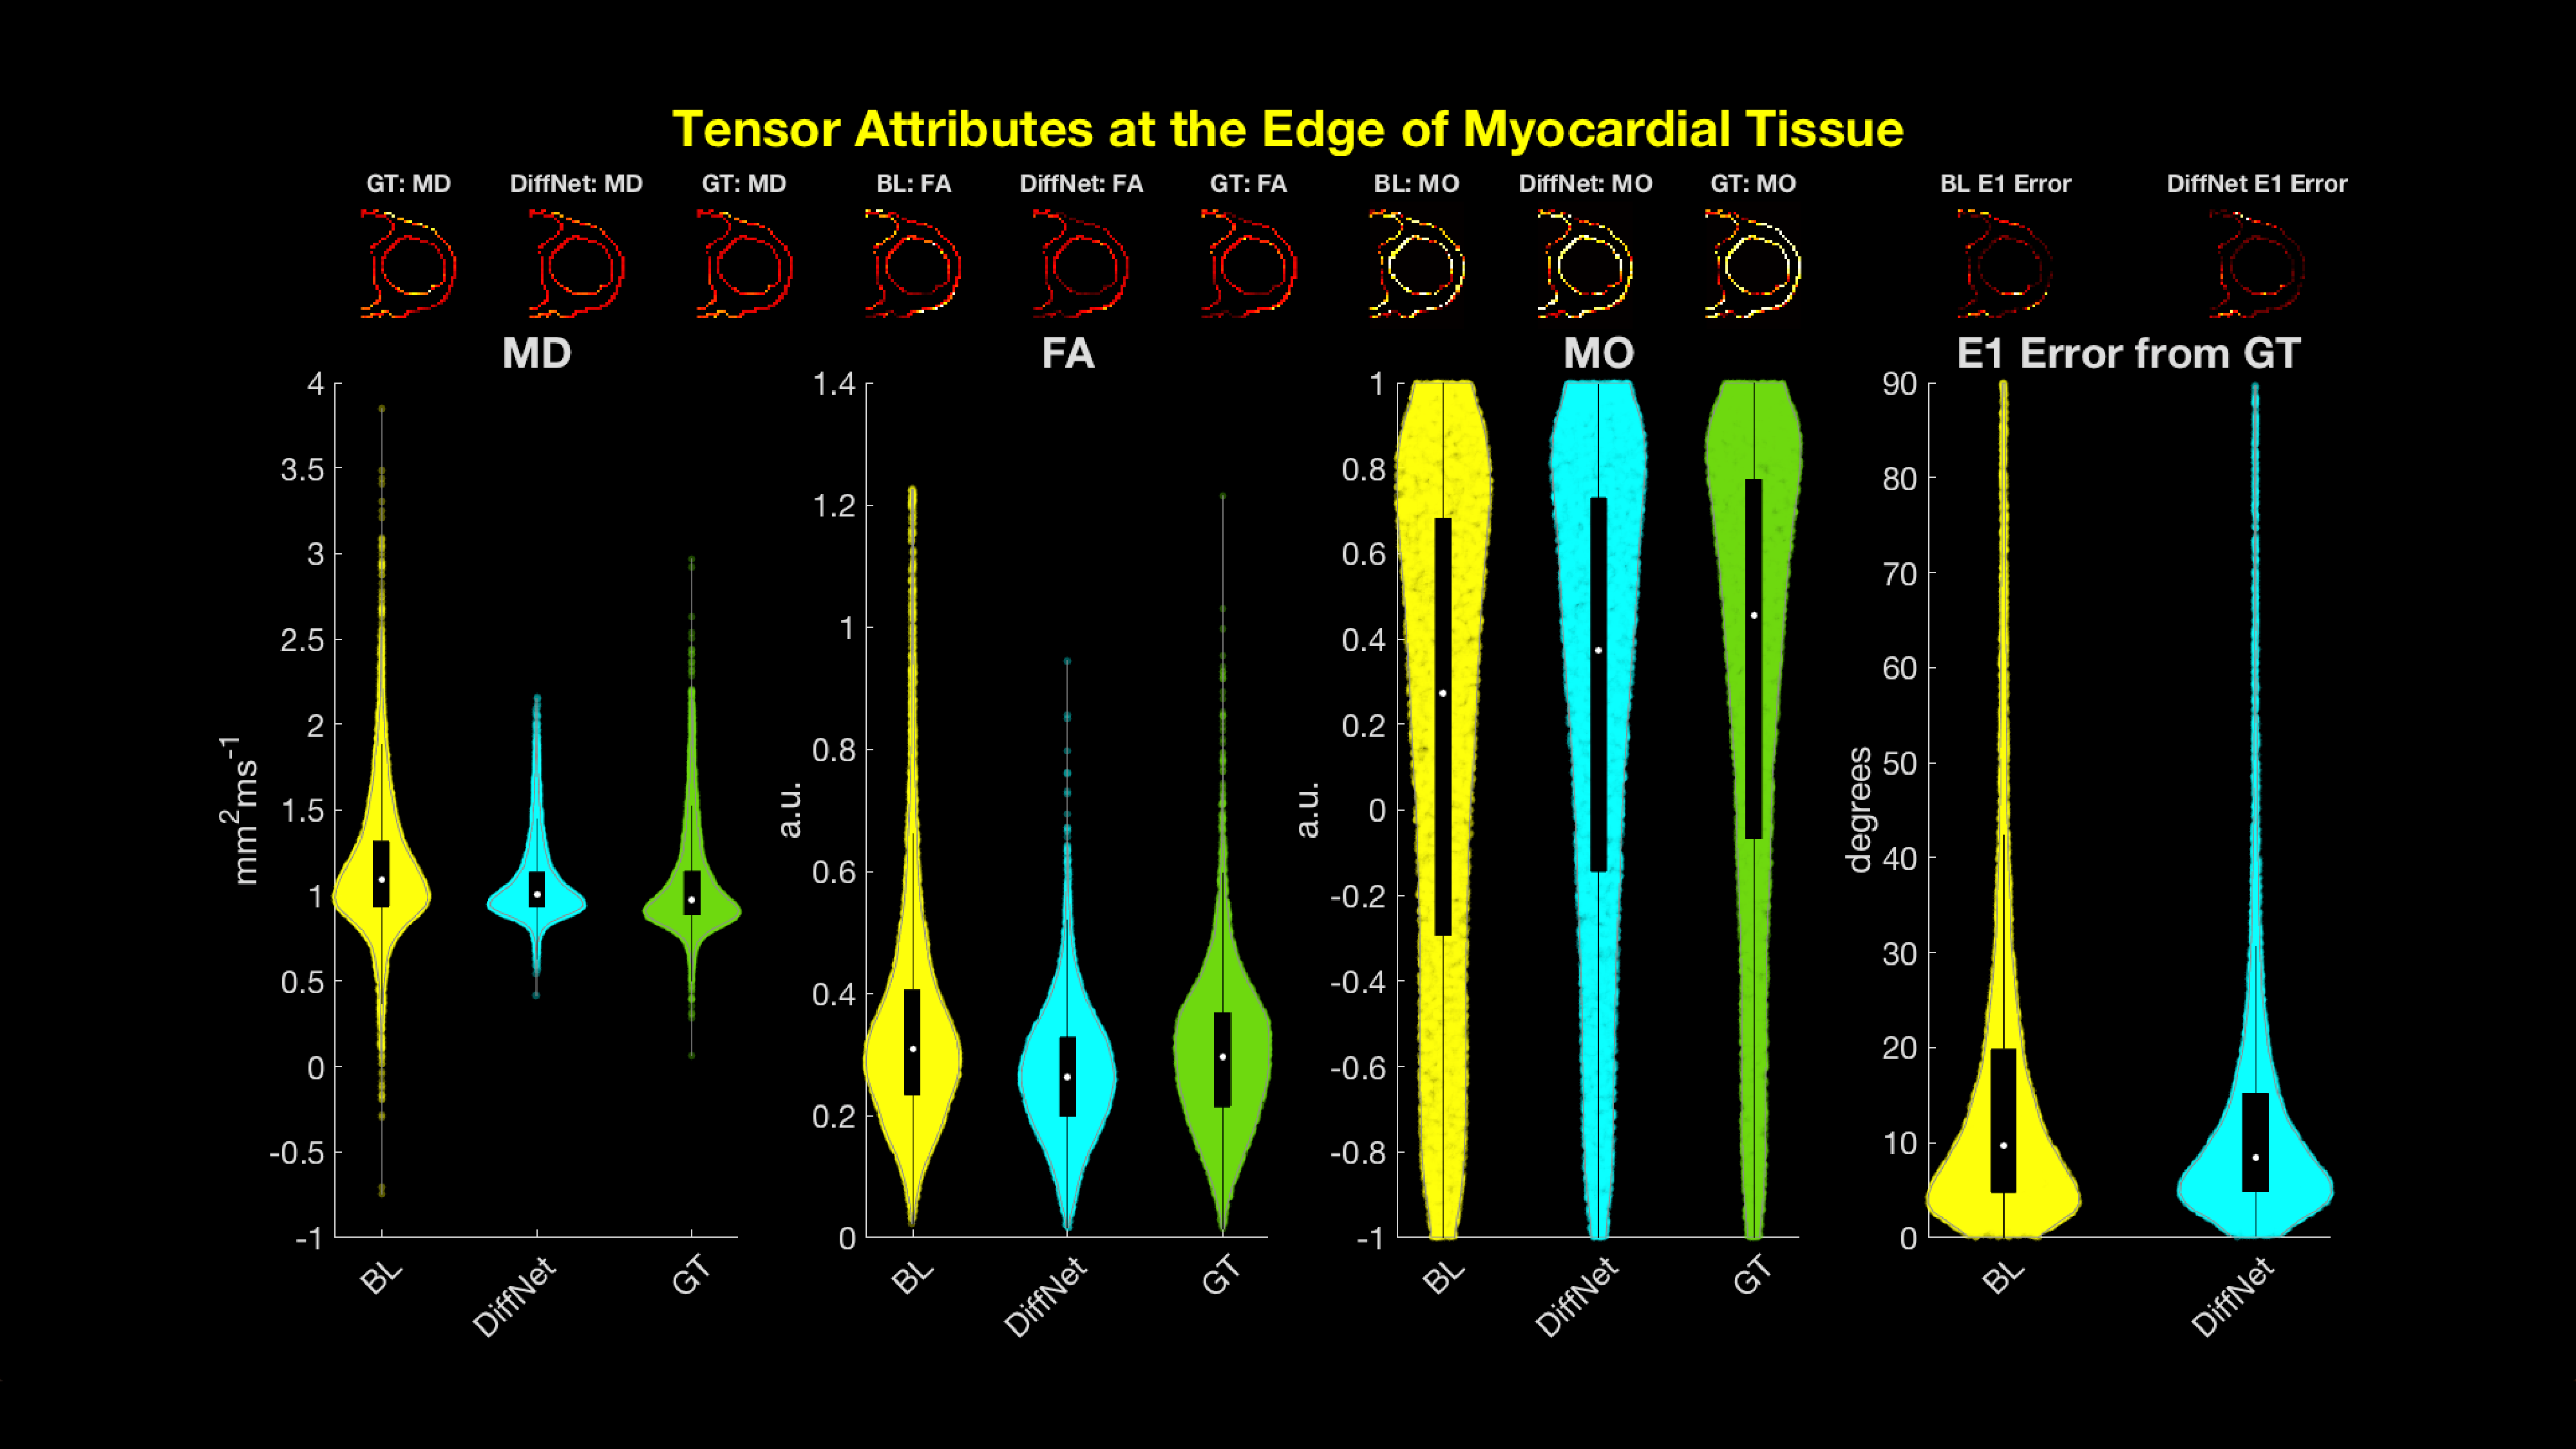
DiffNet was evaluated on N=32,409 testing voxels from a mixture of three healthy and three infarcted hearts that were withheld from the training process. To evaluate accuracy, the following tensor attributes were extracted from the DiffNet reconstructed diffusion tensors: Mean Diffusivity (MD), Fractional Anisotropy (FA), Mode (MO), and primary eigenvector orientation (E1). Tensor attributes were then analyzed by comparing medians and interquartile ranges (IQR) of tensor attributes between the BL, DiffNet, and GT reconstructions for (1) all myocardial tissue and (2) only at epicardial and endocardial borders. Additionally, tensor attributes maps for all reconstructions are shown in Fig. 2 and 3. These maps are displayed for only one healthy swine slice and one infarcted swine slice.
Results
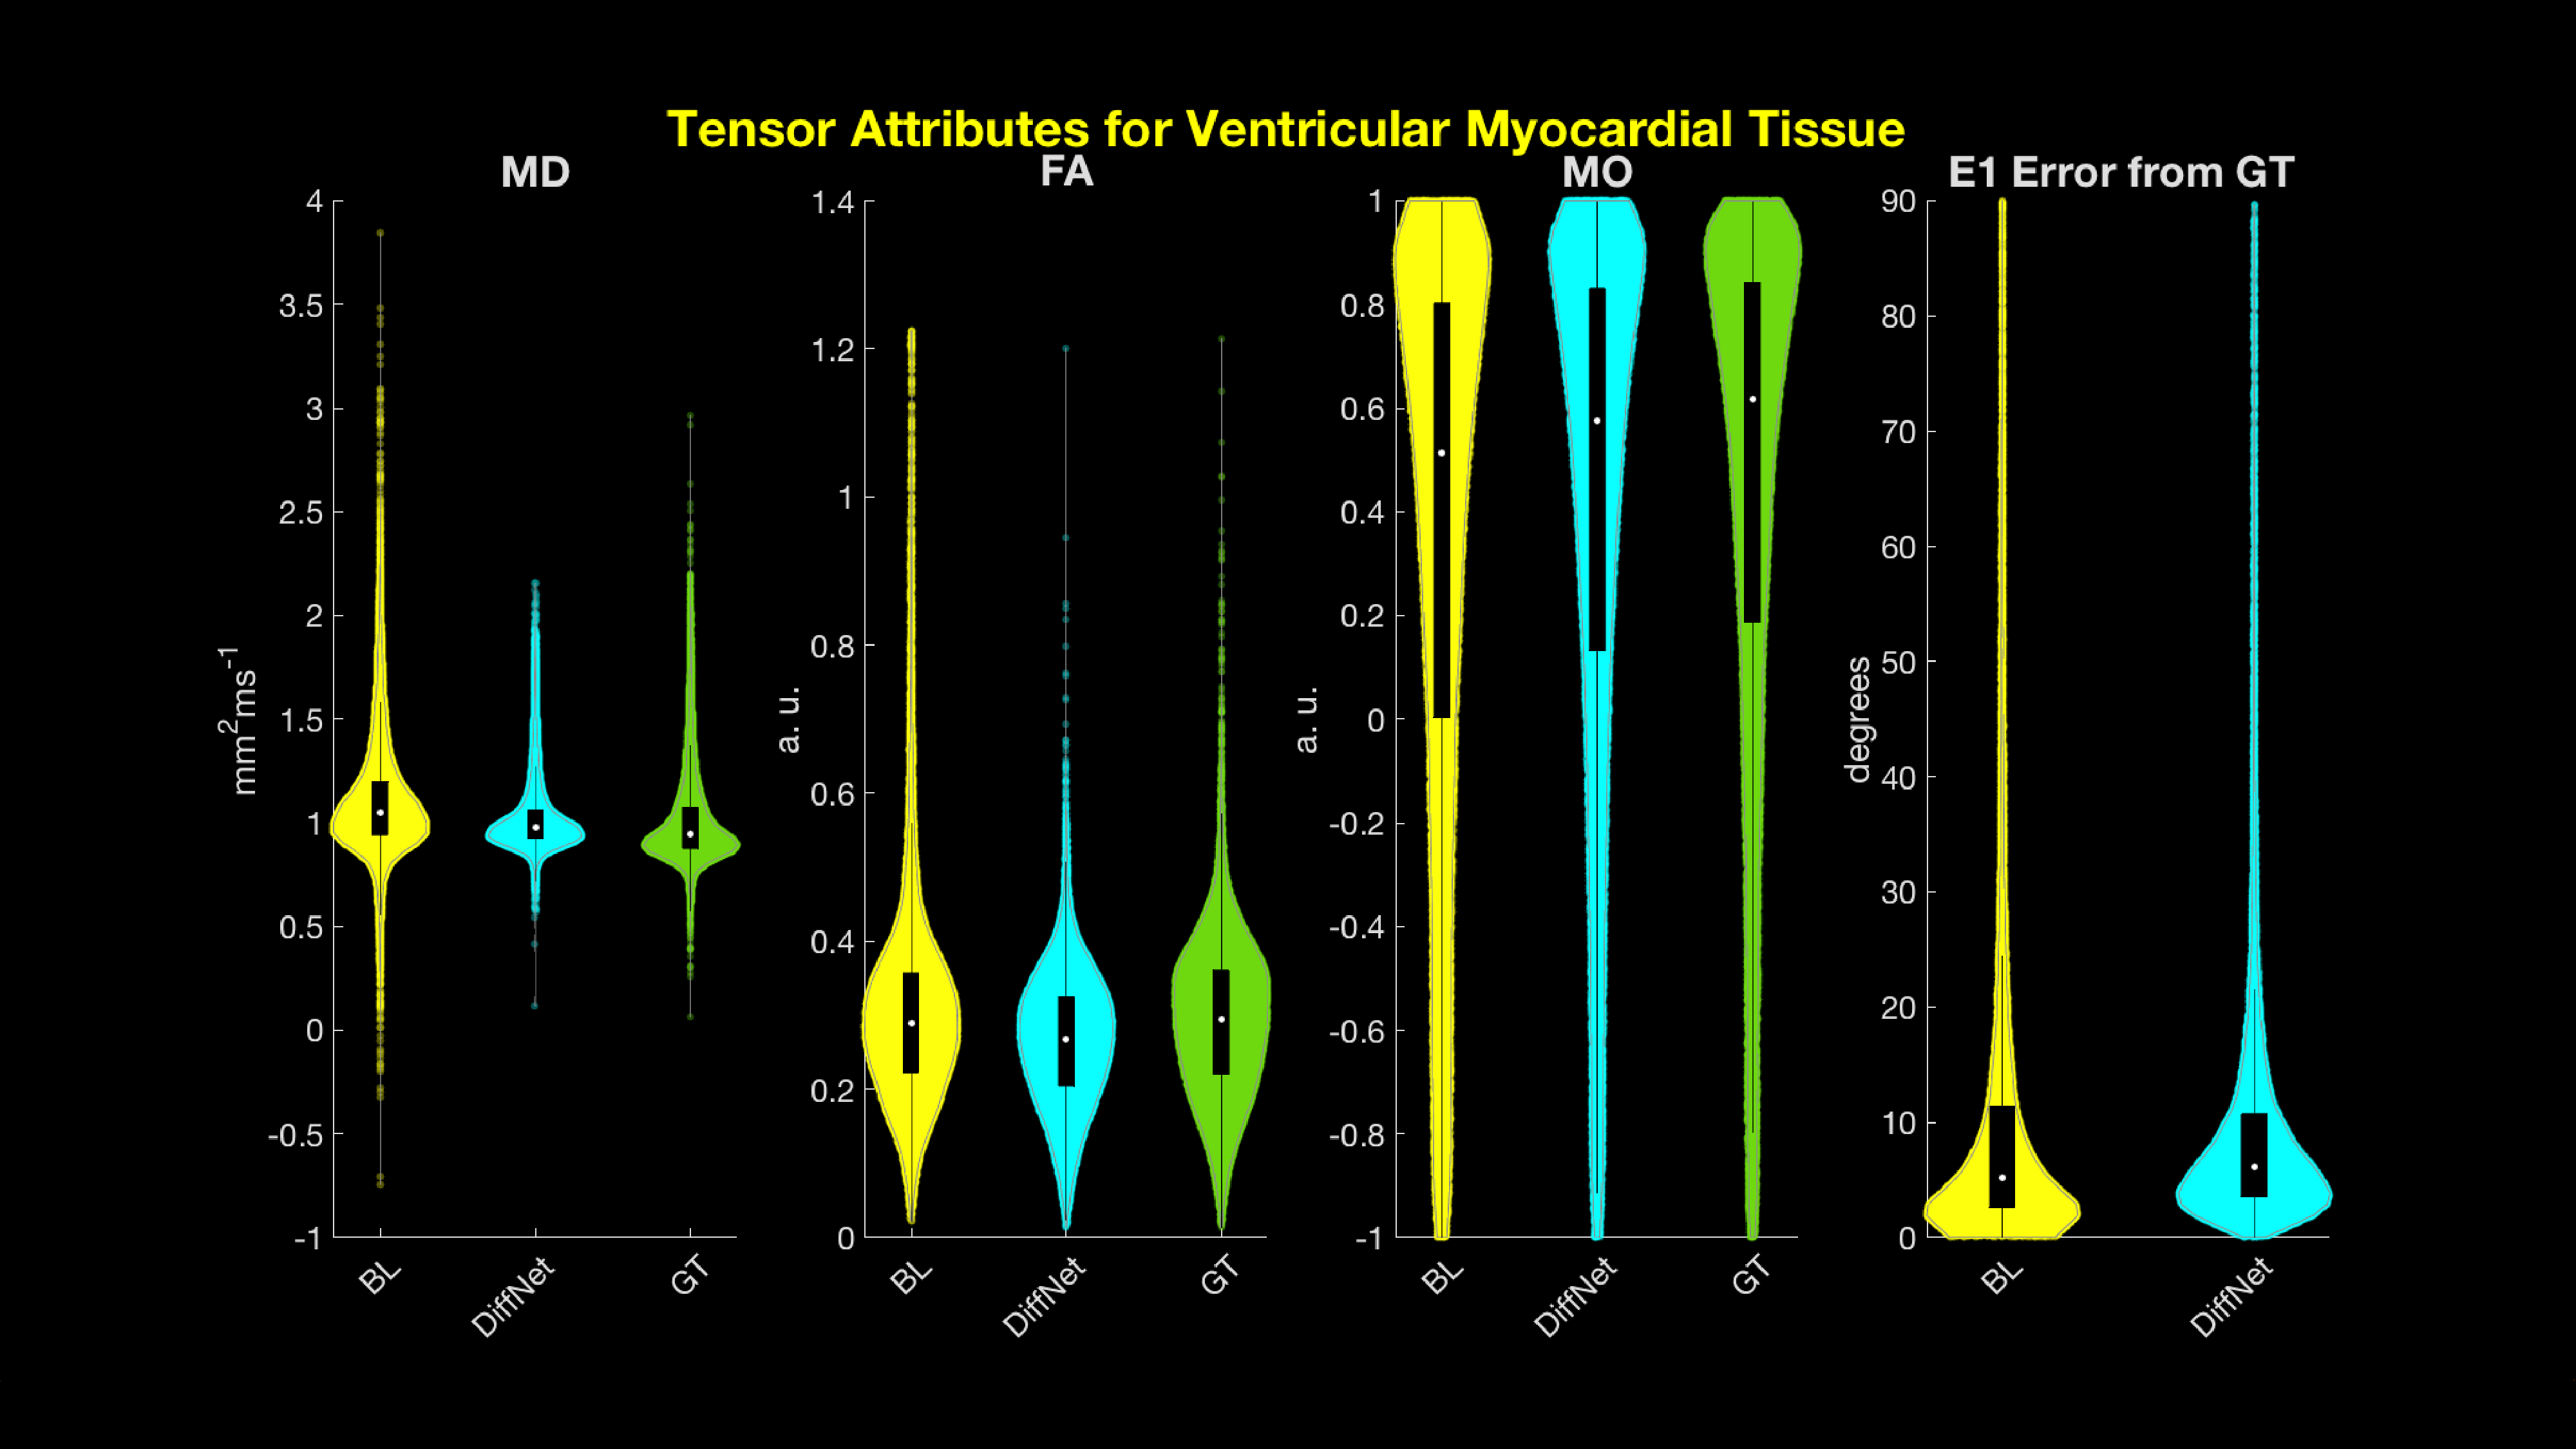
When comparing the median and IQR of DiffNet to the BL tensor attributes (Figure 4), only MD and MO displayed median and IQR that are closer to GT: BL MD=1.05 (0.94 1.20) mm2ms-1, DiffNet MD=0.98 (0.92 1.06) mm2ms-1, GT MD=0.94 (0.88 1.08) mm2ms-1, and BL MO=0.51 (0.00 0.80), DiffNet MO=0.58 (0.13 0.83), GT MO=0.62 (0.0.19 0.84). In particular, larger differences were observed at the edges of myocardial tissue (Figure 5). In addition to medians and IQRs that are closer to GT for MD and MO, the E1 error from GT is improved with DiffNet: median (IQR) angle between E1 GT and BL=9.6 (4.7 19.8)°, median (IQR) angle between E1 GT and DiffNet=8.4 (4.8 15.2)°. Across all cases, the IQR for DiffNet was tighter than the BL IQR.Conclusion
DiffNet reconstruction generates tensor attributes that are often more closely related to the GT than the BL tensor attributes. Even in the cases where the median of the DiffNet recon strayed from the GT, the IQR provided a tighter range than that of the BL indicating less variation within the tensor attributes. Additionally, DiffNet reconstruction appeared to better represent the myocardial edges for MD, MO, and the E1 error from GT. This is due the ability of DiffNet to extract the GT reconstructions robustness to partial voluming during the training of DiffNet. BL data only samples in 12 directions, making it more susceptible to partial voluming at edges. Future applications of DiffNet will be to directly apply the trained model to in vivo data. This approach may allow in vivo cDTI scans to reconstruct tensor attributes with higher confidence than conventional linear reconstruction methods.Acknowledgements
We would like to acknowledge the following funding sources for supporting this ongoing work:
- NIH K25 HL135408 to LEP
- NIH R01 HL131975 to DBE
- NIH R01 HL131823 to DBE
References
[1] Verzhbinsky et al. IEEE; 2018:474-478.
[2] Dou et al. MRM; 2002; 48(1):105-14.
[3]Aliotta et al. Medical Physics;2018:E584-E584
[4] Chollet et al. https://github.com/keras-team/keras
[5] Abadi, et al. Google Research; 2009.
Figures