0780
Diffusion tensor cardiovascular magnetic resonance in myocardial infarction: A comparison between high resolution spiral and standard resolution EPI STEAM1National Heart and Lung Institute, Imperial College London, London, United Kingdom, 2Cardiovascular Magnetic Resonance Unit, Royal Brompton Hospital, London, United Kingdom
Synopsis
Diffusion tensor cardiovascular magnetic resonance can provide insight into the function and microstructure of the scar and adjacent region in myocardial infarction (MI). Imaging the thinned infarcted myocardial wall requires a high-resolution acquisition while frequent arrhythmia, shortness of breath and fatigue make the cohort especially challenging for imaging. A high-resolution STEAM acquisition with an interleaved variable density spiral readout and an off-resonance and T2* correction was previously demonstrated in a healthy cohort. Here, this sequence was successfully applied in 7 MI patients at a spatial resolution of 1.8x1.8x8mm3 and compared to a standard resolution EPI sequence.
Introduction
Diffusion tensor cardiovascular magnetic resonance (DT-CMR) has been shown to provide information on the myocardial microstructure and its function in healthy subjects (2,3) and in several patient cohorts (4,5) but only a few studies have been performed in myocardial infarction (MI) patients (6,7). DT-CMR can provide insight on the structure and remaining function of the scar and border zone. MI patients have focal disease and often a thinned myocardial wall and high-resolution techniques are therefore essential in this cohort. Recently, high-resolution DT-CMR was demonstrated using a variable density interleaved spiral stimulated echo acquisition mode (STEAM) sequence with corrections for motion-induced phase, off-resonance and T2* decay (1,8). In this abstract this high-resolution spiral STEAM sequence is used to acquire high resolution DT-CMR data in MI patients.Methods
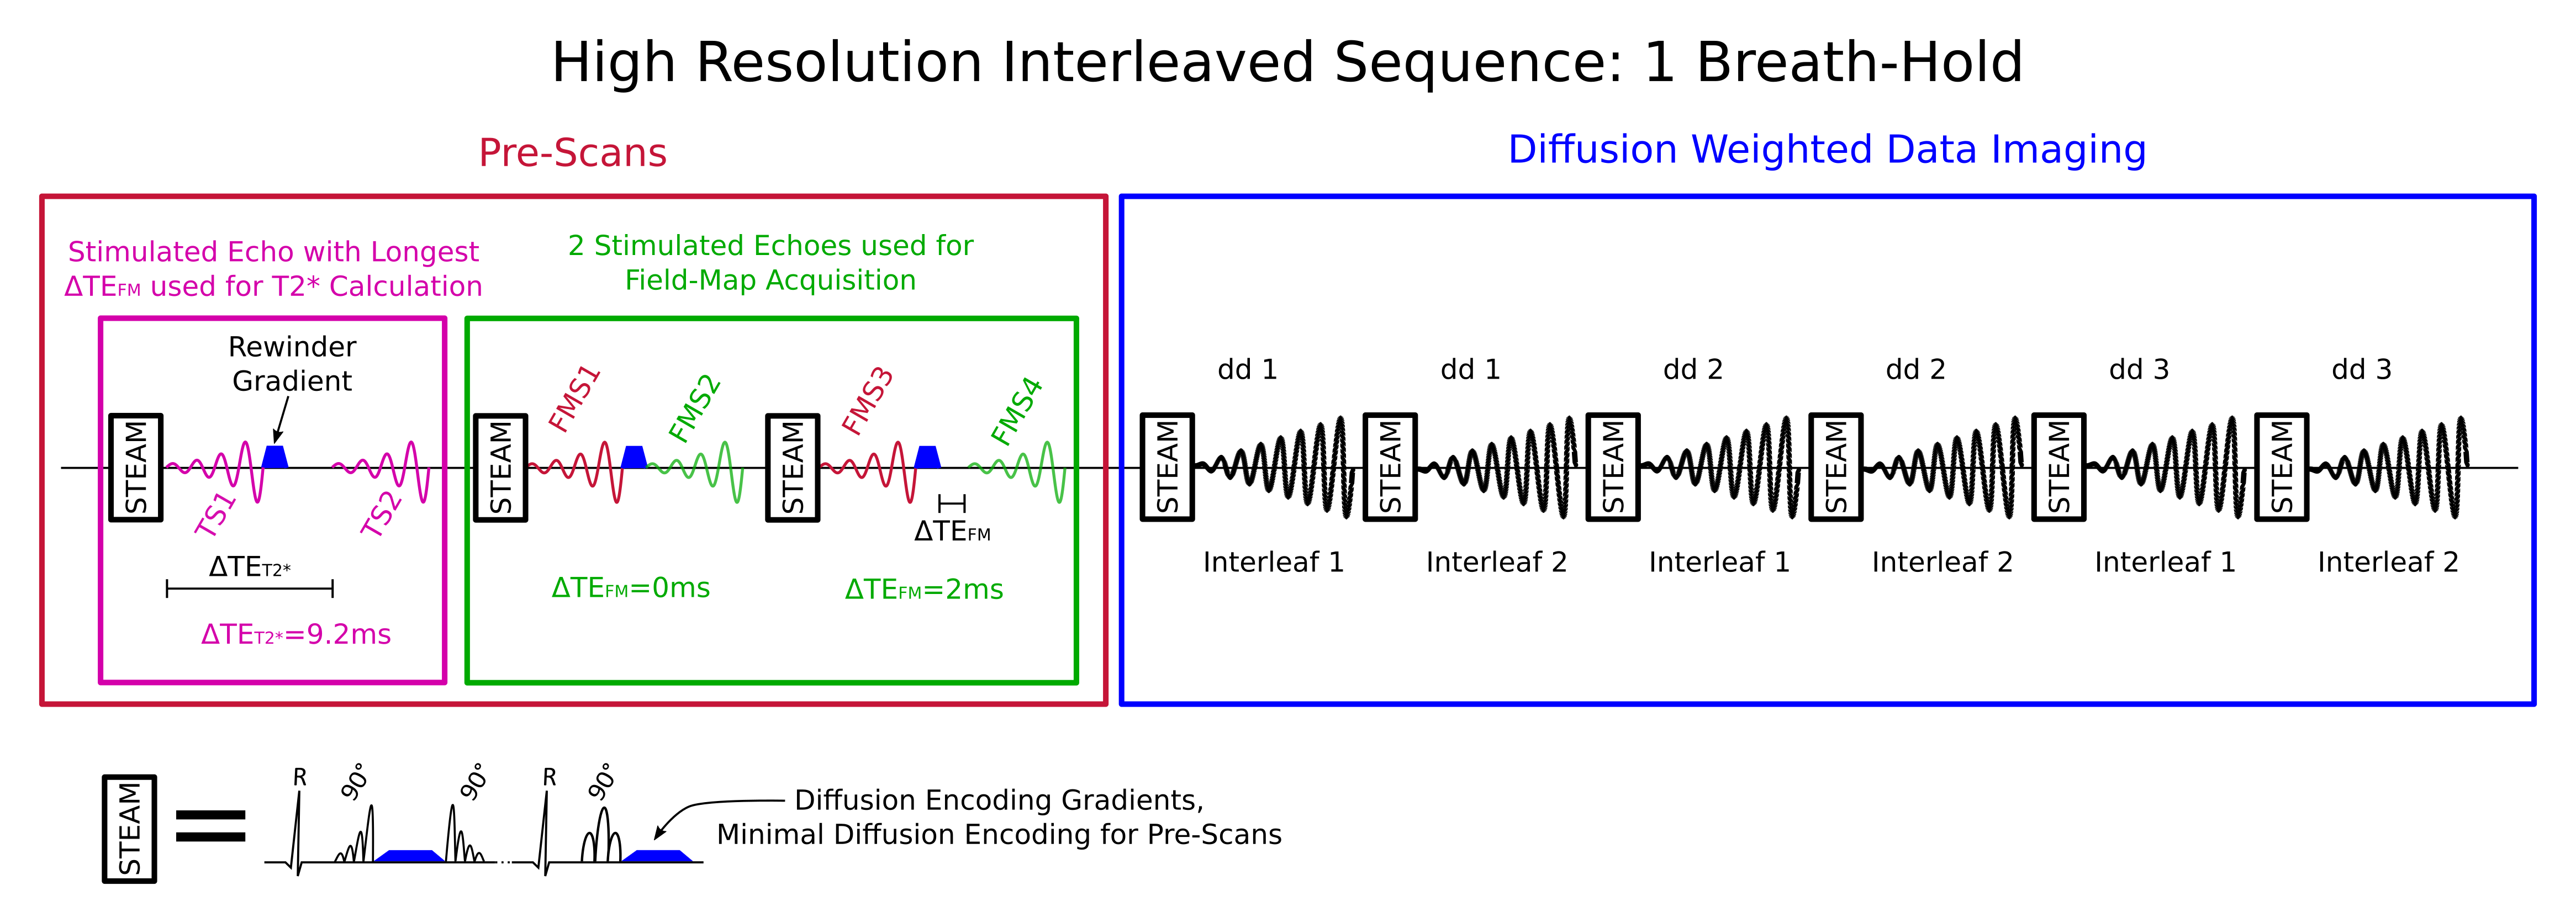
7 MI patients mean age 69 [range 57-74] were imaged at peak-systole and diastasis on a 3T Siemens Skyra scanner median 6 years [range 1-25] after their first infarction. A single mid-ventricular short-axis slice containing the infarction was identified on a recent (<1.5y) late-gadolinium enhancement (LGE) image. Patients were imaged with the standard EPI STEAM sequence (9) and with the high-resolution interleaved spiral sequence (1,8) with a resolution of 2.8x2.8x8mm3 and 1.8x1.8x8mm3 respectively. Figure 1 shows a schematic of the spiral sequence used in each breath-hold. The breath-holds consist of 9 stimulated echoes (2 cardiac cycles each): The first 3 stimulated echoes are used for the T2* correction, field-map and coil sensitivity maps calculation. The last 6 stimulated echoes are used to acquire both interleaves for 3 diffusion weighted images. In 10 breath-holds 8/2 averages of b1/b2 images and in 18 breath-holds 8/1 averages of b1/b2 were obtained for the EPI and the spiral respectively. Images with b1=600 s/mm2 and b2=150 s/mm2 were each obtained in 6 diffusion encoding directions. TE was 24/11ms, readout duration was 12/15ms for the EPI / spiral respectively and the reconstructed field-of-view was 360x135mm2 for the EPI and varied between190x190 and 110x110mm2 (both interleaves combined) for the spiral.
The spiral sequence was reconstructed off-line in Matlab. The differences in motion induced phase between the interleaves and the T2* decay during the readout were corrected for (1,8). A frequency segmented reconstruction was performed based on a field-map calculated for each cardiac phase and subject. To calculate the field-map, all pre-scan images were registered and for each breath-hold a field-map was calculated as described in (10). These field-maps were then thresholded (0.2x maximal magnitude) and a weighted mean was calculated based on the intensities of the magnitude pre-scan images. For the EPI acquisition, the manufacturer’s SENSE x2 online reconstruction was used.
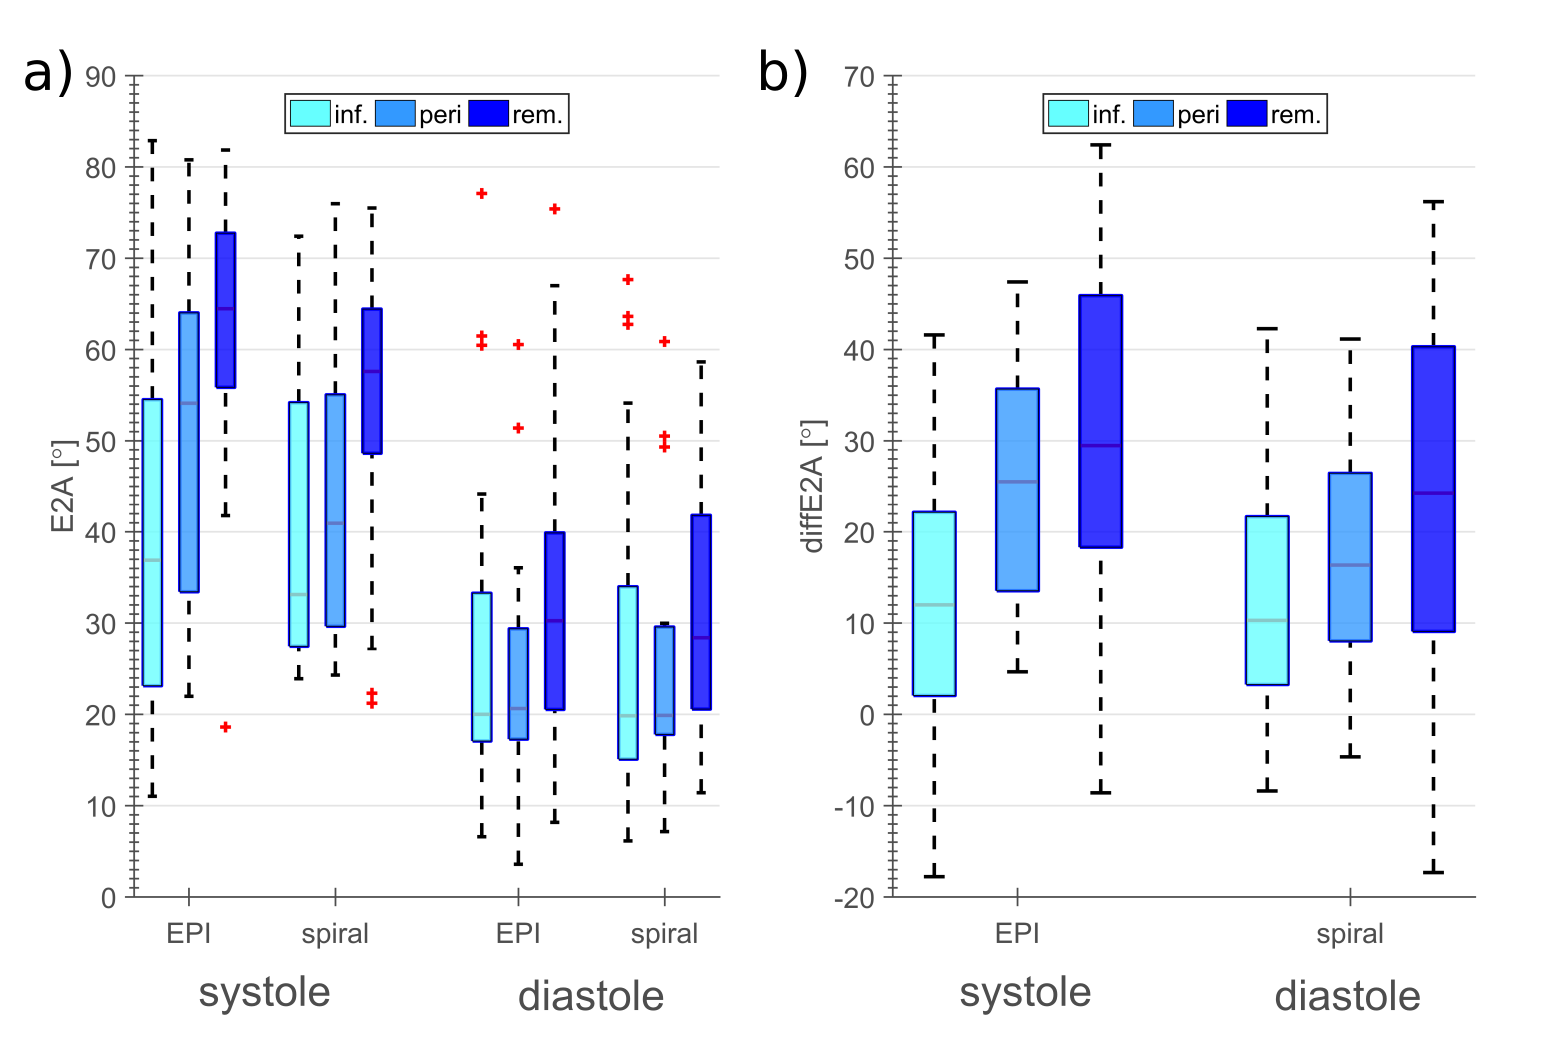
For all subjects, the myocardium was divided into 12 equal-angle segments. The segments were visually divided into three groups: infarcted (enhancement on the LGE image), peri-infarcted (segments adjacent to infarcted) and remote (other segments). The diffusion tensor was calculated pixel-wise using in-house Matlab software (11).
Results
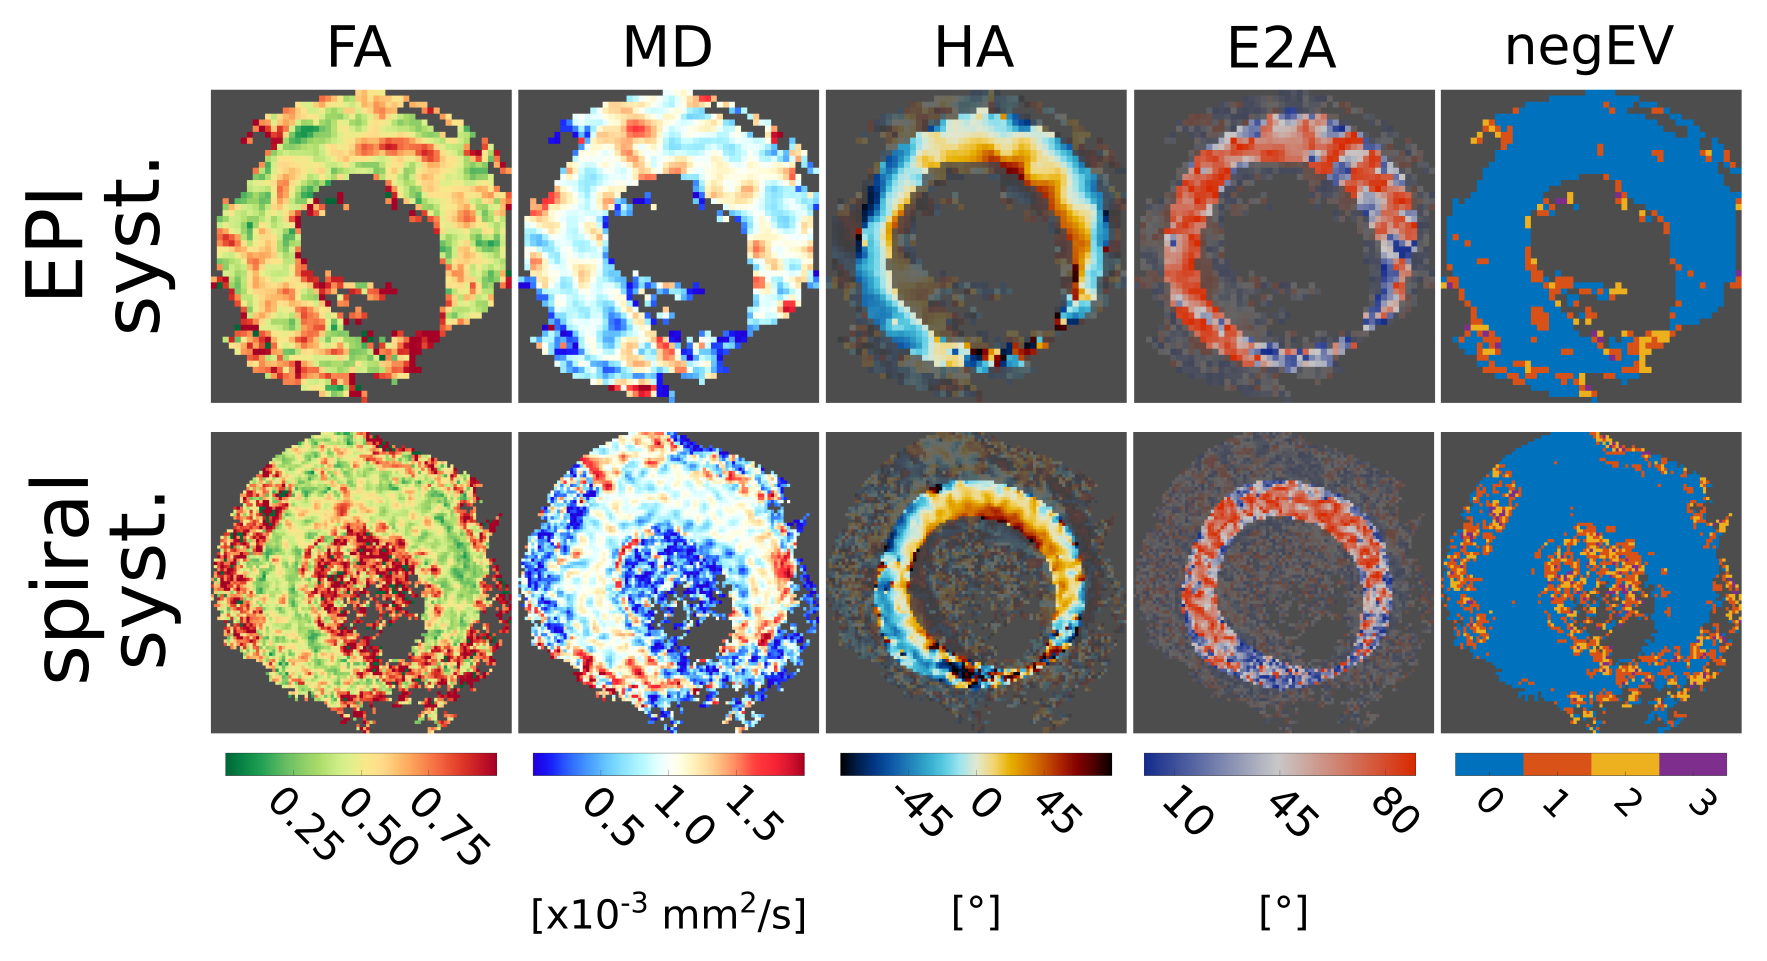
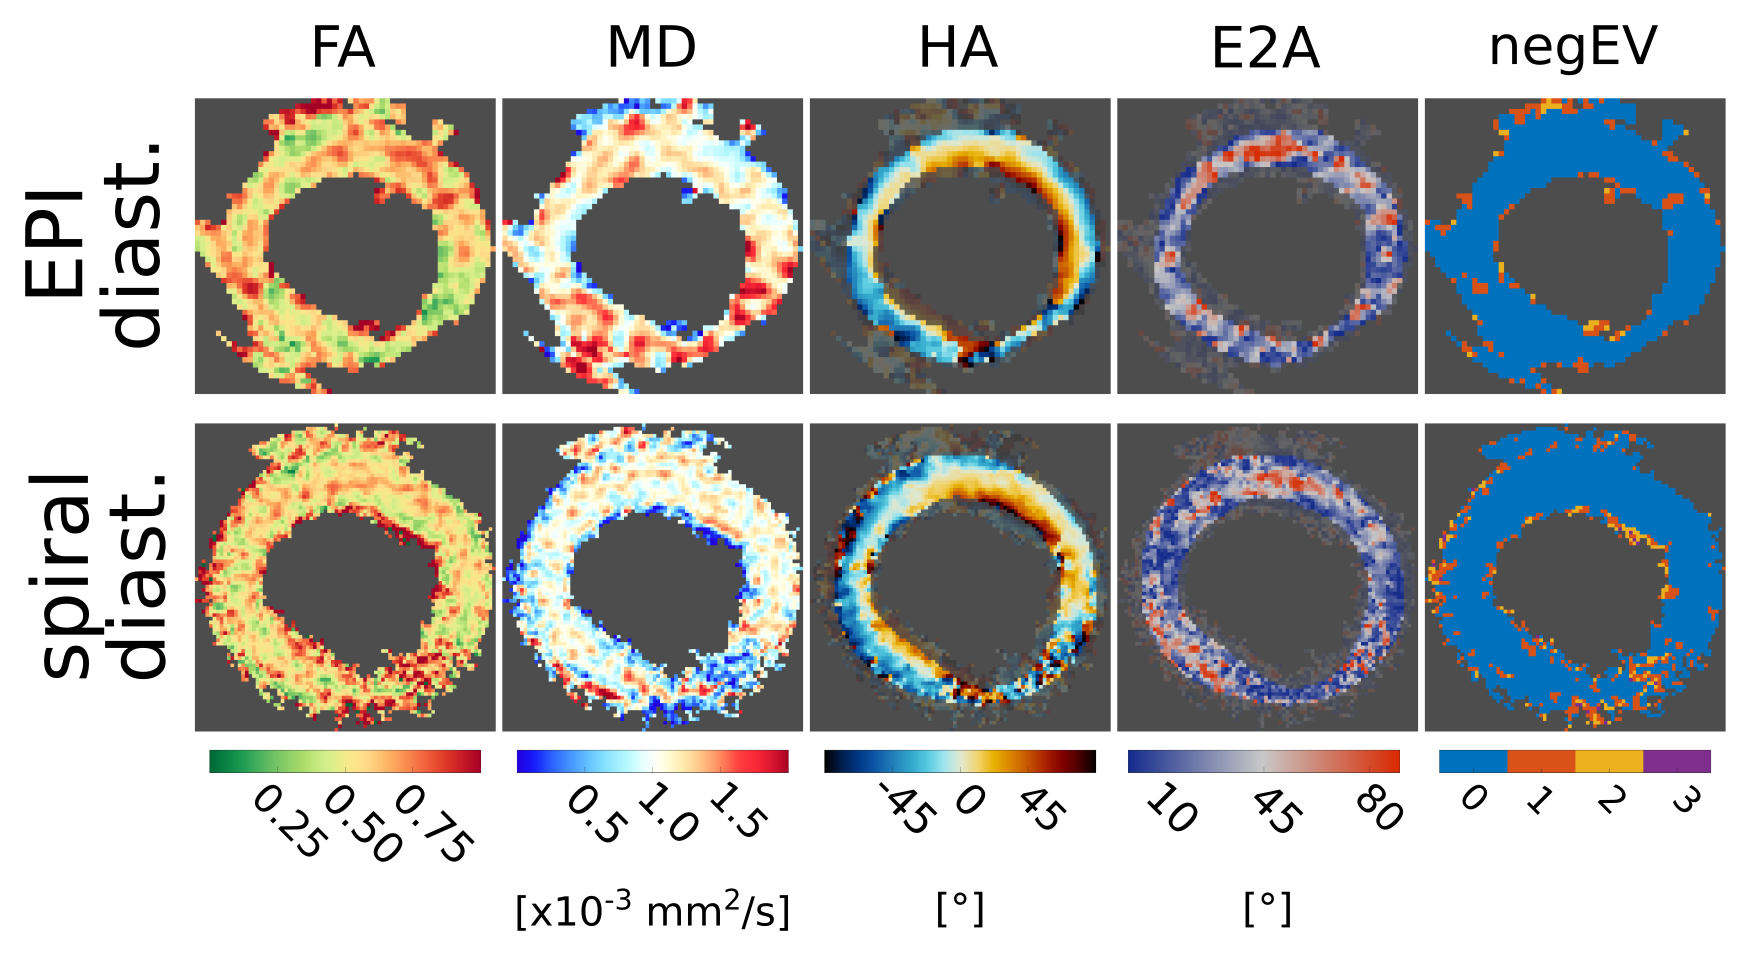
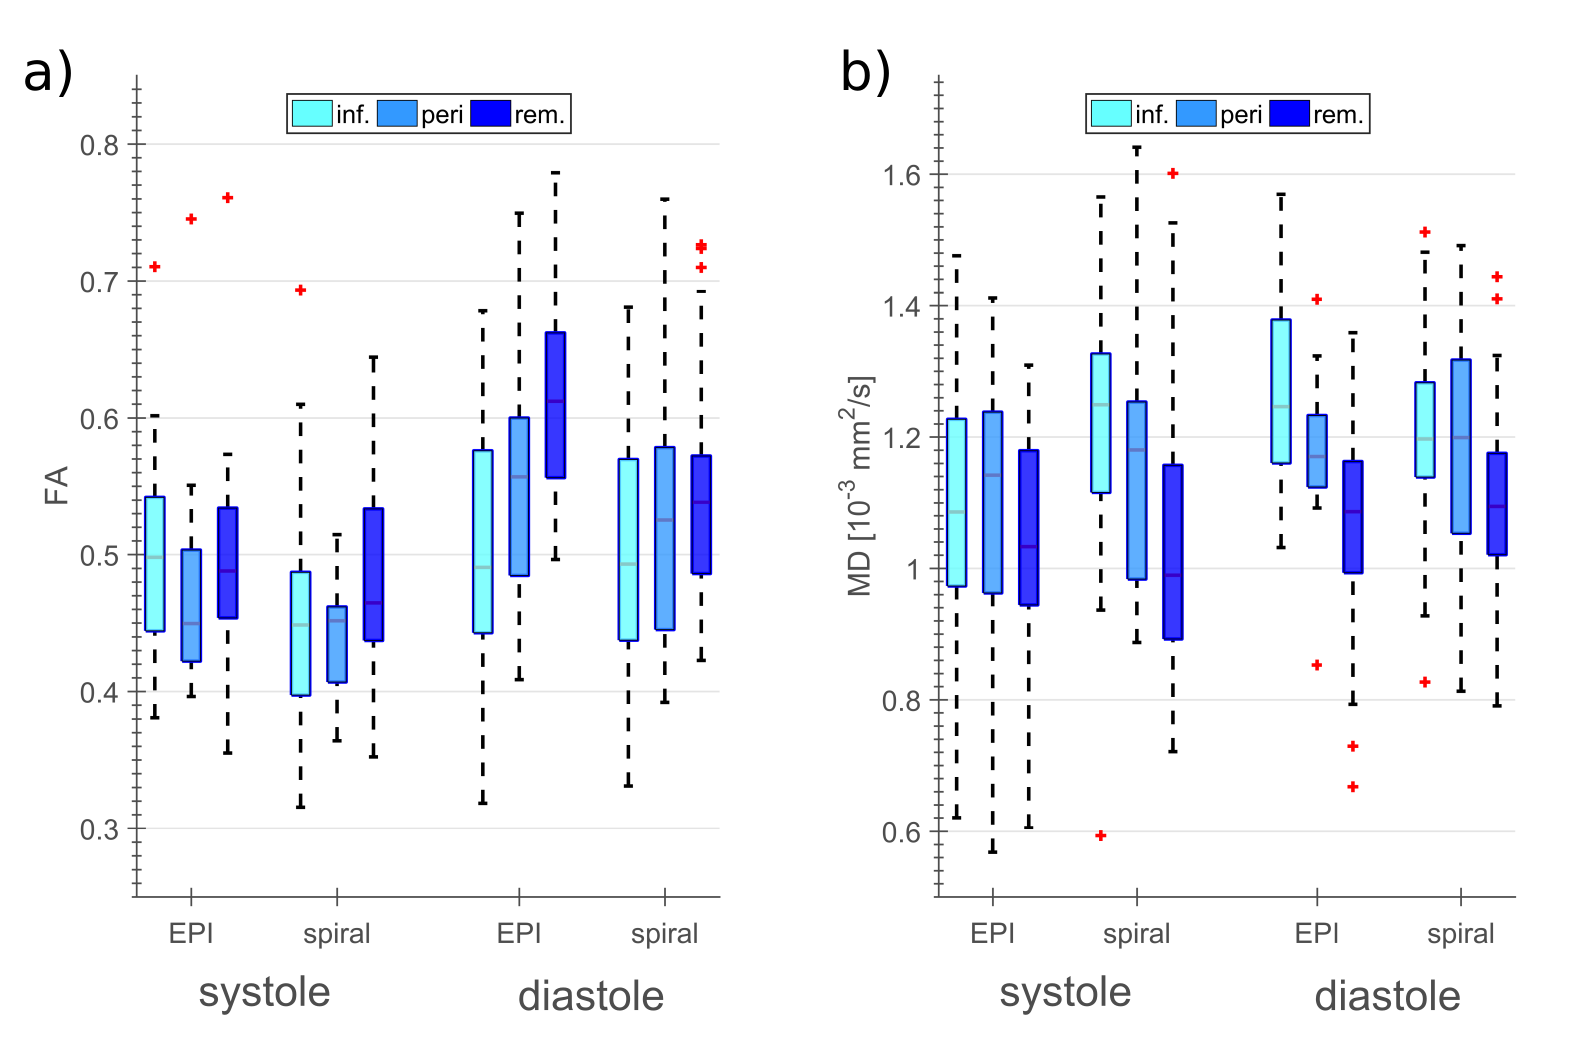
Typical DT-CMR maps are shown for both sequences and cardiac phases in figures 2 and 3 respectively. Fractional anisotropy (FA) and mean diffusivity (MD), and secondary vector angulation (E2A) and the differences in E2A (diffE2A) between systole and diastasis are shown in figures 4 and 5 respectively.Discussion
The measured increase in MD and decrease in FA in diastasis in infarcted compared to remote segments, observed with both sequences is consistent with literature (6,7). diffE2A was strongly reduced for the infarcted region by 59% and 13% for the EPI and by 68% and 33% for the spiral comparing the infarcted and remote segments and the peri-infarcted and remote regions respectively. This is consistent with limited functionality in the scar tissue and the bordering regions.
The spiral DT-CMR images including the pre-scans were strongly affected by off-resonance. To improve the quality of the field-maps, a weighted mean of the field-maps was calculated over the breath-holds. Nevertheless, the off-resonance correction was less effective in the MI cohort than in the healthy volunteers scanned in a previous study (1). As STEAM is acquired over two consecutive cardiac cycles, it is sensitive to arrhythmia. This effect is enhanced for the interleaved acquisition.
Conclusion
A high-resolution STEAM sequence was successfully demonstrated in the challenging cohort of chronic MI patients. The challenges of this cohort include arrhythmia and shortness of breath as well as a limited acquisition duration due to patient fatigue. Despite these difficult conditions, high-resolution DT-CMR was obtained using an interleaved variable density spiral STEAM sequence with corrections for motion-induced phase, spatially varying off-resonance and T2* related blurring.Acknowledgements
This work was founded by heart research UK, grant reference number RG2648/15/18References
1. Gorodezky M, Ferreira PF, Nielles-Vallespin S, Gatehouse PD, Pennell DJ, Scott AD, Firmin DN. High resolution in-vivo DT-CMR using an interleaved variable density spiral STEAM sequence. Magn. Reson. Med.:in press.
2. Dou J, Tseng WI, Reese TG, Wedeen VJ. Combined diffusion and strain MRI reveals structure and function of human myocardial laminar sheets in vivo. Magn. Reson. Med. 2003;50:107–113.
3. Edelman RR, Gaa J, Wedeen VJ, Loh E, Hare JM, Prasad P, Li W. In vivo measurement of water diffusion in the human heart. Magn. Reson. Med. 1994;32:423–428.
4. Nguyen C, Lu M, Fan Z, Bi X, Kellman P, Zhao S, Li D. Contrast-free detection of myocardial fibrosis in hypertrophic cardiomyopathy patients with diffusion-weighted cardiovascular magnetic resonance. J. Cardiovasc. Magn. Reson. 2015;17:1.
5. Nielles-Vallespin S, Khalique Z, Ferreira PF, de Silva R, Scott AD, Kilner P, McGill L-A, Giannakidis A, Gatehouse PD, Ennis D. Assessment of myocardial microstructural dynamics by in vivo diffusion tensor cardiac magnetic resonance. J. Am. Coll. Cardiol. 2017;69:661–676.
6. Wu M-T, Su M-YM, Huang Y-L, Chiou K-R, Yang P, Pan H-B, Reese TG, Wedeen VJ, Tseng W-YI. Sequential changes of myocardial microstructure in patients postmyocardial infarction by diffusion-tensor cardiac MR correlation with left ventricular structure and function. Circ. Cardiovasc. Imaging [Internet] 2009;2:32–40.
7. Mekkaoui C, Jackowski MP, Kostis WJ, Stoeck CT, Thiagalingam A, Reese TG, Reddy VY, Ruskin JN, Kozerke S, Sosnovik DE. Myocardial Scar Delineation Using Diffusion Tensor Magnetic Resonance Tractography. J. Am. Heart Assoc. 2018;7:e007834.
8. Gorodezky M, Scott AD, Ferreira PF, Nielles-Vallespin S, Gatehouse PD, Pennell DJ, Firmin DN. High resolution in-vivo diffusion tensor cardiovascular magnetic resonance: a comparison of single-shot EPI and interleaved spiral trajectories with motion induced phase correction. In: International Society for Magnetic Resonance in Medicine Annual Meeting. ; 2018. p. #0287.
9. Nielles‐Vallespin S, Mekkaoui C, Gatehouse P, Reese TG, Keegan J, Ferreira PF, Collins S, Speier P, Feiweier T, Silva R. In vivo diffusion tensor MRI of the human heart: Reproducibility of breath‐hold and navigator‐based approaches. Magn. Reson. Med. 2013;70:454–465.
10. Gorodezky M, Scott AD, Ferreira PF, Nielles-Vallespin S, Pennell DJ, Firmin DN. An off-resonance correction for in-vivo spiral STEAM diffusion tensor cardiovascular magnetic resonance. In: International Society for Magnetic Resonance in Medicine Annual Meeting. ; 2018. p. #4887.
11. Ferreira PF, Kilner PJ, McGill L-A, Nielles-Vallespin S, Scott AD, Ho SY, McCarthy KP, Haba MM, Ismail TF, Gatehouse PD. In vivo cardiovascular magnetic resonance diffusion tensor imaging shows evidence of abnormal myocardial laminar orientations and mobility in hypertrophic cardiomyopathy. J. Cardiovasc. Magn. Reson. 2014;16:1.
Figures