0779
Efficient high-resolution cardiac motion-corrected T1 mapping1Physikalisch-Technische Bundesanstalt (PTB), Braunschweig and Berlin, Germany, 2Charité Medical Faculty University Medicine, Berlin, Germany, 3Working Group on Cardiovascular Magnetic Resonance, Experimental and Clinical Research Center (ECRC), DZHK partner site Berlin, Berlin, Germany, 4Department of Cardiology and Nephrology, HELIOS Klinikum Berlin Buch, Berlin, Germany, 5Division of Imaging Sciences and Biomedical Engineering, King's College London, London, United Kingdom
Synopsis
Cardiac T1 mapping provides valuable information on fibrosis in various cardiomyopathies. Commonly, data acquisition is restricted to a small percentage (mid-diastole) of the cardiac cycle to prevent motion artefacts. This leads to low scan efficiency and limits the achievable resolution. We present an 8s T1 mapping approach, which employs a large acquisition window (80% of the cardiac cycle) and corrects for cardiac motion using the same data. The approach was evaluated in native T1 mapping in healthy volunteers and post-contrast T1 mapping in patients. It significantly improved the precision of the obtained T1 maps while successfully minimizing cardiac motion artefacts.
INTRODUCTION
Myocardial T1 is an important marker for the detection of fibrosis in various cardiomyopathies.1 Cardiac triggering is necessary in T1 mapping techniques to avoid cardiac motion artefacts. Usually a relatively short acquisition window in mid-diastole of only 15-30% of each cardiac cycle is used, limiting the spatial resolution of the acquired qualitative images (TI images).2
Here, we present cardiac motion-corrected T1 mapping in a short breath-hold of 8s with an in-plane resolution of 1.3x1.3mm². The same raw data is used both for cardiac motion estimation from cine images and high-resolution T1 mapping.3 Due to cardiac motion correction, images obtained during 80% of each cardiac cycle could be used for T1 mapping, improving the acquisition efficiency by a factor of 5 to standard T1 mapping approaches.
The proposed method was evaluated using native T1 mapping in 10 healthy volunteers and its clinical feasibility was shown in two patients with focal myocardial fibrosis by comparing post-contrast T1 maps to late gadolinium enhancement (LGE) images.
METHODS
Data acquisition: 2D slices were acquired continuously with golden-angle radial sampling (Figure 1). Data were acquired within a breath-hold on 3 tesla (Verio, Siemens Healthineers): flip angle: 5°, TE/TR: 2.03/4.93ms, FOV: 320x320 mm², resolution: 1.3x1.3x8.0 mm³, acquisition time: 8s and inversion pulses were applied every 2276ms.
Motion estimation: Data was retrospectively binned into 15 cardiac motion states and cine images were reconstructed iteratively using spatial and temporal total variation regularisation.4 Non-rigid cardiac motion estimation was performed on these cine images using NiftyReg.5
T1 mapping: In each cardiac cycle, 15 TI images were reconstructed of exactly the same cardiac phases as used for cine reconstruction. Images were reconstructed using non-Cartesian iterative SENSE.6 Estimated inverse deformation fields were applied to TI images to correct for cardiac motion. Three systolic cardiac phases were excluded to minimize through-plane motion artefacts, resulting in a total T1 mapping window of 80% per cardiac cycle. T1, M0 and the flip angle were voxel-wise obtained by a 3-parameter fit to the signal model of the acquisition.3,7
In vivo imaging: The approach was applied without contrast agent in 10 healthy subjects (6 males, aged 31.3±8.4years) in a mid-ventricular short axis orientation (T1moco). For comparison, T1 maps were also obtained without motion correction of the same TI images (T1uncorr) and using the standard cardiac-gated approach (T11phase, using only data from a window of 168ms per cardiac cycle). Post-contrast T1 maps were obtained in two patients with focal fibrosis (1 female/1 male, aged 48/66 years) after contrast administration (0.15 mmol/(kg body weight) Gadoteridol). To detect focal fibrosis, LGE images were acquired 15 minutes after contrast administration.
Evaluation: T1 values were assessed in six myocardial segments and in the left-ventricular blood pool.8 For precision analysis, the standard deviation (STD) of native T1 in each segment was determined and differences were assessed by a comparison between T11phase and T1moco by a Wilcoxon signed-rank test in each segment across healthy volunteers. In both post-contrast T1moco maps, T1 values of the fibrotic segment were compared against T1 of all healthy segments using ANOVA (GraphPad Prism).
RESULTS AND DISCUSSION
Cine images had a consistent contrast over all cardiac phases and motion estimation succeeded in all subjects, with only small residual motion (Figure 2). The window length of each cardiac bin was between 55 and 87 ms, depending on the heart rate (46-73 bpm).
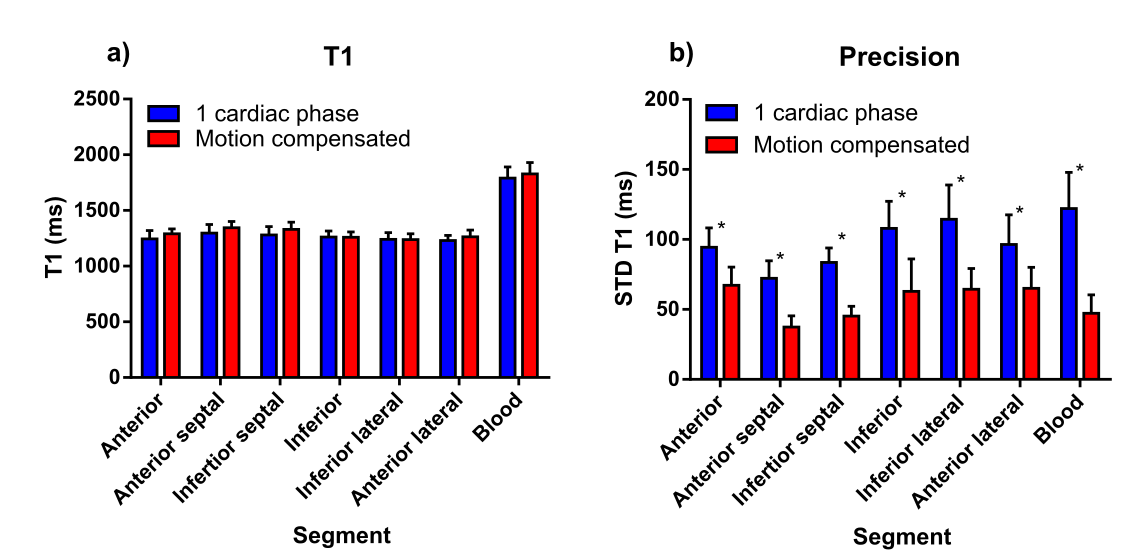
T1 maps are shown in figure 3. T1moco and T11phase times over all myocardial segments and healthy volunteers were 1287.2±46.7ms and 1258.7±26.0ms, respectively (Figure 4a).
T1moco maps had a 40% lower STD compared to T11phase maps in all myocardial segments and in blood (averaged over all myocardial segments: 57.0±12.5 and 94.8±15.4 ms, respectively, P<0.004, Figure 4b). The total amount of data used for T1moco mapping was on average 5.2 (4.3–6.8, depending on heart rate) times higher compared to T11phase mapping, leading to the improvement in precision.
In post-contrast T1 maps, the border between myocardium and blood was better defined in the T1moco maps compared to the T1uncorr maps (Figure 5). Focal fibrosis could be detected in post-contrast T1moco maps at the same location as in the LGE images by a decreased T1 value in the fibrotic segment compared to all healthy segments (-69.5±11.9ms and -51.8±12.0ms, P<0.001).
CONCLUSION
The
presented approach provided high-resolution T1 maps within 8s. By continuous
data acquisition and integration of cardiac motion correction, the data
acquisition efficiency for T1 mapping was improved by a factor of 5, resulting
in more precise T1 maps (40% lower standard deviation). The approach was successfully applied in
two patients leading to accurate detection of focal fibrosis.Acknowledgements
No acknowledgement found.References
1. Schelbert EB, Messroghli DR. State of the Art: Clinical Applications of Cardiac T1 Mapping. Radiology 2016;278(3):658-676.
2. Piechnik SK, Ferreira VM, Dall’Armellina E, Cochlin LE, Greiser A, Neubauer S, Robson MD. Shortened Modified Look-Locker Inversion recovery (ShMOLLI) for clinical myocardial T1-mapping at 1.5 and 3 T within a 9 heartbeat breathhold. J Cardiovasc Magn Reson 2010;12(1):69.
3. Becker KM, Schulz‐Menger J, Schaeffter T, Kolbitsch C. Simultaneous high‐resolution cardiac T1 mapping and cine imaging using model‐based iterative image reconstruction. Magn Reson Med 2018;00:1–12.
4. Block KT, Uecker M, Frahm J. Undersampled radial MRI with multiple coils. Iterative image reconstruction using a total variation constraint. Magnetic Resonance Imaging 2007;57(6),1086–1098.
5. Modat M, Ridgway GR, Taylor ZA, et al. Fast free-form deformation using graphics processing units. Comput Methods And Programs Biomed.2010;98(3),278–284.
6. Pruessmann KP, Weiger M, Boernert P, Boesiger P. Advances in sensitivity encoding with arbitrary k-space trajectories. Magn Reson Med 2001;46(4),638–651.
7. Deichmann R, Haase A. Quantification of T1 Values by SNAPSHOT-FLASH NMR Imaging. J Magn Reson. 1992;96:608-612.
8. Cerqueira MD, Weissman NJ, Dilsizian V, Jacobs AK, Kaul S, Laskey WK, et al. Standardized myocardial segmentation and nomenclature for tomographic imaging of the heart: a statement for healthcare professionals from the Cardiac Imaging Committee of the Council on Clinical Cardiology of the American Heart Association. Circulation 2002;105(4):539-42.
Figures