0776
Quantitative Magnetization Transfer Imaging of Human Myocardial Tissue and Scar1King's College London, London, United Kingdom, 2MR Research Collaborations, Siemens Healthcare Limited, Frimley, United Kingdom
Synopsis
We have developed a contrast-free single breath-hold 2D MT mapping technique using a two-pool exchange model and dictionary matching to parametrize macromolecular changes associated with myocardial fibrosis. The model was validated in vials with different albumin concentrations and bovine leg. Pool sizes ratio and bound pool T2 maps were obtained from 7 healthy subjects and two patients with ischemic or non-ischemic scar/fibrosis. . Reduced PSR and T2B values were found to correlate with LGE areas in both patients. In vivo quantitative MT mapping of the heart was performed for the first time, showing promising results for the detection of myocardial fibrosis.
Background
The presence
of myocardial scar following infarction has been shown to have important
prognostic implications for patients with ischemic cardiomyopathy, however, the
current gold standard Late Gadolinium Enhancement (LGE) requires the injection
of a contrast agent. Alternatively, magnetization transfer (MT) has been shown
to be sensitive to changes in macromolecular content such as an increase in
collagen[1] and thus has potential for non-contrast assessment of
myocardial scar[2]. In this study we developed a contrast-free
quantitative single breath-hold 2D MT mapping technique for myocardial tissue
characterization.Methods
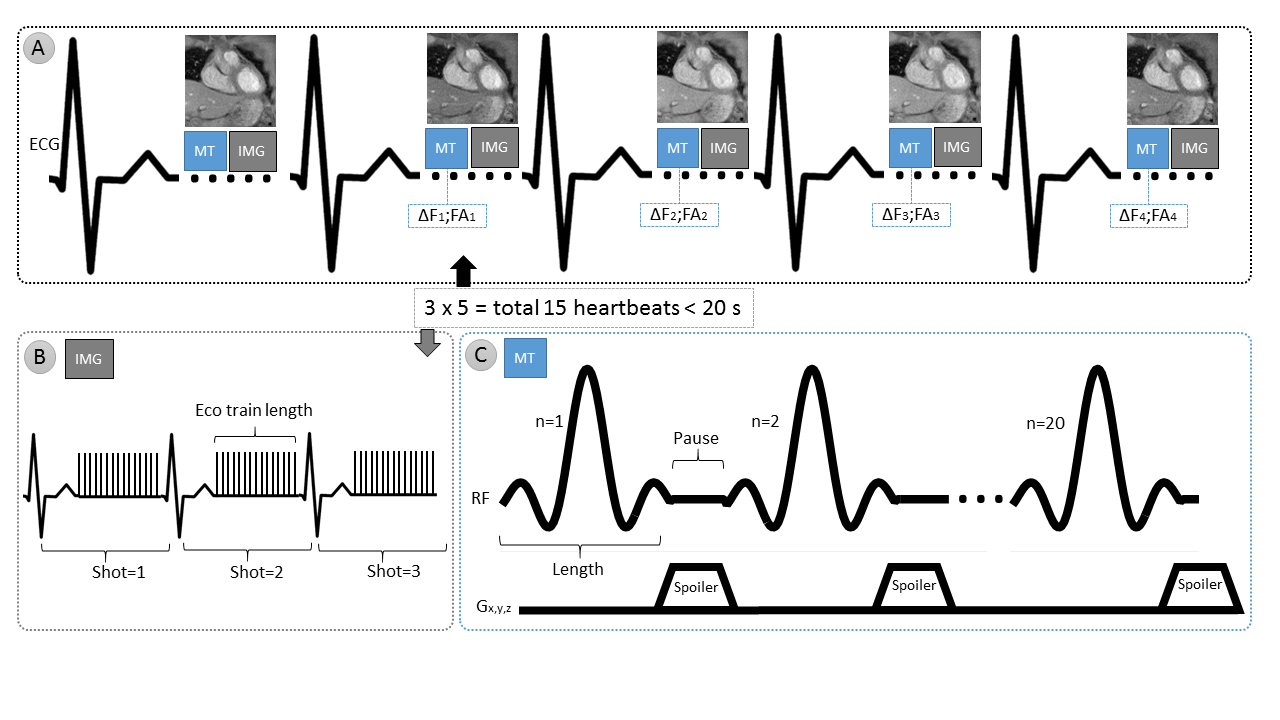
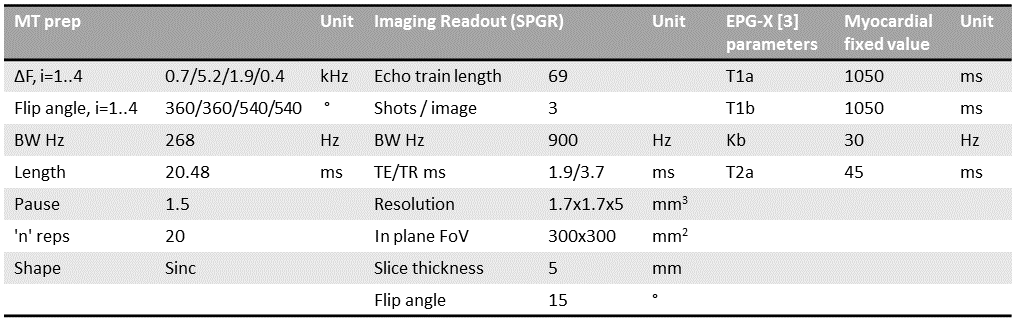
An ECG-triggered 2D MT mapping sequence is proposed, acquiring 4 different MT-weighted and 1 non-MT-weighted reference dataset, within a single breath-hold. The imaging module consists of a spoiled Gradient Echo (SPGR) sequence and the MT preparation consists of a train of sinc pulses with varying frequency offsets and flip angles (Figures 1 & 2).
The obtained signal is parametrized via a free vs bound pool exchange model, based on the EPG-X method[3], which extends the classic EPG framework to include a fourth configuration state, related to the longitudinal magnetization of the bound pool, made up of macromolecules with extremely short T2 relaxation times. The RF pulses are considered to instantly saturate the bound pool at a rate determined by its super-Lorentzian absorption shape. The shaped RF pulses are modelled with a flat amplitude using Ramani’s power-equivalent approximation[4].
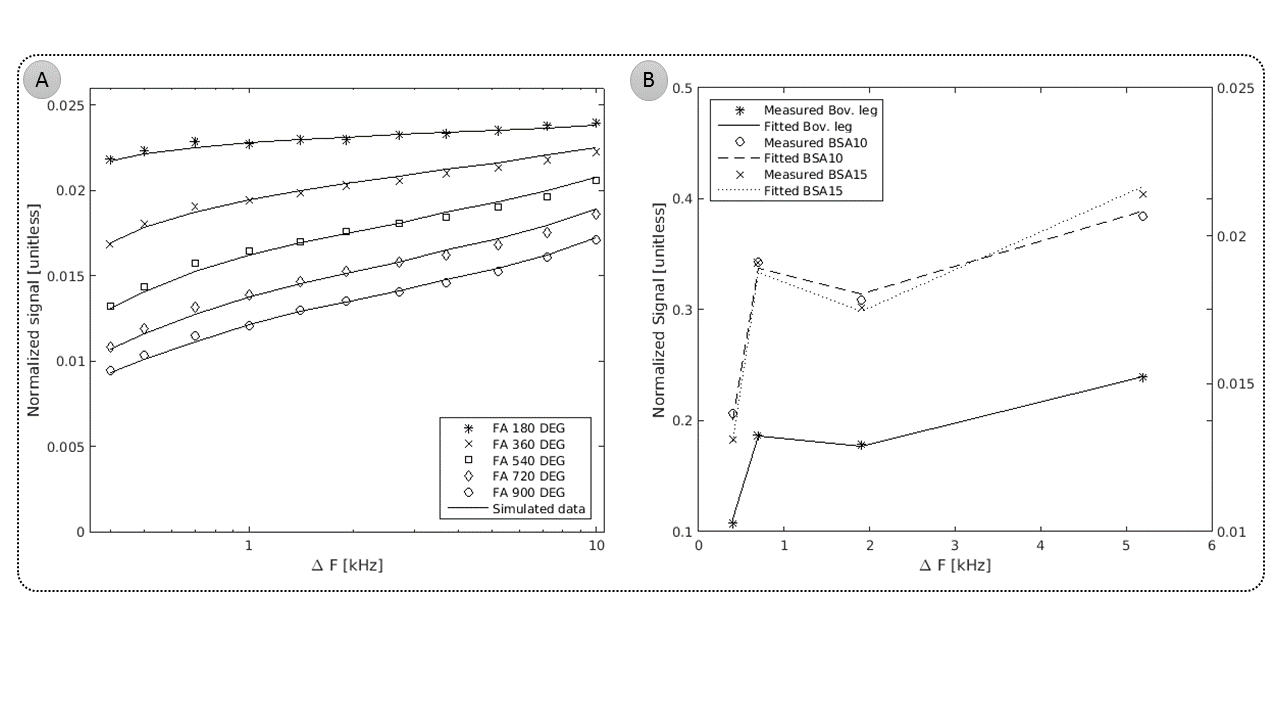
A dictionary is created for every acquisition by varying two of the model’s parameters: the pool size ratio (PSR=2:0.5:25 %) and the T2 of the bound pool (T2B=2:1:25 us), separately, while all other parameters are fixed to literature values (Figure 2). Measured data is Beltrami filtered[5], then both measured and dictionary data are normalised and pixel-wise matched using a least squares method.
Bovine Serum Albumin (BSA) vials with different albumin concentration (10% and 15 %) were used for model validation. First, 56 different MT-weighted datasets were acquired and ground truth PSR and T2B mean values were calculated using all datasets. Next, PSR and T2B mean values were calculated using all possible combinations of four MT weightings. Only those combinations that produced PSR and T2B values within the error of ground truth values were considered. Finally, the proposed combination of MT weightings was selected by minimising the mean fit error (MFE) of the match,
$$ MFE = 100 \times \frac{1}{\bar{m}}\sqrt{\frac{\sum{(m_i - b_i)^2}}{n}} $$
where m is measured value, b is fitted value, n is number of fitting points and $$$ \bar{m} $$$ is mean value of all measured points.
The proposed sequence for MT mapping of myocardial tissue was subsequently tested on a sample of fresh bovine leg and 7 healthy human subjects. Two patients with LGE findings were also scanned and the results are presented here.
Results
In the BSA phantom, ground truth mean values of PSR (BSA-10=6.0±0.9%; BSA-15=9.1±1.1%) and T2B (BSA-10=11.7±1.2μs; BSA-15=12.7±1.5μs) were comparable with previous reports[6]. No statistical significance was found using only the four proposed MT weightings as described in Figure 1: PSR (BSA-10=5.7±1.2%; BSA-15=8.9±0.9%) and T2B (BSA-10=11.2±1.9μs; BSA15=13.1±1.7μs). Average MFE was 1.1% (Figure 3).
In bovine leg, mean PSR was 13.6±0.8% and T2B was 9.1±2.3μs.
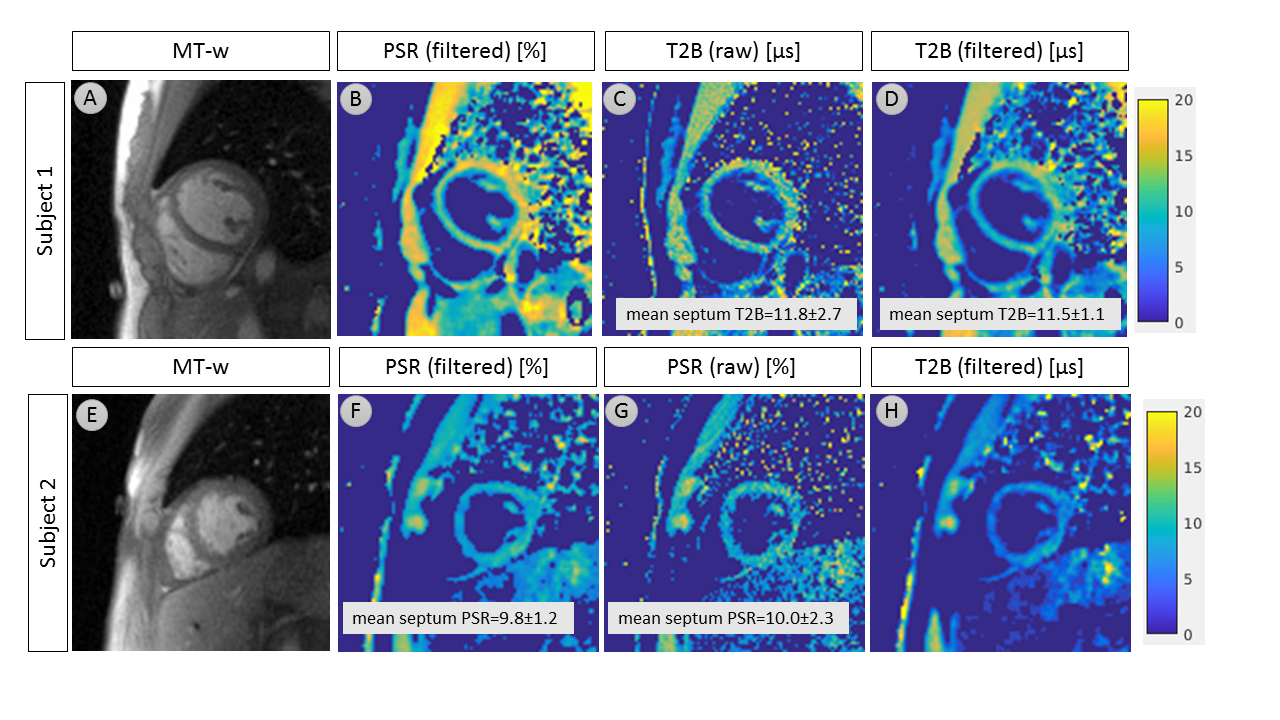
In healthy human subjects, septum mid left ventricle PSR was 11.8±2.5% and T2B was 12.4±2.9μs. Two representative subjects are shown in Figure 4. Non-denoised maps are also shown for comparison.
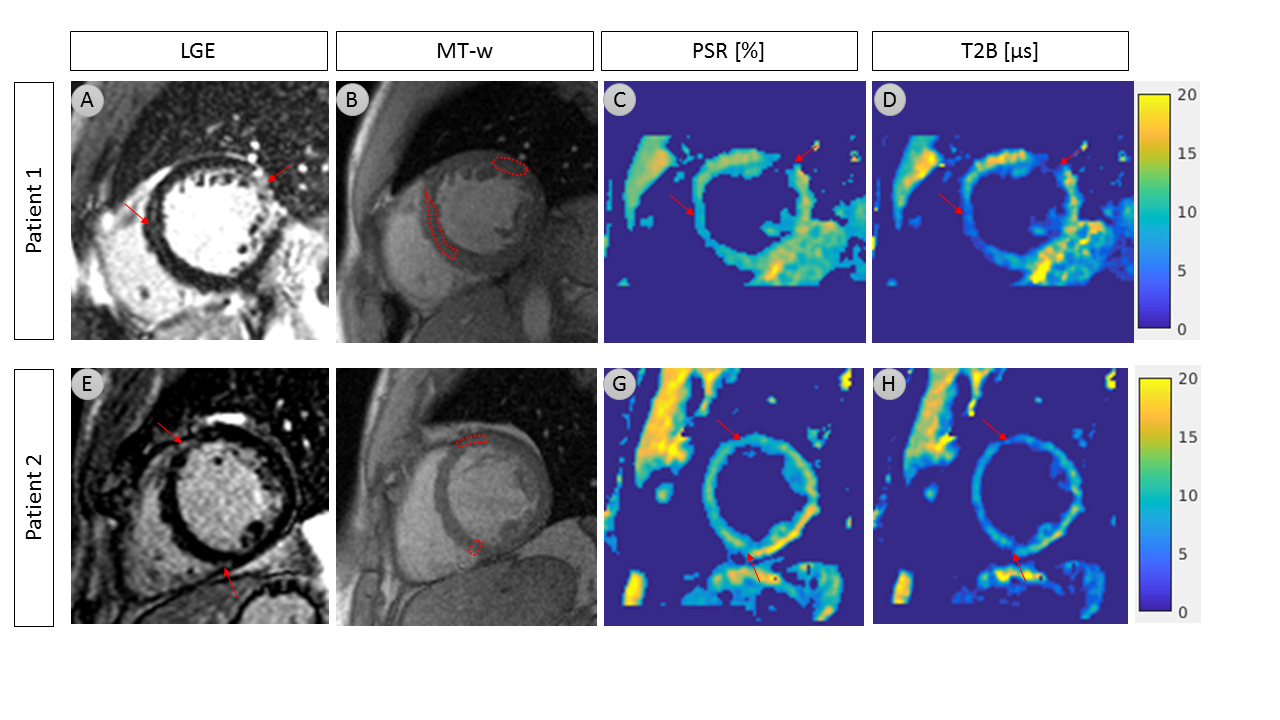
Patient 1 (post myocardial infarction) showed reduced PSR (scar: 7.1±0.9%; remote: 12.2±1.1%, p<0.01) and strongly reduced T2B (scar: 4.2±0.9μs; remote: 13.9±4.2μs, p<0.01) in correlation with location and extent of LGE. Patient 2, who had extensive mid-wall fibrosis, with a pattern that is indicative of a non-ischemic cardiomyopathy, also showed reduced PSR (fibrotic: 7.6±0.7%; remote: 13.6±1.5%, p<0.01) and T2B (fibrotic: 3.9±0.9μs; remote: 11.1±1.9μs, p<0.01) in areas with LGE, as shown in Figure 5.
Discussion
Validation of the two spin-pool exchange model in a BSA phantom and bovine leg samples showed good agreement with literature values[6,7]. Furthermore, Beltrami de-noising resulted in improved precision without affecting accuracy.
Myocardial PSR and T2B mapping in healthy subjects showed similar values to previous reports in skeletal muscle[8]. To the best of our knowledge, this is the first time MT mapping has been performed in the human heart.
Reduced PSR values associated with LGE in post MI patients may be consistent with reduced MT ratio found in previous studies[9]. Strongly reduced T2B in both patients with ischemic and non-ischemic scar/fibrosis might be an alternative to PSR and possibly a more sensitive indicator of fibrosis, as it relates solely to the bound pool.
Conclusion
We have demonstrated that human myocardial quantitative MT mapping is feasible and can be done in a <20s breath-hold. Future work will validate our preliminary findings in a larger patient cohort.Acknowledgements
This work was supported by the EPSRC Centre for Doctoral Training in Medical Imaging (EP/L015226/1), Siemens Healthcare GmbH and by EPSRC grants EP/P001009/1 and EP/P007619/1.References
[1] Phinikaridou A et. al.. In vivo magnetization transfer and diffusion-weighted magnetic resonance imaging detects thrombus composition in a mouse model of deep vein thrombosis. Circulation: Cardiovascular Imaging. 2013 May;6(3):433-40.
[2] Crooijmans HJ, et. al. Cardiovascular magnetization transfer ratio imaging compared with histology: a postmortem study. Journal of magnetic resonance imaging. 2014 Oct;40(4):915-9.
[3] Malik, S. J. et. al. “Extended phase graph formalism for systems with magnetization transfer and exchange”. Magnetic resonance in medicine, 80(2), (2018), 767-779.
[4] Ramani A, et. al. Precise estimate of fundamental in‐vivo MT parameters in human brain in clinically feasible times. Magn Reson Imaging 2002; 20: 721–731.
[5] Fernandez, J. J., and Martinez, J. A. Three-dimensional feature-preserving noise reduction for real-time electron tomography. Digital Signal Processing, 20(4), (2010), 1162-1172.
[6] Dortch, Richard D., et al. "Quantitative magnetization transfer imaging in human brain at 3 T via selective inversion recovery." Magnetic resonance in medicine 66.5 (2011): 1346-1352.
[7] Sled, John G., and G. Bruce Pike. "Quantitative imaging of magnetization transfer exchange and relaxation properties in vivo using MRI." Magnetic Resonance in Medicine: An Official Journal of the International Society for Magnetic Resonance in Medicine 46.5 (2001): 923-931.
[8] Sinclair, Christopher DJ, et al. "Quantitative magnetization transfer in in vivo healthy human skeletal muscle at 3 T." Magnetic resonance in medicine 64.6 (2010): 1739-1748.
[9] Germain, P., et. al. “A dual flip angle 3D bSSFP magnetization transfer‐like method to differentiate between recent and old myocardial infarction.” Journal of Magnetic Resonance Imaging, 47(3), (2018): 798-808.
Figures