0771
Cross-scanner and cross-protocol harmonisation of multi-shell diffusion MRI data: open challenge and evaluation results1Harvard Medical School, Boston, MA, United States, 2Brigham and Women's Hospital, Boston, MA, United States, 3University College London, London, United Kingdom, 4University of Southern California, Los Angeles, CA, United States, 5New York University, New York, NY, United States, 6Boston Children's Hospital, Boston, MA, United States, 7RWTH Aachen University, Aachen, Germany, 8King's College London, London, United Kingdom, 9Eindhoven University of Technology, Eindhoven, Netherlands, 10Cardiff University, Cardiff, United Kingdom
Synopsis
We present a comparison of twelve different methods that estimate mappings between scanners for multi-shell diffusion MRI data harmonisation. The methods are evaluated on a benchmark dataset acquired from 15 subjects using two scanners that both have a standard and a state-of-the-art protocol. The results show that cross-vendor harmonisation and spatial/angular resolution enhancement of multi-shell diffusion data sets can be performed reliably using suitable algorithms. The dataset is available upon request and can serve as a useful testbed for the development diffusion MRI harmonisation algorithms.
Introduction
Harmonisation of scanner and protocol-related variability in diffusion magnetic resonance imaging (dMRI) data has become a pressing need in multi-center clinical studies1-8. It could increase the statistical power and sensitivity of clinical studies. Moreover, harmonisation techniques could also enable low-quality data acquired using out-dated protocols and scanners to provide information similar to the state-of-the-art data. This work reports the results from multi-shell diffusion MRI harmonisation and enhancement challenge (MUSHAC), which is a continuation of the single-shell dMRI harmonisation challenge9,10. Since multi-shell acquisitions become more common in clinical studies, methods that exploit b-value dependency may improve the performance of dMRI harmonisation. This work reports the results of twelve methods, including but not limited to8,21,22, that were trained and evaluated on a dataset provided by the MUSHAC.
Methods
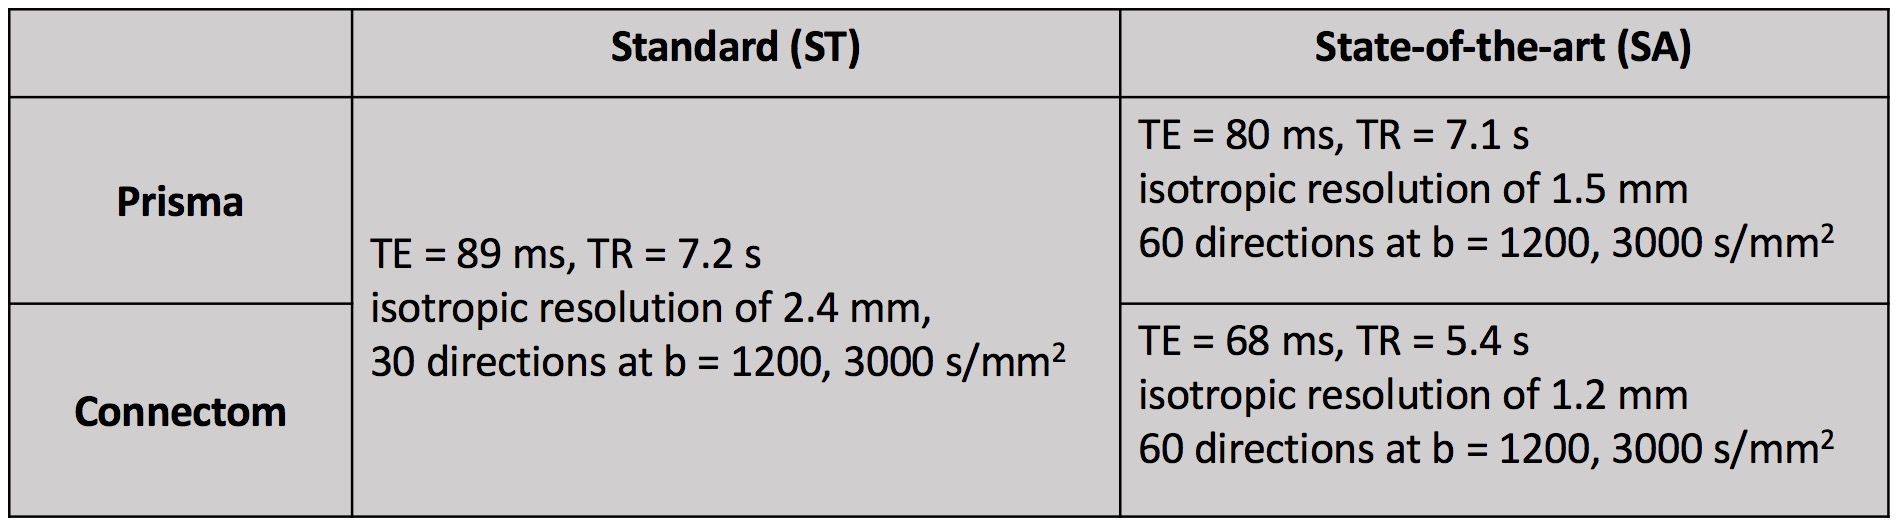
Data: 15 healthy volunteers were scanned on a 3T Siemens Prisma and 3T Siemens Connectom Scanner. On both scanners, dMRI images were acquired with a ‘standard’ (ST) protocol and a ‘state-of-the-art’ (SA) protocol. The SA protocol uses multi-band acquisition and short TE to improve the spatial- and angular- resolution per unit time. Table 1 shows the detailed parameters of the protocols. Additional b=0 s/mm2 images were acquired with TE and/or TR matching between protocols as well as structural MPRAGEs for each scanner. The data from 10 randomly selected subjects were used as training data and the remaining 5 subjects were used for testing.
Preprocessing: The b0 volumes were corrected for EPI distortions by applying FSL TOPUP on reversed phase-encoding pairs11. The data was corrected for eddy current induced distortions, subject motion, EPI distortions, and gradient-nonlinearity distortions with FSL TOPUP/eddy12 and in-house software kindly provided by MGH. Spatiotemporally varying b-vectors and b-values due to gradient nonlinearities of the Connectom scanner were made available14-16. All data were affinely registered to Prisma-ST using the corresponding fractional anisotropy (FA) maps with appropriate b-matrix rotation.
Tasks: This competition includes two tasks. Task 1 is to predict Connectom-ST data using Prisma-ST data where both datasets have matching TE, TR as well as angular and spatial resolution. Task 2 includes two sub-tasks on the prediction of Prisma-SA data (Task 2a) and Connectom-SA data (Task 2b) given Prisma-ST data.
Evaluation: We compared the predicted data and the ground truth using the differences in several dMRI measures, including fractional anisotropy (FA), mean diffusivity (MD), rotationally invariant spherical harmonic (RISH) features L0 and L2, mean kurtosis17 (MK), and the return-to-origin probability18,19 (RTOP) measures. We also computed the normalized error between dMRI signals. The performances were evaluated in brain regions specified by brain masks excluding the cerebellum, obtained with the Geodesic Information Flow (GIF) algorithm20. The percentage error (PE) and the absolute-value of PE (APE) of the dMRI measures were computed globally within the mask and regionally based on FreeSurfer regions excluding the cerebellum.
Algorithms: Twelve algorithms from seven research groups were evaluated for Task 1. Eight of these algorithms were also evaluated for Task 2a and Task 2b. All the algorithms represent signals either using spherical harmonics or multi-shell signal models21. Algorithms 1, 2, 3 used interpolation methods to match the resolutions. Algorithms 4, 5, 6 were based on regression techniques8. Algorithms 7 to 12 were developed based on neural networks22. Algorithms 4, 7, 8 updated their results after MUSHAC. This work reports the latest results.
Results
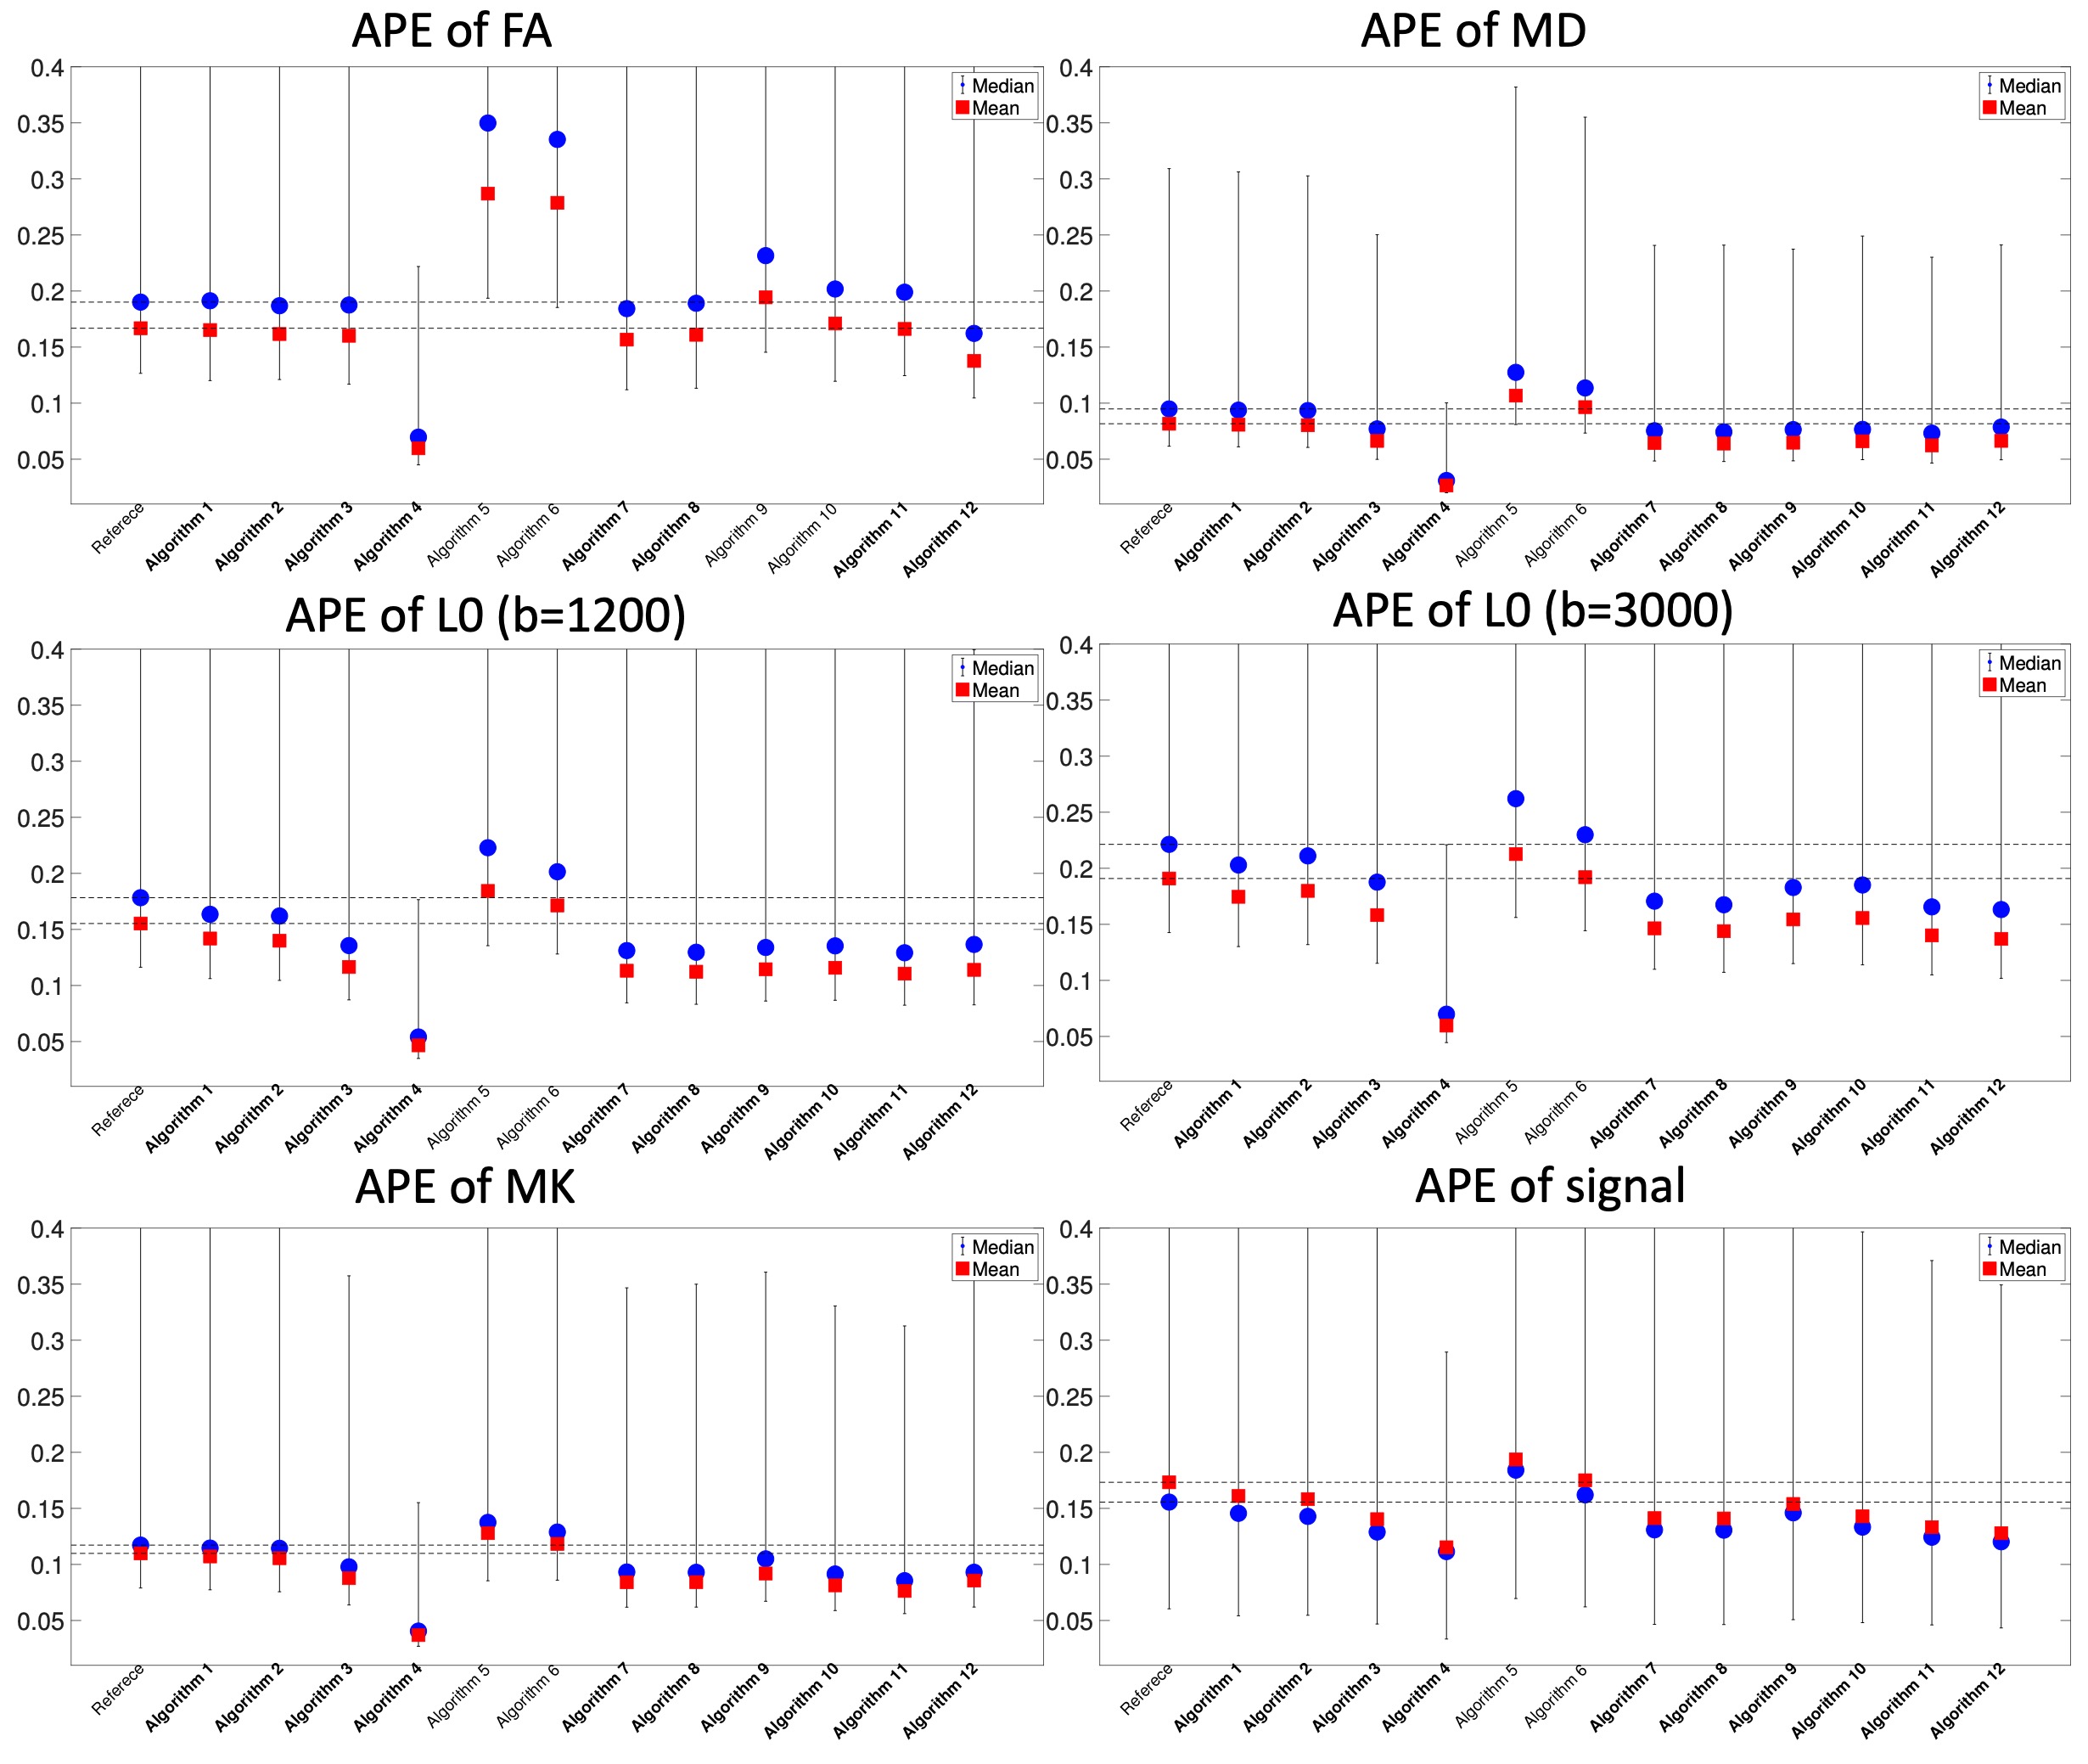
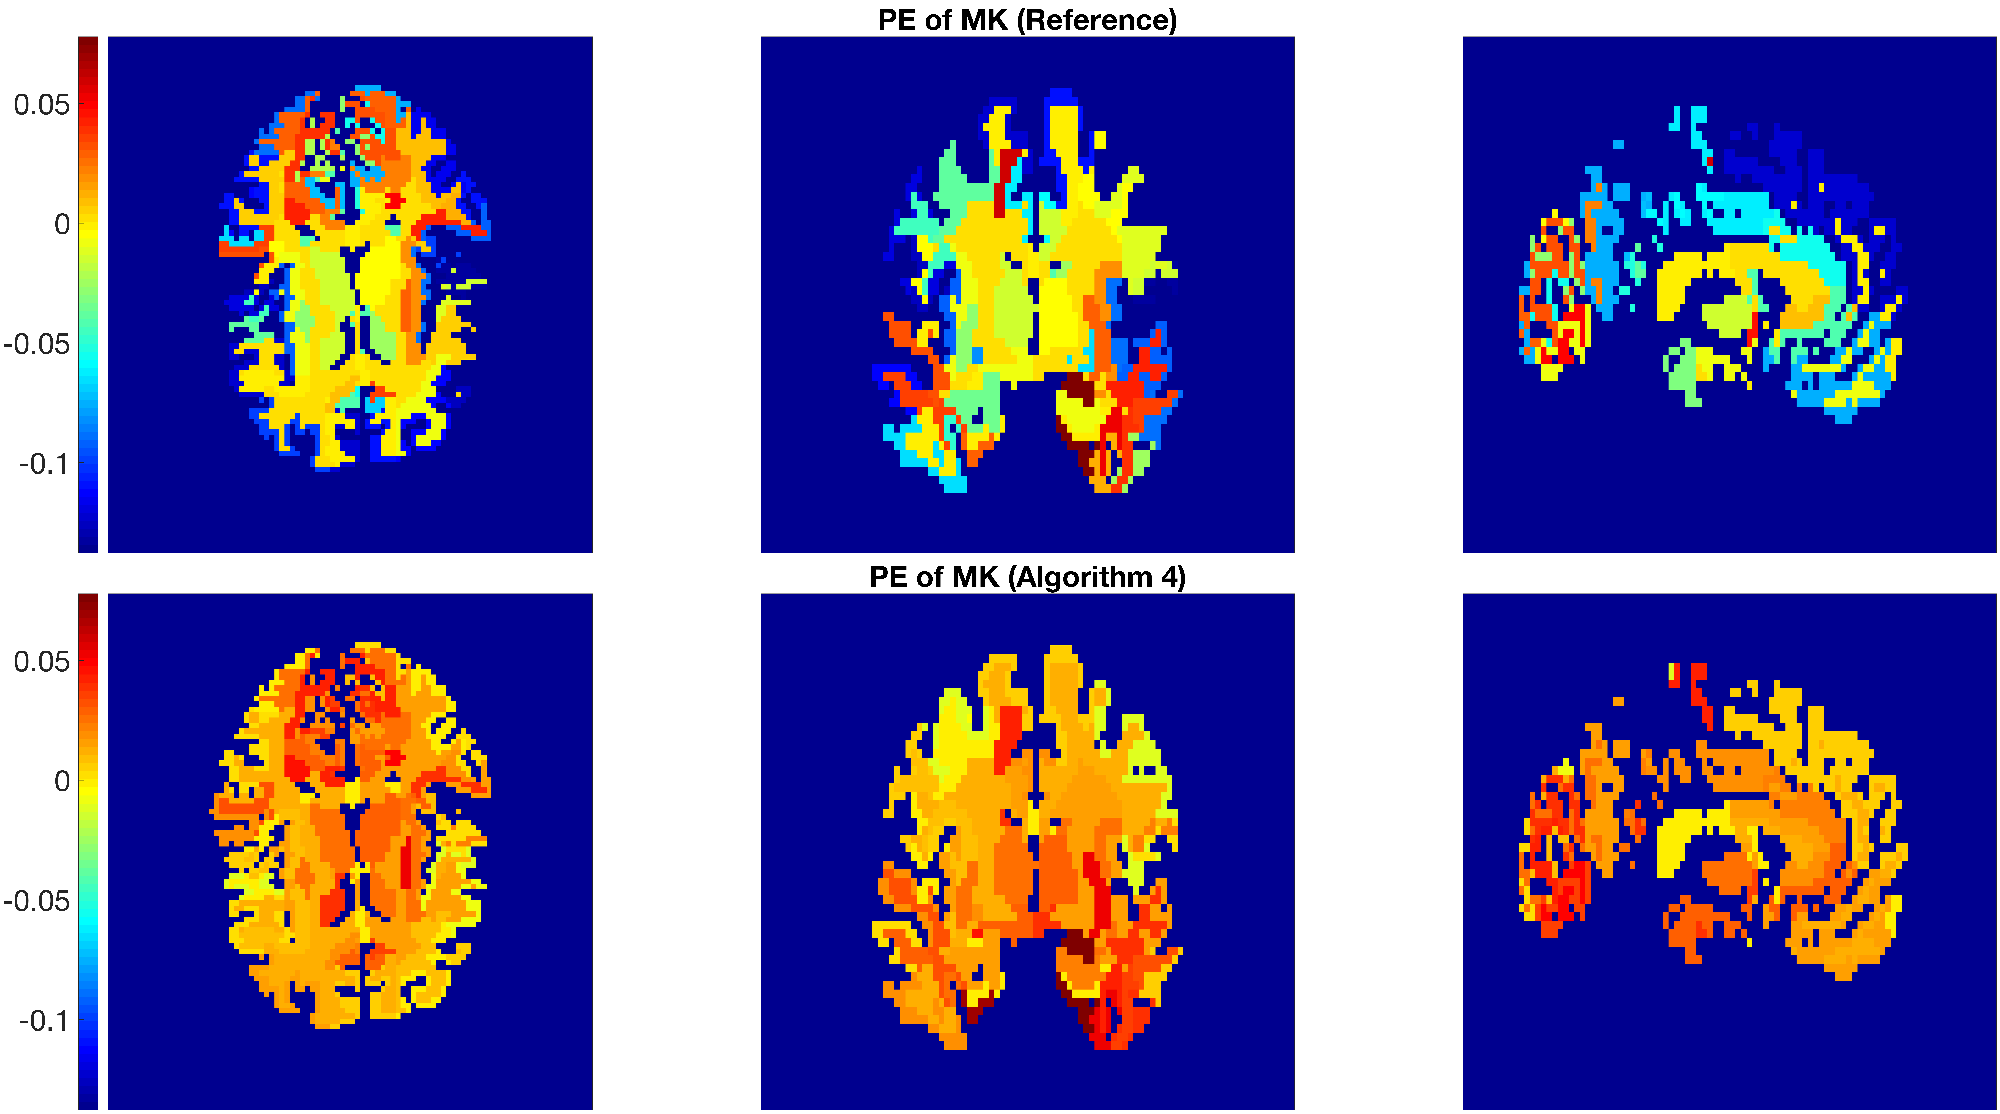
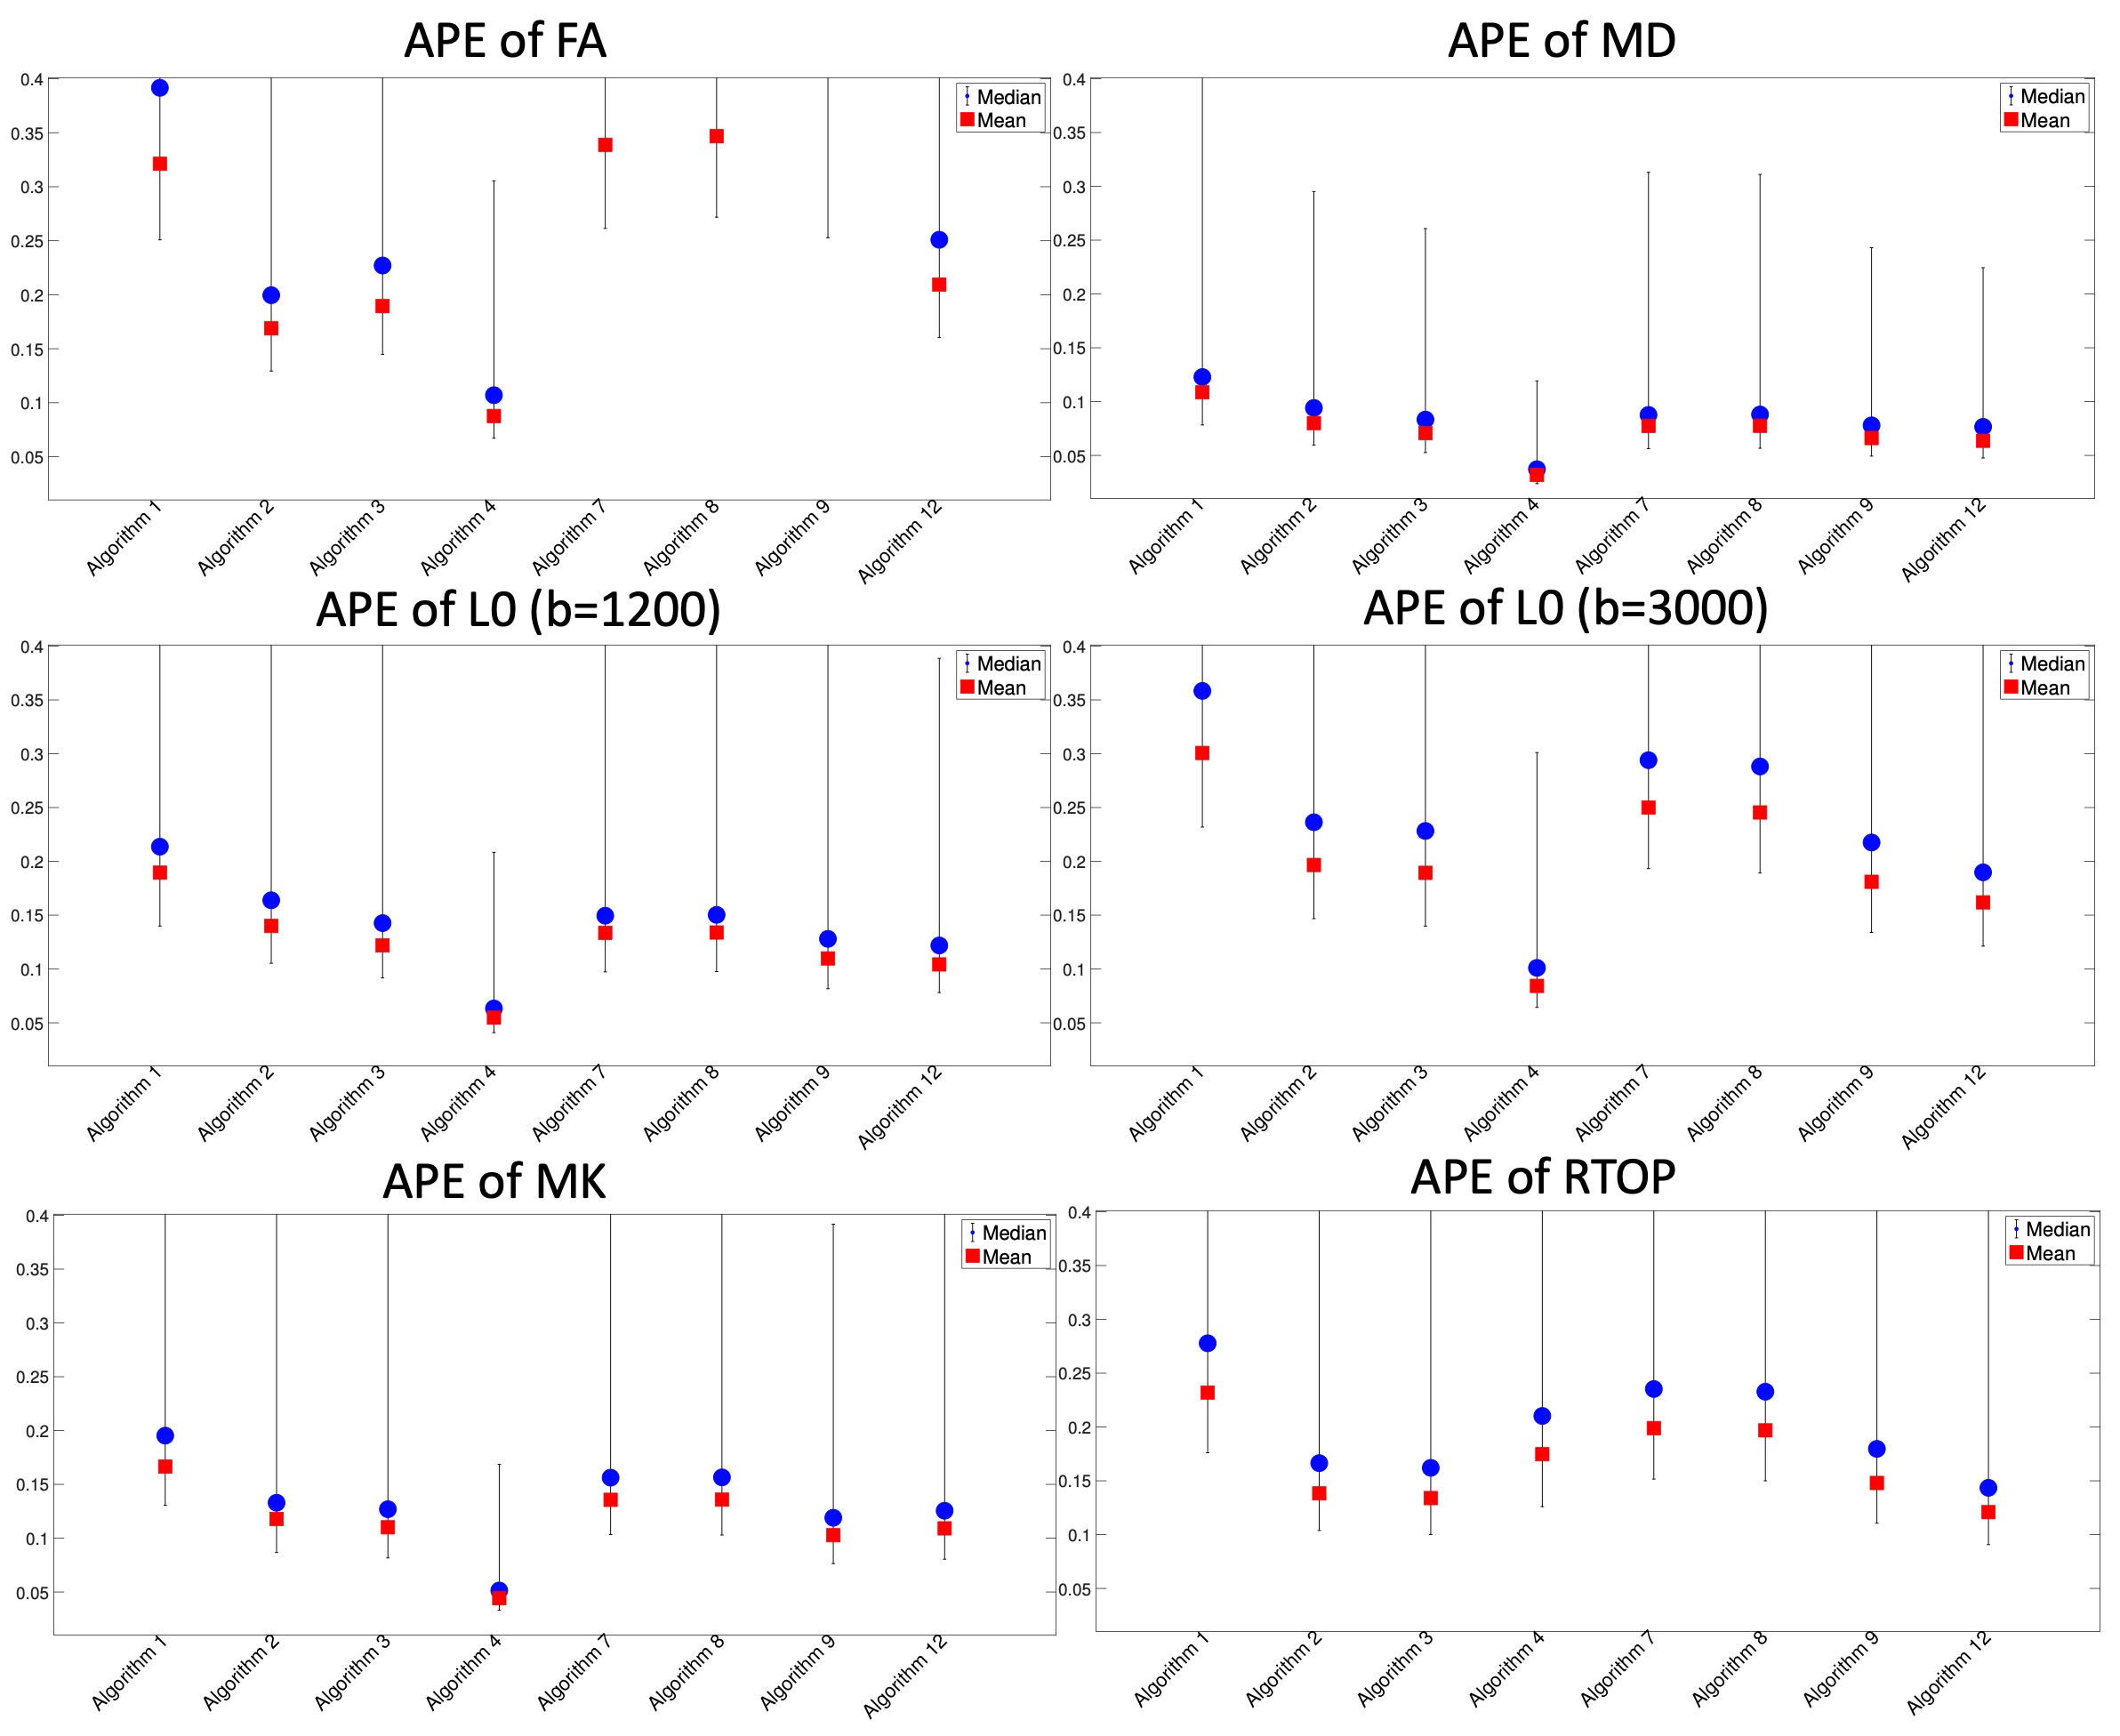
Task 1: Figure 2 shows the mean (red square) and median (blue circle) of APE for FA, MD, L0 for the two b-shells and the dMRI signals. The two horizontal lines are the mean and median of the reference data without using any harmonisation algorithm. Several algorithms, especially Algorithm 4, have clear improvements over the reference. Figure 3 illustrates the region-wise PE of MK for the reference and Algorithm 4. The harmonised data significantly reduced the error in almost all brain regions.
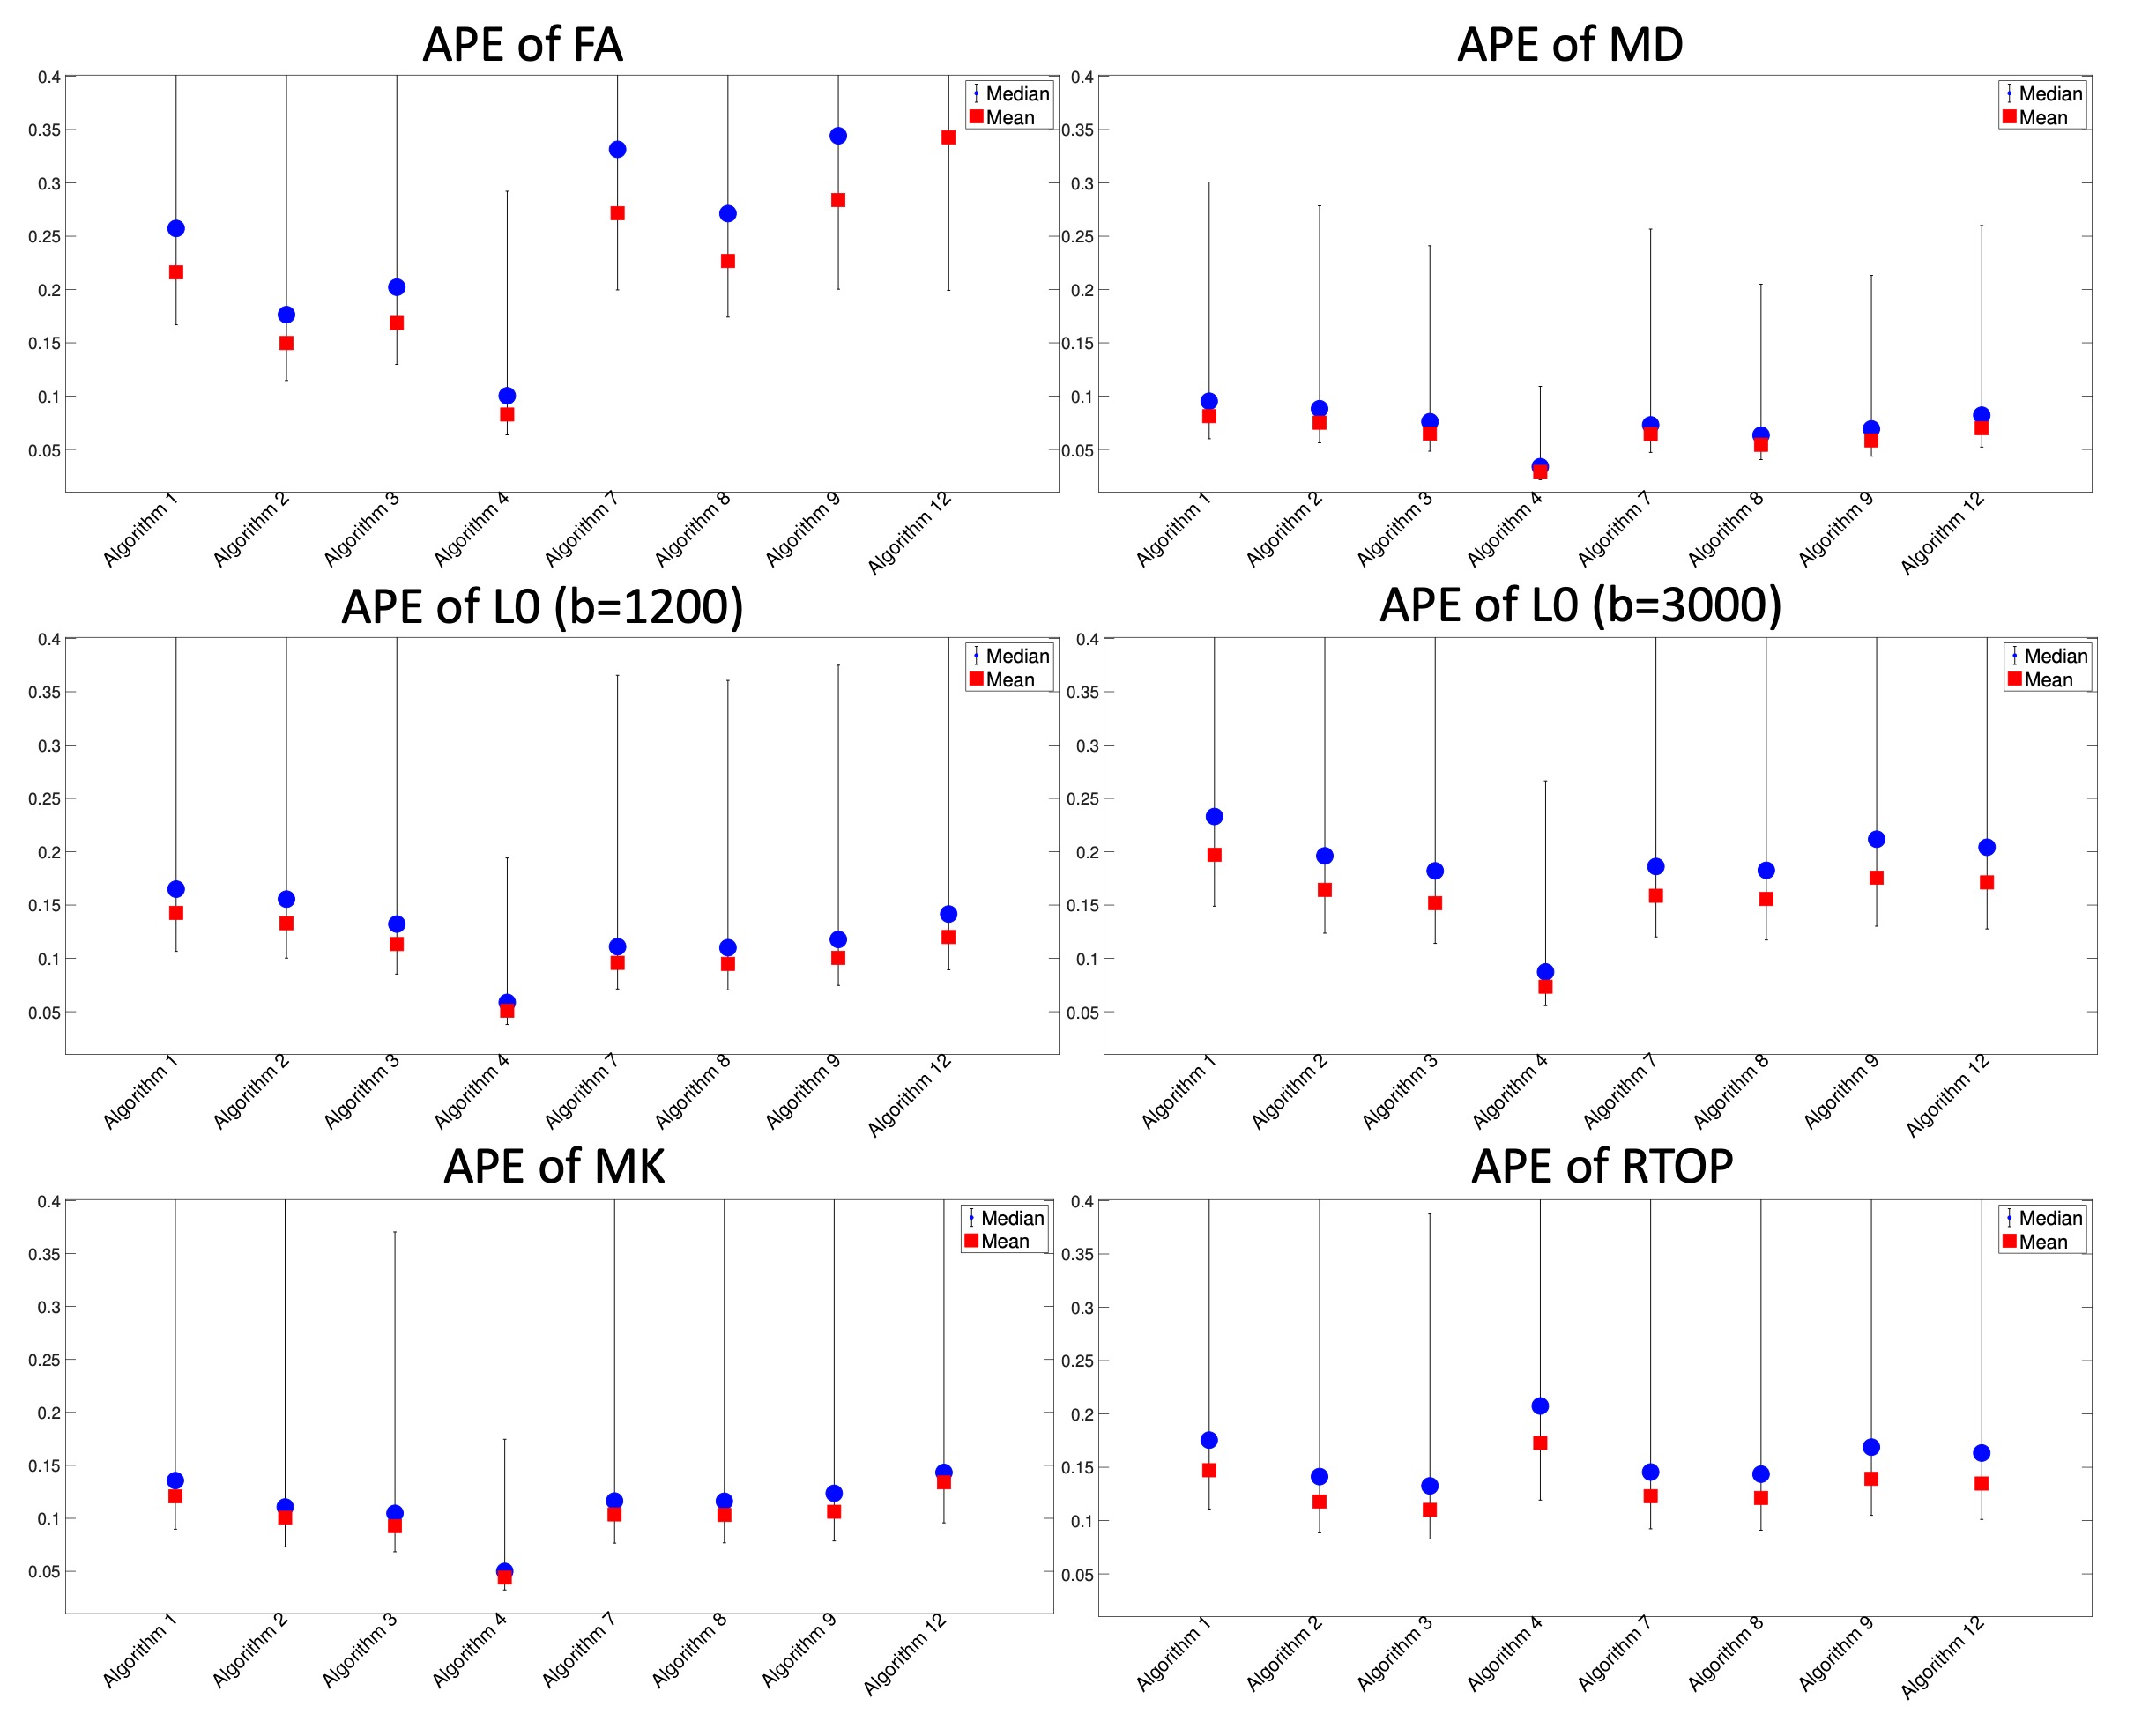
Task 2: Figures 4 and 5 show the mean and median for the APE for FA, MD, L0 for two b-shells and RTOP. Similar to Task 1, Algorithm 4 consistently has the best performance, followed by Algorithm 3. The higher APE for RTOP is potential due to a sub-optimal regularization parameter when evaluating RTOP.
Discussion and Conclusion
We presented the latest results from the MUSHAC challenge where we compared twelve algorithms that harmonise multi-shell dMRI data acquired across scanners and protocols. The comparison reveals the promises and shortcomings of different dMRI harmonisation techniques.
The results show that Algorithm 4 has the best performance in most tasks, which may be attributed to that it adaptively selected the training data based on their similarities to the test data. The advantage of adaptive selection reveals the large inter-subject variance in the training data, which may limit the performance of other algorithms.
Acknowledgements
CMWT is supported by a Rubicon grant (680-50-1527) from the Netherlands Organisation for Scientific Research (NWO) and Wellcome Trust grant (096646/Z/11/Z). LN is supported in part by NIH grants R21MH115280 and R21MH116352. This project has received funding from the European Union’s Horizon 2020 research and innovation programme under grant agreement No. 634541 and from the Engineering and Physical Sciences Research Council (EPSRC EP/R006032/1 and EP/M020533/1), funding FG. DKJ was supported by MRC grant MR/K004360/1. Scan costs were supported by the National Centre for Mental Health (NCMH) with funds from Health and Care Support Wales and by the Wellcome Trust. JV is a Postdoctoral Fellow of the Research Foundation - Flanders (FWO; grant number 12S1615N). AZ has received funding from the European Union's Horizon 2020 research and innovation programme under grant agreement No 765148. SK was supported by the International Research Training Group 2150 of the German Research Foundation (DFG). EBC was supported by Prostate Cancer UK (Grant PG14-018-TR2) and by the Engineering and Physical Sciences Research Council (EPSRC ref.: EP/M020533/1).References
1. Vollmar, C., O’Muircheartaigh, J., Barker, G.J., Symms, M.R., Thompson, P., Kumari, V., Duncan, J.S., Richardson, M.P., Koepp, M.J.: Identical, but not the same: Intra-site and inter-site reproducibility of fractional anisotropy measures on two 3.0t scanners. NeuroImage 51(4) (2010) 1384 – 1394
2. Landman, B.A., Farrell, J.A., Jones, C.K., Smith, S.A., Prince, J.L., Mori, S.: Effects of diffusion weighting schemes on the reproducibility of DTI-derived fractional anisotropy, mean diffusivity, and principal eigenvector measurements at 1.5T. NeuroImage 36(4) (2007) 1123 – 1138
3. Landman, B.A., Huang, A.J., Gifford, A., Vikram, D.S., Lim, I.A.L., Farrell, J.A., Bogovic, J.A., Hua, J., Chen, M., Jarso, S., Smith, S.A., Joel, S., Mori, S., Pekar, J.J., Barker, P.B., Prince, J.L., van Zijl, P.C.: Multi-parametric neuroimaging reproducibility: A 3-T resource study. NeuroImage 54(4) (2011) 2854 – 2866
4. Pohl, K.M., Sullivan, E.V., Rohlfing, T., Chu, W., Kwon, D., Nichols, B.N., Zhang, Y., Brown, S.A., Tapert, S.F., Cummins, K., Thompson, W.K., Brumback, T., Col- rain, I.M., Baker, F.C., Prouty, D., Bellis, M.D.D., Voyvodic, J.T., Clark, D.B., Schirda, C., Nagel, B.J., Pfefferbaum, A.: Harmonizing DTI measurements across scanners to examine the development of white matter microstructure in 803 ado- lescents of the NCANDA study. NeuroImage 130 (2016) 194 – 213
5. Fortin, J.P., Parker, D., Tun, B., Watanabe, T., Elliott, M.A., Ruparel, K., Roalf, D.R., Satterthwaite, T.D., Gur, R.C., Gur, R.E., Schultz, R.T., Verma, R., Shinohara, R.T.: Harmonization of multi-site diffusion tensor imaging data. NeuroImage 161 (2017) 149 – 170
6. Mirzaalian, H., Ning, L., Savadjiev, P., Pasternak, O., Bouix, S., Michailovich, O., Grant, G., Marx, C., Morey, R., Flashman, L., George, M., McAllister, T., Andaluz, N., Shutter, L., Coimbra, R., Zafonte, R., Coleman, M., Kubicki, M., Westin, C., Stein, M., Shenton, M., Rathi, Y.: Inter-site and inter-scanner diffusion MRI data harmonization. NeuroImage 135 (2016) 311 – 323
7. Mirzaalian, H., Ning, L., Savadjiev, P., Pasternak, O., Bouix, S., Michailovich, O., Karmacharya, S., Grant, G., Marx, C.E., Morey, R.A., Flashman, L.A., George, M.S., McAllister, T.W., Andaluz, N., Shutter, L., Coimbra, R., Zafonte, R.D., Coleman, M.J., Kubicki, M., Westin, C.F., Stein, M.B., Shenton, M.E., Rathi, Y.: Multi-site harmonization of diffusion MRI data in a registration framework. Brain Imaging and Behavior 12(1) (Feb 2018) 284–295
8. Karayumak, S.C., Bouix, S., Ning, L., James, A., Crow, T., Shenton, M., Ku- bicki, M., Rathi, Y.: Retrospective harmonization of multi-site diffusion MRI data acquired with different acquisition parameters. NeuroImage 184 (2019) 180 – 200
9. Tax, C., et al.: Cross-vendor and cross-protocol harmonisation of diffusion tensor imaging data: a comparative study. In: ISMRM-ESMRMB. Program # 0471 (2018)
10. Tax, C., et al.: Cross-scanner and cross-protocol diffusion MRIdata harmonisation: A benchmark database and evaluation of algorithms. submitted (2018)
11. Andersson, J.L., Skare, S., Ashburner, J.: How to correct susceptibility distortions in spin-echo echo-planar images: application to diffusion tensor imaging. NeuroImage 20(2) (2003) 870 – 888
12. Andersson, J.L., Sotiropoulos, S.N.: An integrated approach to correction for off-resonance effects and subject movement in diffusion MR imaging. NeuroImage 125 (2016) 1063 – 1078
13. Glasser, M.F., Sotiropoulos, S.N., Wilson, J.A., Coalson, T.S., Fischl, B., Anders- son, J.L., Xu, J., Jbabdi, S., Webster, M., Polimeni, J.R., Essen, D.C.V., Jenkinson, M.: The minimal preprocessing pipelines for the human connectome project. NeuroImage 80 (2013) 105 – 124
14. Bammer, R., Markl, M., Barnett, A., Acar, B., Alley, M., Pelc, N., Glover, G., Moseley, M.: Analysis and generalized correction of the effect of spatial gradient field distortions in diffusion-weighted imaging. Magnetic Resonance in Medicine 50(3) 560–569
15. Sotiropoulos, S.N., Jbabdi, S., Xu, J., Andersson, J.L., Moeller, S., Auerbach, E.J., Glasser, M.F., Hernandez, M., Sapiro, G., Jenkinson, M., Feinberg, D.A., Yacoub, E., Lenglet, C., Essen, D.C.V., Ugurbil, K., Behrens, T.E.: Advances in diffusion MRI acquisition and processing in the Human Connectome Project. NeuroImage 80 (2013) 125 – 143
16. Rudrapatna, S.U., Parker, G.D., Roberts, J., Jones, D.K.: Can we correct for interactions between subject motion and gradient-nonlinearity in diffusion MRI? In: ISMRM. Program #1206 (2018)
17. Jensen,J.H.,Helpern,J.A.,Ramani,A.,Lu,H.,Kaczynski,K.:Diffusionalkurtosis imaging: The quantification of non-gaussian water diffusion by means of magnetic resonance imaging. Magnetic Resonance in Medicine 53(6) (2005) 1432–1440
18. Öarslan,E.,Koay,C.G.,Shepherd,T.M.,Komlosh,M.E.,Irfanoglu,M.O.,Pier- paoli, C., Basser, P.J.: Mean apparent propagator (MAP) MRI: A novel diffusion imaging method for mapping tissue microstructure. NeuroImage 78 (2013) 16 – 32
19. Garyfallidis, E., Brett, M., Amirbekian, B., Rokem, A., Van Der Walt, S., De- scoteaux, M., Nimmo-Smith, I., Contributors, D.: Dipy, a library for the analysis of diffusion MRI data. Frontiers in Neuroinformatics 8 (2014) 8
20. Cardoso, M.J., Modat, M., Wolz, R., Melbourne, A., Cash, D., Rueckert, D., Ourselin, S.: Geodesic information flows: Spatially-variant graphs and their application to segmentation and fusion. IEEE Transactions on Medical Imaging 34(9) (2015) 1976–1988
21. Scherrer, B., Schwartzman, A., Taquet, M., Sahin, M., Prabhu, S.P., Warfield, S.K.: Characterizing brain tissue by assessment of the distribution of anisotropic mi- crostructural environments in diffusion compartment imaging (DIAMOND). Mag- netic Resonance in Medicine 76(3) (2016) 963–977
22. Blumberg, S.B., Tanno, R., Kokkinos, I., Alexander, D.C.: Deeper image quality transfer: Training low-memory neural networks for 3D images. In Frangi, A.F., Schnabel, J.A., Davatzikos, C., Alberola-López, C., Fichtinger, G., eds.: Medical Image Computing and Computer Assisted Intervention – MICCAI 2018. (2018) 118–125
Figures