0769
Double Echo Steady State (DESS) Cones for Motion-Robust Steady-State Diffusion-Weighted Imaging1Radiology, Stanford University, Stanford, CA, United States, 2Electrical Engineering, Stanford University, Stanford, CA, United States, 3Global MR Applications and Workflow, GE Healthcare, San Diego, CA, United States
Synopsis
Diffusion-Weighted Imaging (DWI) has shown potential for oncologic imaging without a contrast injection. However conventional methods are limited by low resolution and distortion. Steady-state DWI methods provide 3D, distortion-free images but are susceptible to motion artifacts. A Double Echo Steady State (DESS) method with a conical k-space trajectory is presented and assessed for motion artifact and diffusion-weighting with a focus on breast cancer imaging.
Introduction
Non-contrast-enhanced acquisitions continue to garner interest for oncologic body applications but EPI-based Diffusion-Weighted Imaging (DWI) is limited by susceptibility to motion and off-resonance. Steady-state DWI provides a 3D, distortion-free alternative but is also susceptible to to motion and may not achieve the same degree of diffusion-weighting for certain applications [1,2,3]. In this work we combine Double Echo Steady State (DESS) with a cones k-space trajectory with the goal of achieving higher diffusion-weighting with reduced motion susceptibility in a steady-state sequence. We focus on an initial application in breast MRI where robust non-contrast enhanced imaging could have immediate, wide clinical impact.
Methods
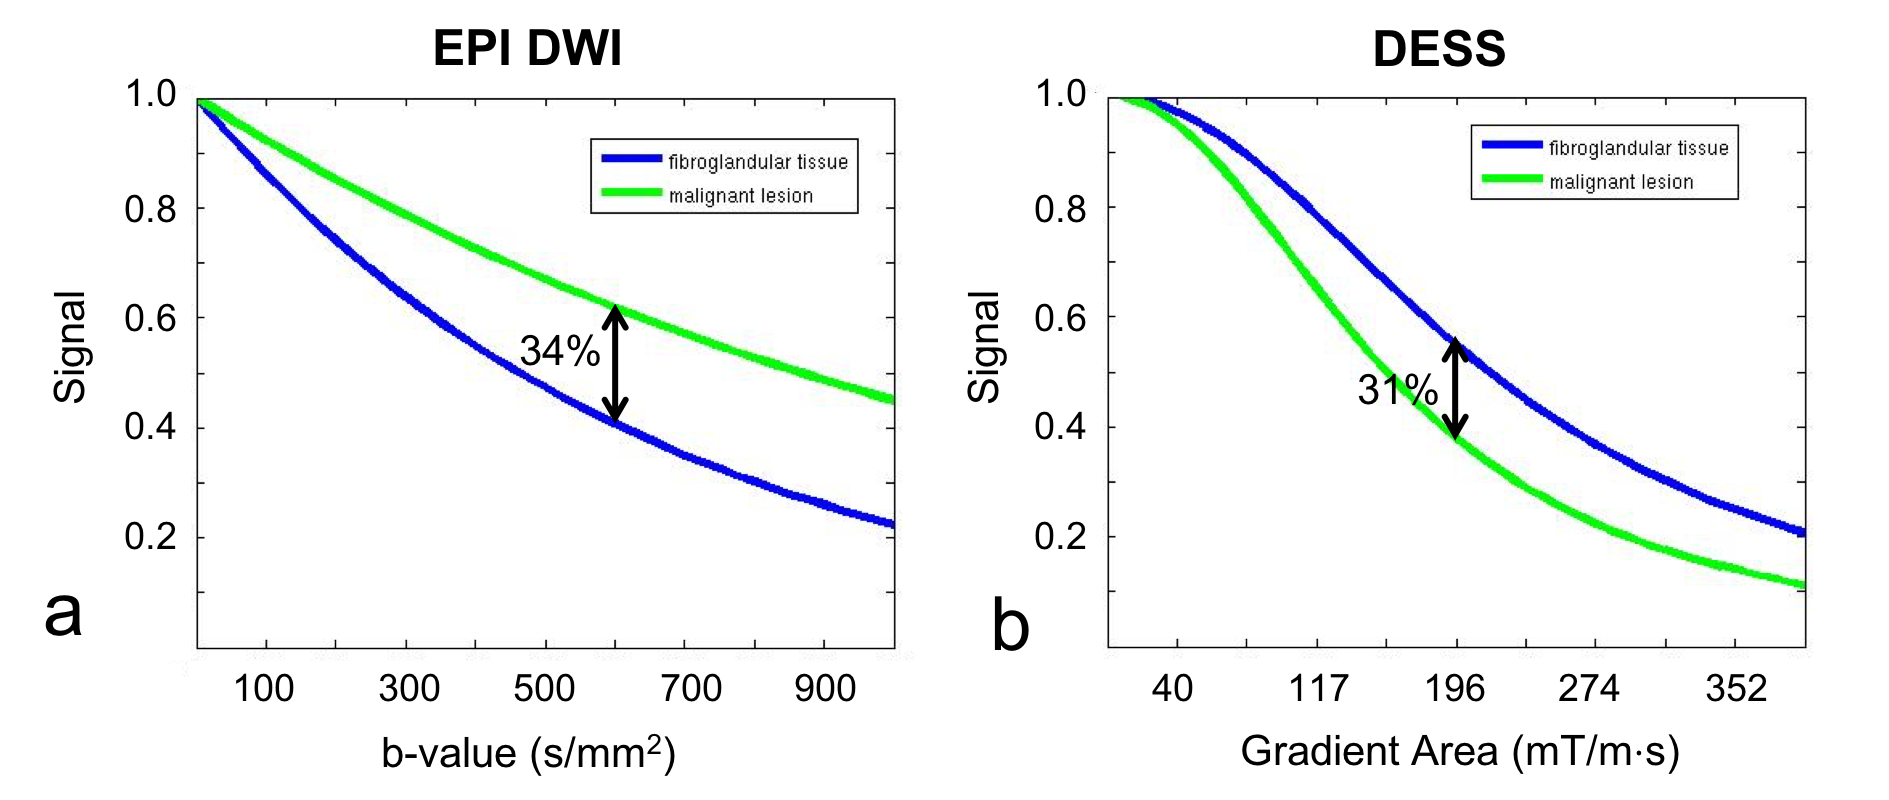
B-value Equivalent DESS Gradient Area:In steady-state DWI methods the relationship between applied diffusion gradient and degree of diffusion-weighting is not as direct as in EPI-DWI. However, on an application-by application basis, with known tissue T1s and T2s, the DESS gradient area required to achieve an equivalent contrast to a specific b-value can be calculated. With tissue values for a malignant lesion (T1 1400 ms, T2 50 ms, ADC 0.8 x 10⁻³mm2/s) and surrounding fibroglandular tissue (sameT1/T2, ADC 1.5 x 10⁻³mm2/s) the EPI and DESS tissue signals for a range of b-values and DESS gradient areas were simulated. Simulation results determined the range of DESS diffusion gradient areas in phantom and in-vivo experiments.
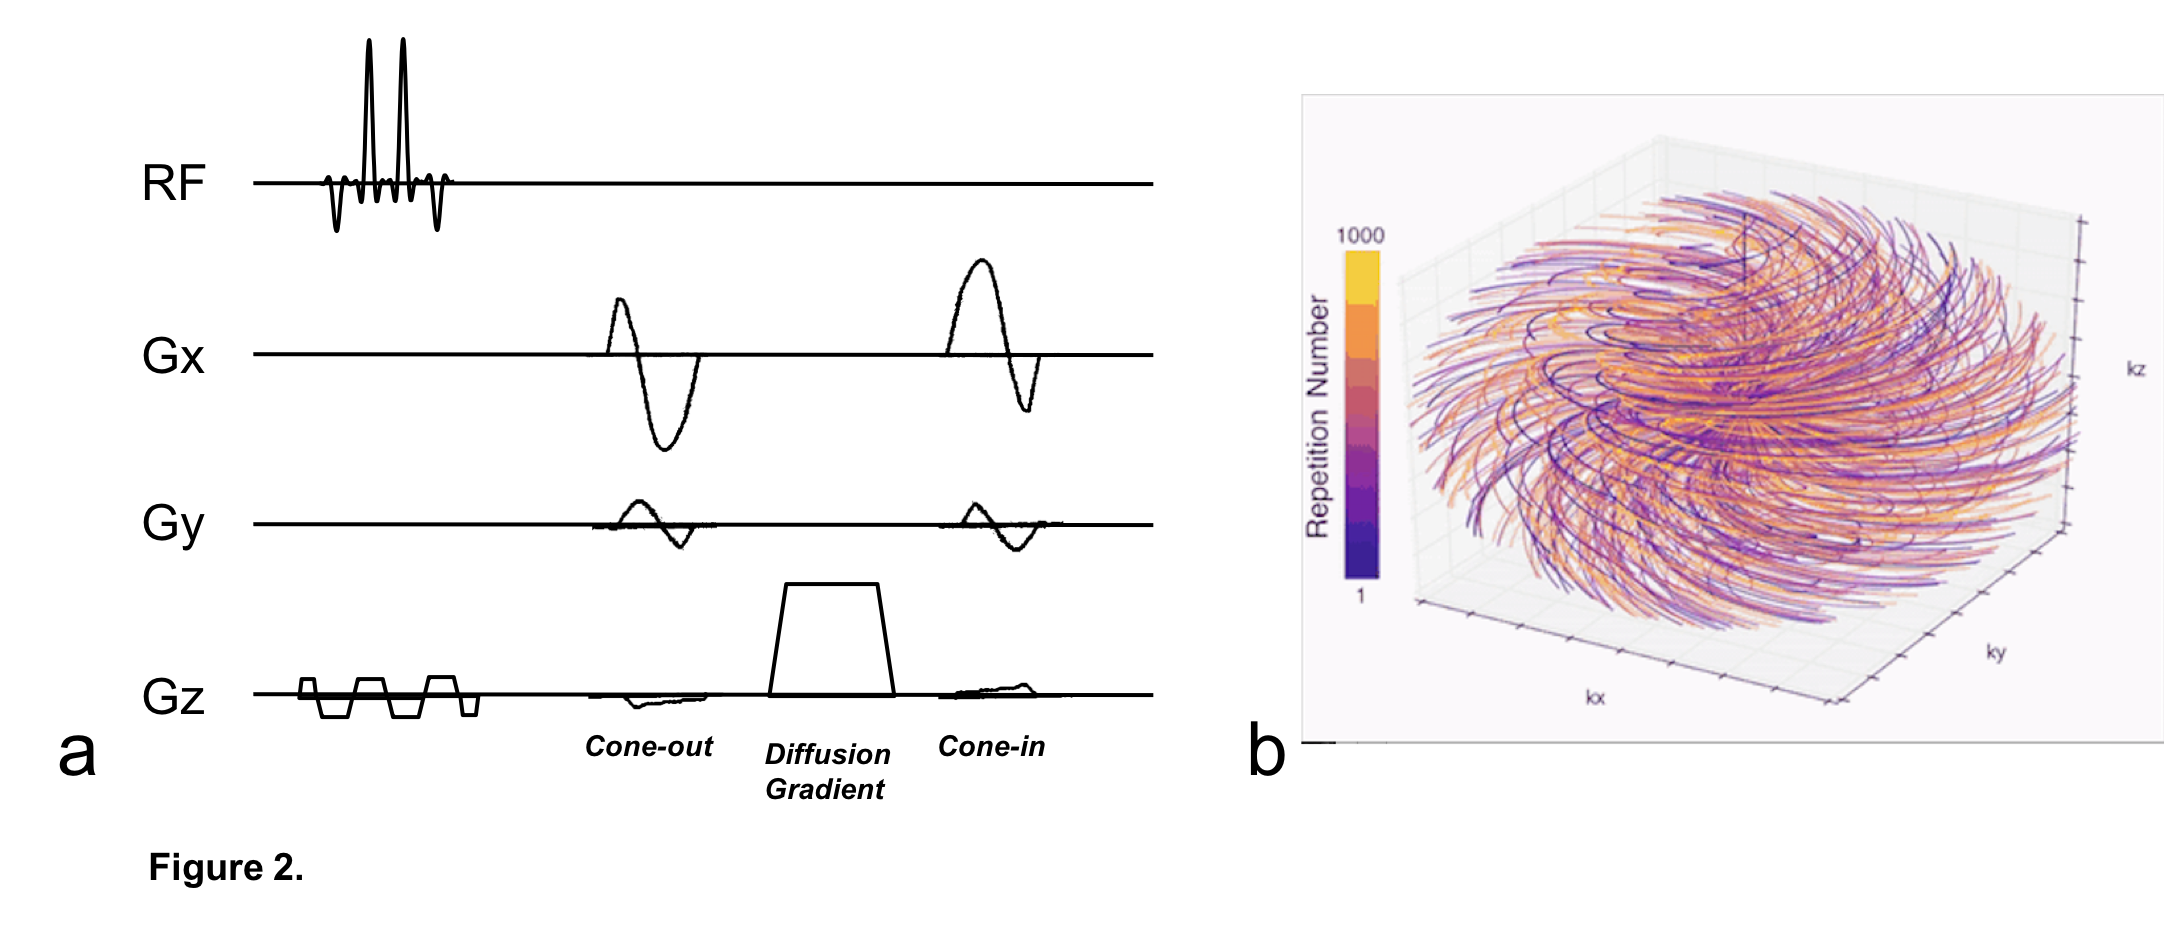
Sequence: A DESS acquisition with water-only excitation was implemented with a conical k-space trajectory [4] (Figure 1). Within each TR, the first echo samples a center-out conical interleaf with the second echo samples the same interleaf back in. The unbalanced gradient that imparts diffusion-weighting is applied between the two echoes. For this initial investigation, the diffusion gradient was applied only along the slice select axis and the ordering of the cones was sequential with regridding of the data was performed in BART [5].
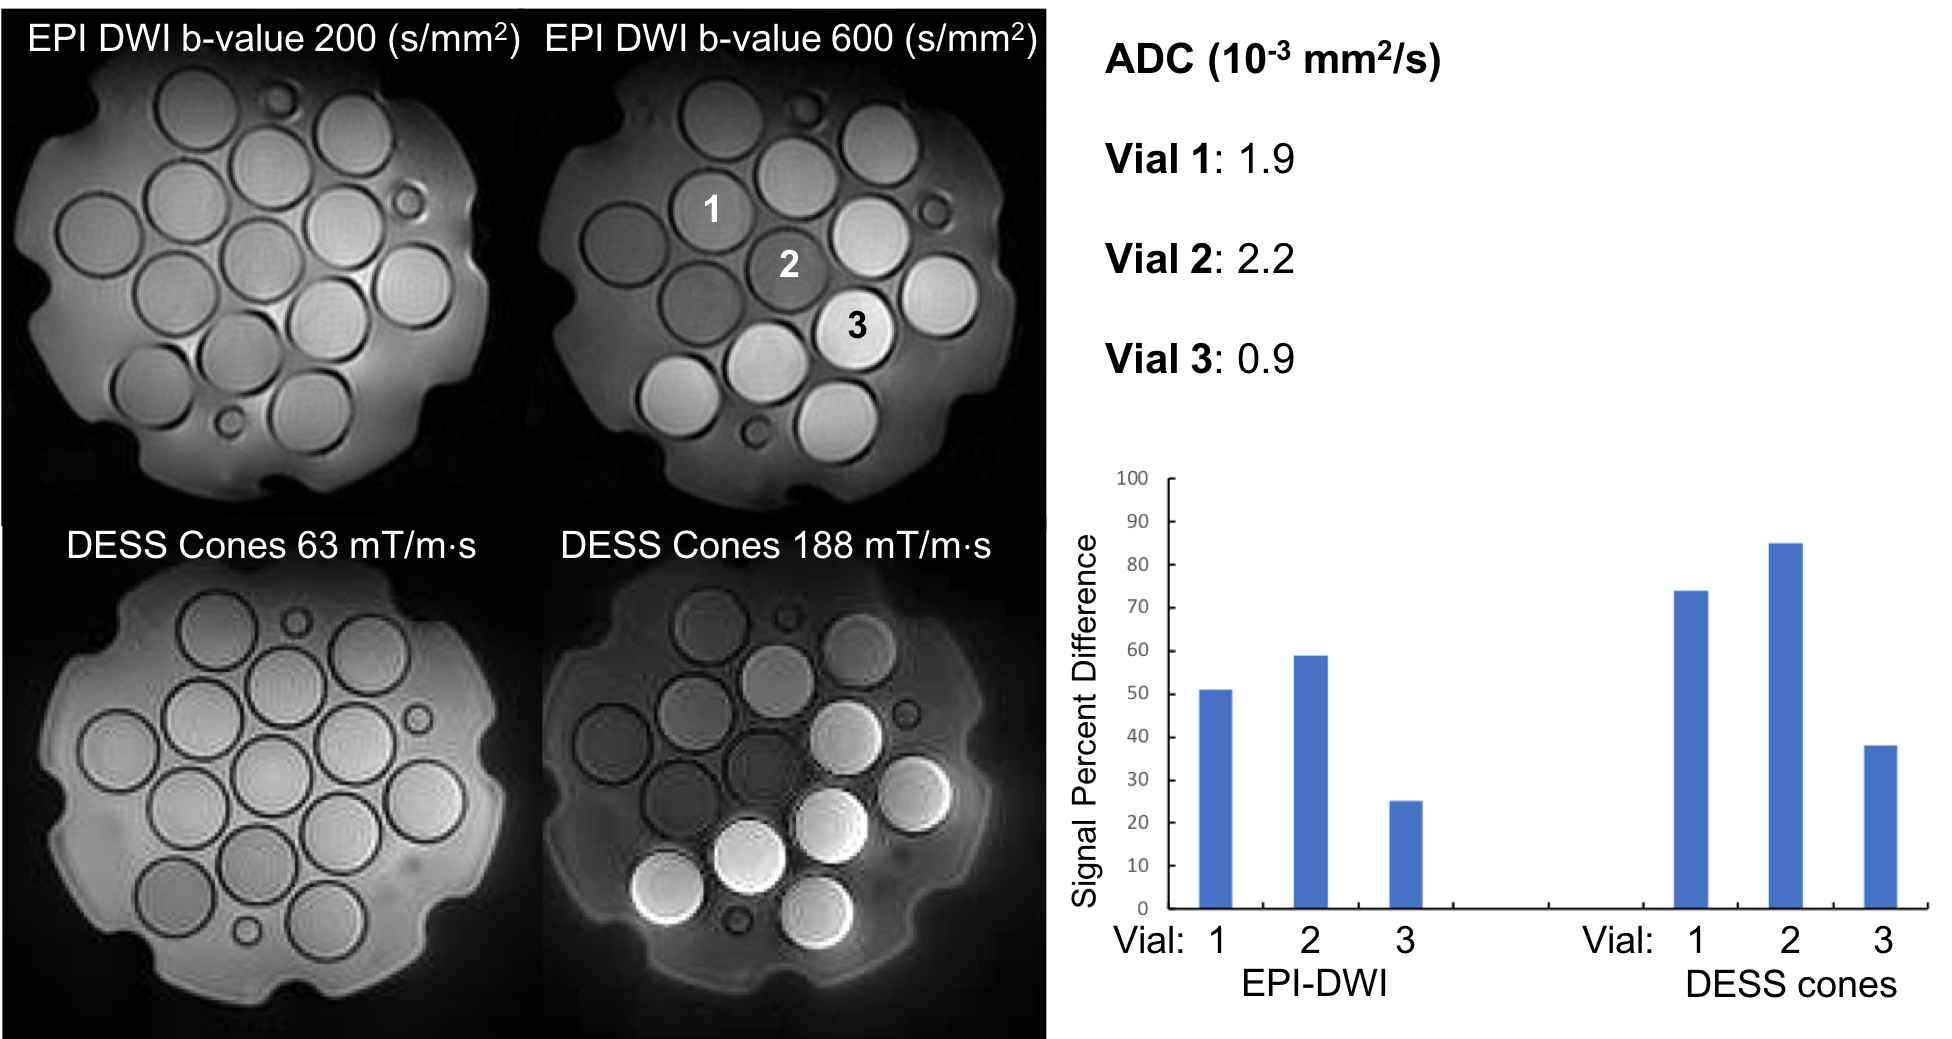
Phantom experiments: Signal was measured in a diffusion phantom (model 128, High Precision Devices) at different diffusion gradient areas with DESS cones in comparison to different b-values with EPI-DWI. The acquisitions were performed with a 8-channel head coil (GE Healthcare, Waukesha, WI) at 3T, (MR 750 GE Healthcare, Waukesha, WI) with the following imaging parameters: EPI-DWI: single shot, 128 x 128, 3 mm slices, 20 cm FOV, b-values 200 s/mm2, 600 s/mm2, TR 4000 ms; DESS-Cones: 256 x 256, 3 mm slices, 36 cm FOV, diffusion gradient areas 63 mT/m×s, 188 mT/m×s, FA 15, TR 10 ms. Percent signal difference between high and low diffusion-weighting was calculated in three vials representing a range of Apparent Diffusion Coefficients (ADCs) and compared between the sequences.
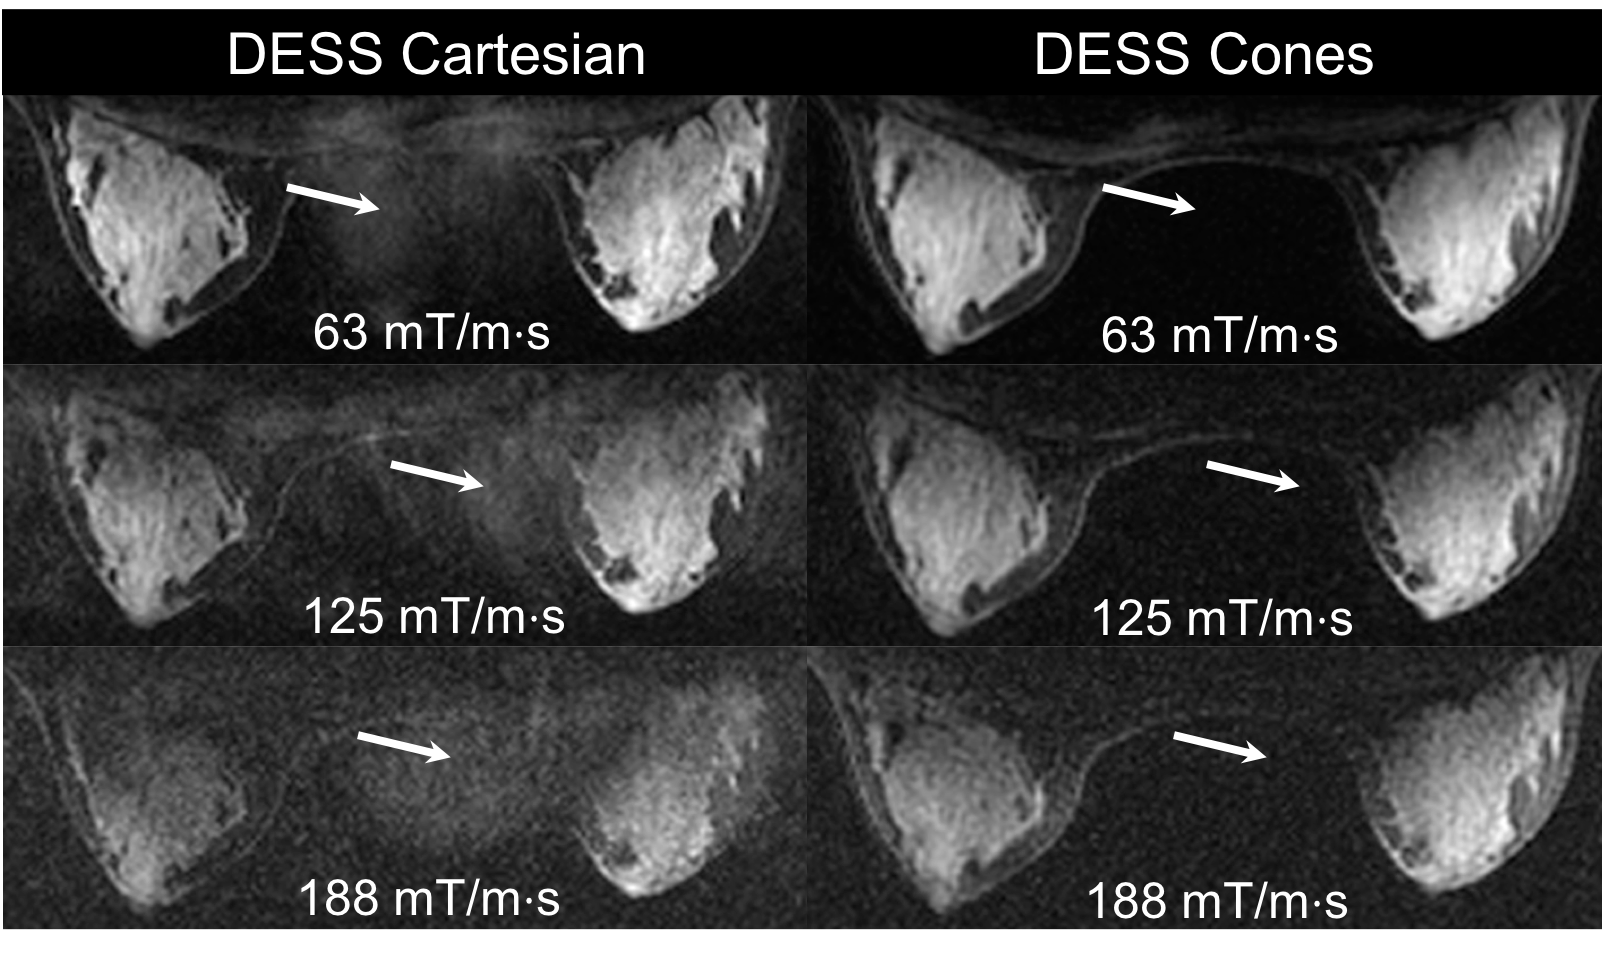
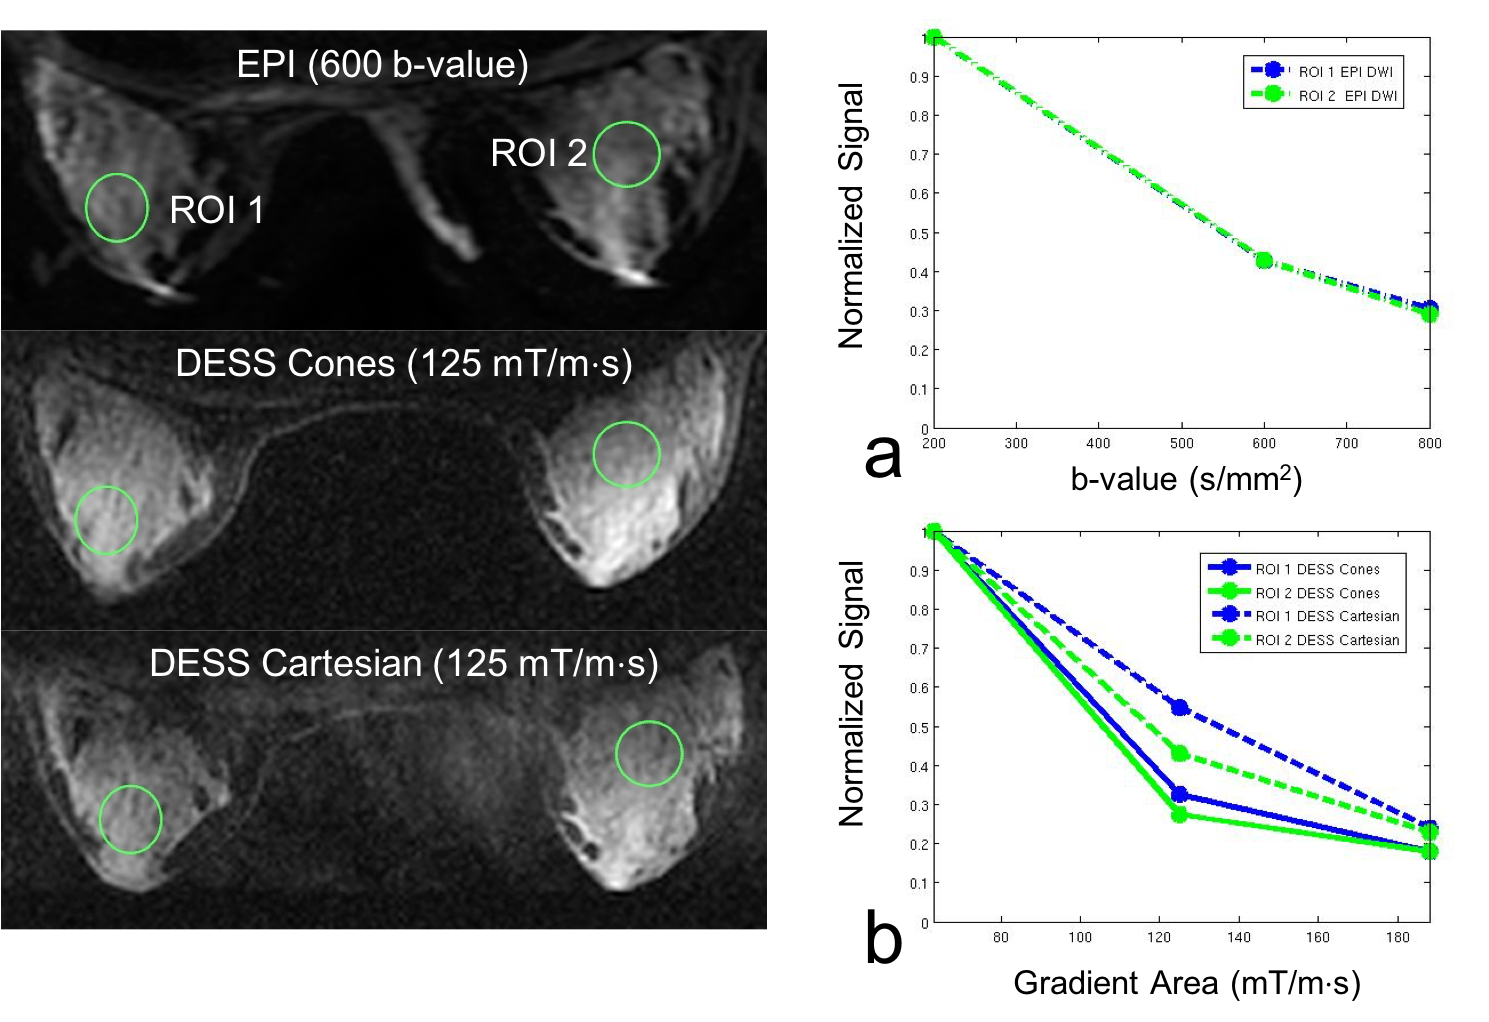
In vivo experiments: DESS-Cones, DESS Cartesian, and EPI-DWI acquisitions were performed in an asymptomatic breast volunteer with imaging parameters: DESS 256 x 256, 36 cm FOV, 64-3mm slices, FA 15, diffusion gradient areas 63 mT/m×s, 125 mT/m×s, 188 mT/m×s, EPI-DWI 256 x 128, 36 cm FOV, 42 5 mm slices, b-values 200 s/mm2, 600 s/mm2, 800 s/mm2. Image quality and level of motion artifact were visually assessed between DESS-Cones and DESS-Cartesian acquisitions. Signal level in two ROIs of fibroglandular tissue were measured in both the DESS and EPI-DWI acquisitions. The signal differences in the fibroglandular tissue with increased diffusion-weighting were compared between the sequences and with the simulation predictions.
Results and Discussion
Simulations predicted a diffusion gradient area of 200 mT/m×s with DESS would induce the same degree of contrast (~ 30% signal difference), between a malignant lesion and fibroglandular tissue as a b-value 600 (Figure 2). In the phantom, the relative percent signal difference for different ADCs was similar between EPI-DWI and DESS-Cones. However, the percent signal difference was higher for all three vials with DESS-cones (Figure 3). In vivo, motion artifacts that are evident in the Cartesian DESS acquisitions at all levels of diffusion-weighting and are not present in any of the corresponding DESS-cones images (Figure 4). The most strongly diffusion-weighted images demonstrate low SNR which may improve with further protocol optimization. The signal levels with varying b-values in the EPI-DWI acquisition (Figure 5) reflect those predicted in the simulations. Though the consistency of the signal is better between the ROIs with DESS-cones possibly owing to the elimination of ghosting artifacts both DESS acquisitions indicate lower signal levels than are predicted by the simulations.Conclusion
DESS-Cones shows potential for reducing ghosting due to motion for a range of diffusion gradient areas, including those necessary to achieve clinically appropriate diffusion contrast in the breast however, excess signal loss in comparison to EPI-DWI must be further characterized.Acknowledgements
We acknowledge support from GE Healthcare, P41 EB015891 and R01 EB009055References
1. McNab et al., NMR Biomed. 2010; 23: 781-793.
2. Bieri,et al., Magnetic Resonance in Medicine 2012; 68(3): 720-9.
3. Granlund, et al., Magnetic Resonance Imaging 2014; 32: 330-341.
4. Gurney, et al., Magnetic Resonance in Medicine 2006; 55: 575-582.
5. Uecker, et al., Berkeley Advanced Reconstruction Toolbox, ISMRM 2015, Toronto, Canada.
Figures