0767
High-Resolution Diffusion MRI: In-Vivo Demonstration of the SNR Benefit of Single-Shot Spiral Acquisition vs. EPI1Institute for Biomedical Engineering, ETH Zürich, Zürich, Switzerland, 2Laboratory for Social and Neural Systems Research, University of Zürich, Zürich, Switzerland
Synopsis
Spiral acquisition for diffusion-weighted imaging (DWI) has become possible with recent development of dynamic field monitoring and image reconstruction. In this work, we demonstrate high-quality in-vivo spiral DWI at high in-plane resolution (1mm) with minimal artifacts. In addition, we confirm the expected signal-to-noise ratio (SNR) gain of spiral- compared to echo-planar-imaging (EPI) readouts both theoretically and experimentally at varied resolutions and acceleration factors. An SNR gain up to 91% was measured in white matter. In conclusion, spiral acquisition provides improved SNR especially at high image resolutions.
PURPOSE
Diffusion-weighted imaging (DWI) suffers from an inherently low signal-to-noise ratio (SNR) especially at high b-values and high resolutions. Because center-out spiral readouts provide shorter echo times (TEs) than echo-planar-imaging (EPI), they are expected to improve SNR. Despite this promise, vulnerability to Bo off-resonance and eddy currents from strong diffusion-encoding gradients hindered spiral sampling in DWI. With recent development of dynamic field monitoring and improved image reconstruction, spiral acquisition for DWI has become possible1. Moreover, advances in RF coil design allow for an increase in effective pixel bandwidth by using high parallel imaging acceleration (R), thus reducing off-resonance artifacts. In this work, we demonstrate in-vivo spiral DWI at high in-plane resolution (1mm). In addition, we predict and measure the SNR gain of single-shot spiral DWI and compared that to conventional EPI at varied resolutions and R.METHODS
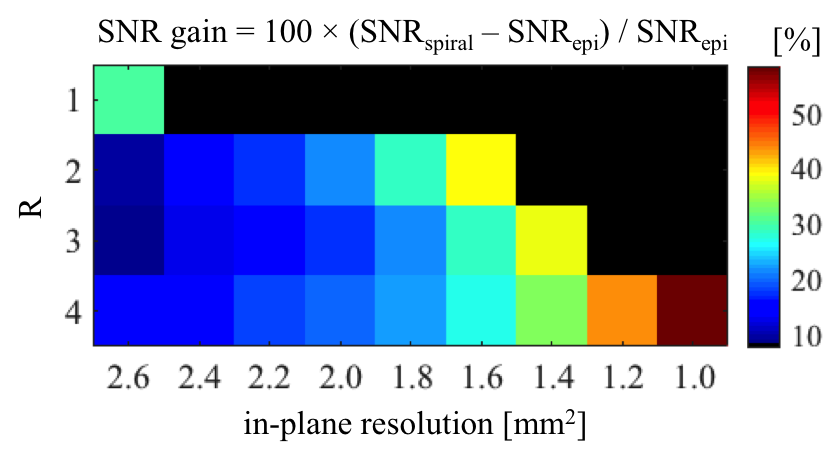
Expected SNR gain of spiral DWI compared to EPI: For a given object and b-value, the SNR in DWI is influenced by multiple sequence parameters, most importantly TE and the acquisition duration (TAQ). Both vary with the chosen image resolution and R. For R>1 the coil-dependent g-factor (g) also needs to be considered. The predicted SNR $$SNR=A\cdot e^{-TE/T_{2}}\cdot\sqrt{T_{AQ}}/g$$ was calculated for typical clinical brain DWI sequences (FOV=21cm, b=1000s/mm2, Gmax=80mT/m, slew-ratemax=100mT/m/ms, white matter T2=75ms2) for a range of resolutions and R. The constant A represents all other parameters that affect SNR, which will be canceled out in the calculation of SNR gain of spiral (see the equation in Figure1). g-factors obtained for the employed 16ch head coil array were employed.
Image Acquisition and Reconstruction: One male volunteer was scanned under local ethics approval with a 3T Philips Achieva scanner and a 16ch receive-only head coil array with 16 integrated field probes1 (Skope MR Technologies, Zurich Switzerland). Gradient-echo images (ΔTE=2.3ms) were acquired for the estimation of static Bo map and receive sensitivities. Spiral and EPI diffusion data with two b0 images (b=0s/mm2) and six DWIs (b=1000s/mm2) were acquired with R4/1.0mm2, R3/1.4mm2, and R2/1.9mm2 (slice thickness=2mm). For EPI full k-space was measured because zero-filling the missing k-space in partial Fourier leads to resolution loss. Zero-padding rather than Margosian reconstruction is necessary to avoid pulsation artifact in non-gated single-shot DWI3. Noise measurements were performed by repeating the sequences without RF transmission. For all sequences, the higher-order k-space evolutions were recorded concurrently. The k-space coefficients were employed in the image reconstruction along with the Bo and sensitivity maps1.
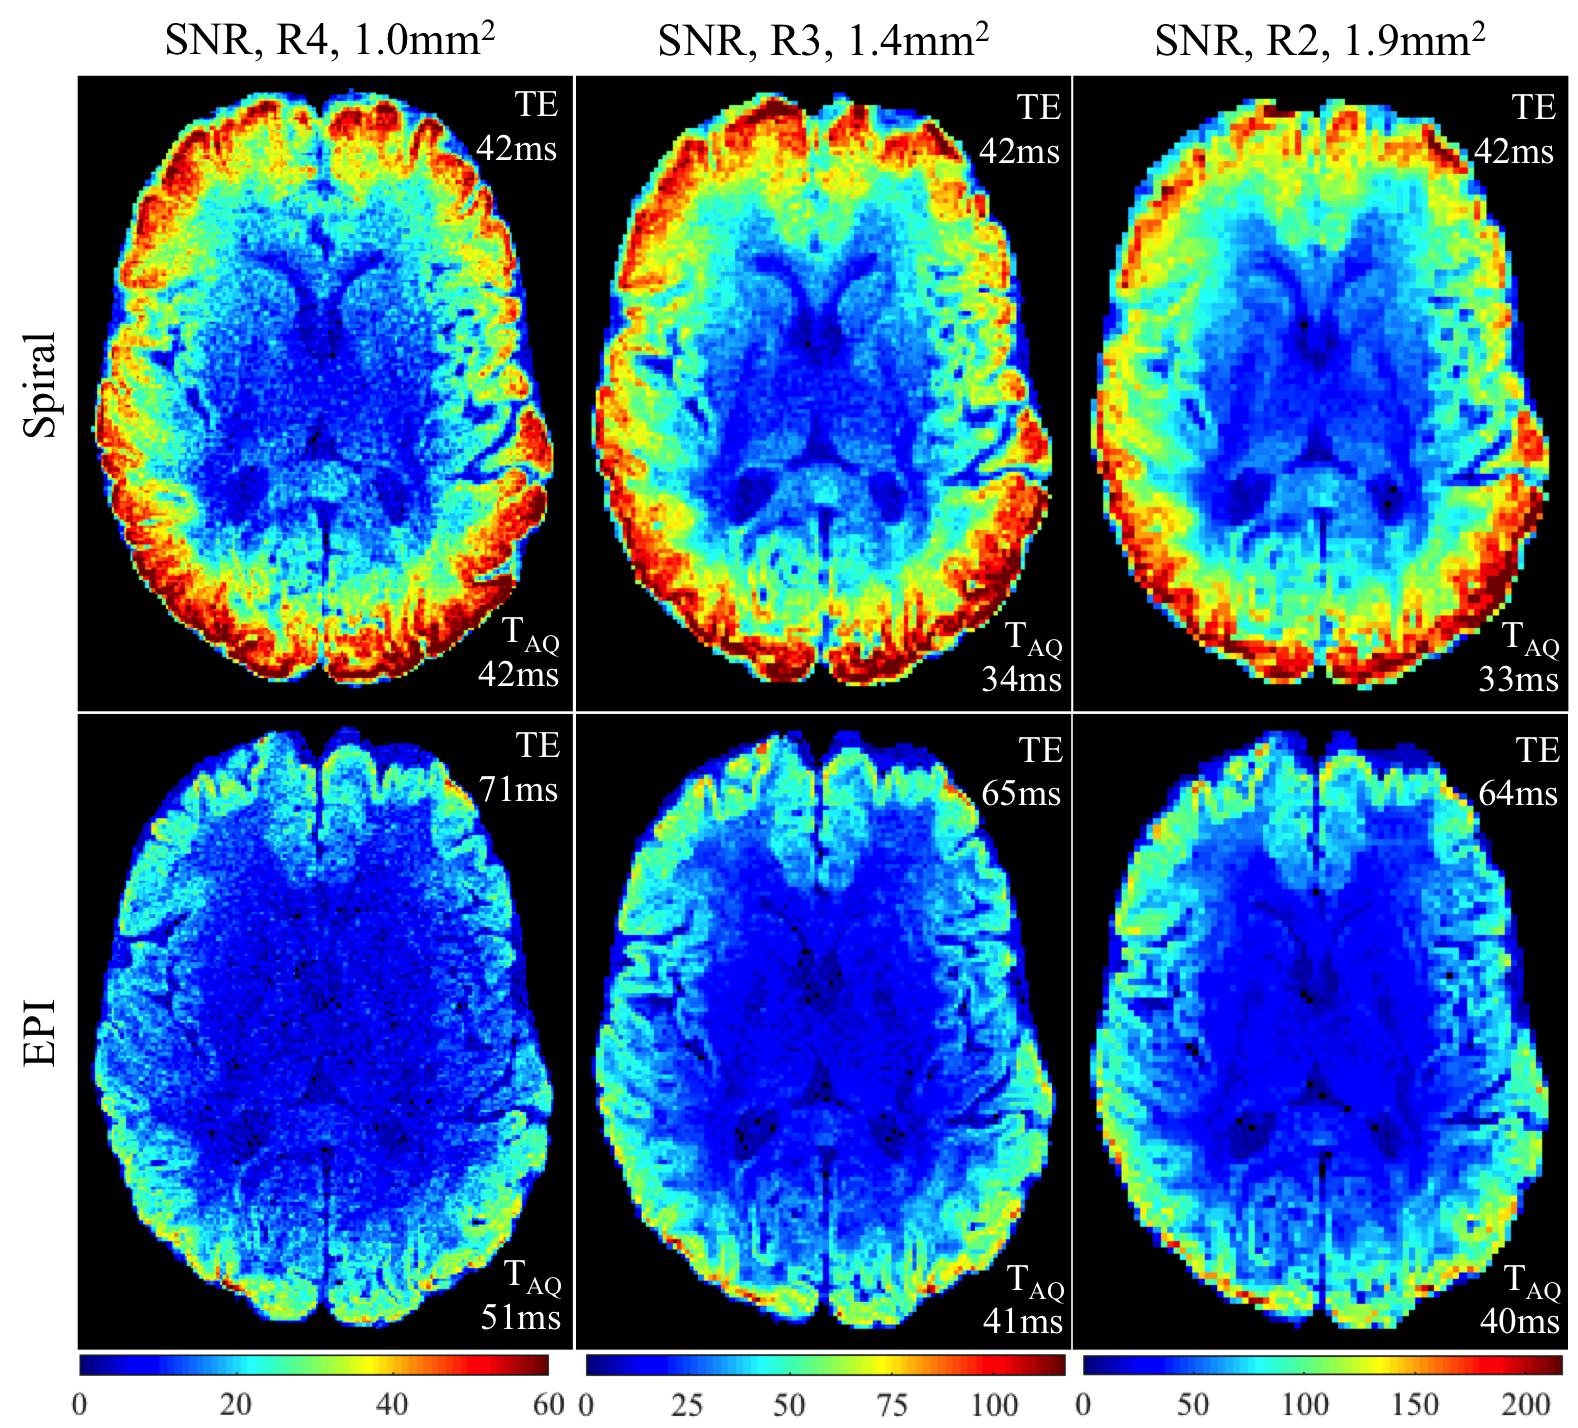
Image processing: For the estimation of SNR, Monte-Carlo based pseudo multiple replica method4 was used. That is, the synthetic noise having the same noise covariance matrix measured from the noise scan was added to the k-space of b0 image and the reconstruction was performed to obtain the noise-added image. After the 200 repetitions, the voxel-wise noise map was estimated from the standard deviation of the 200 replicas. The SNR map was calculated by dividing the DWIs without additional noise by the above noise map.
RESULTS
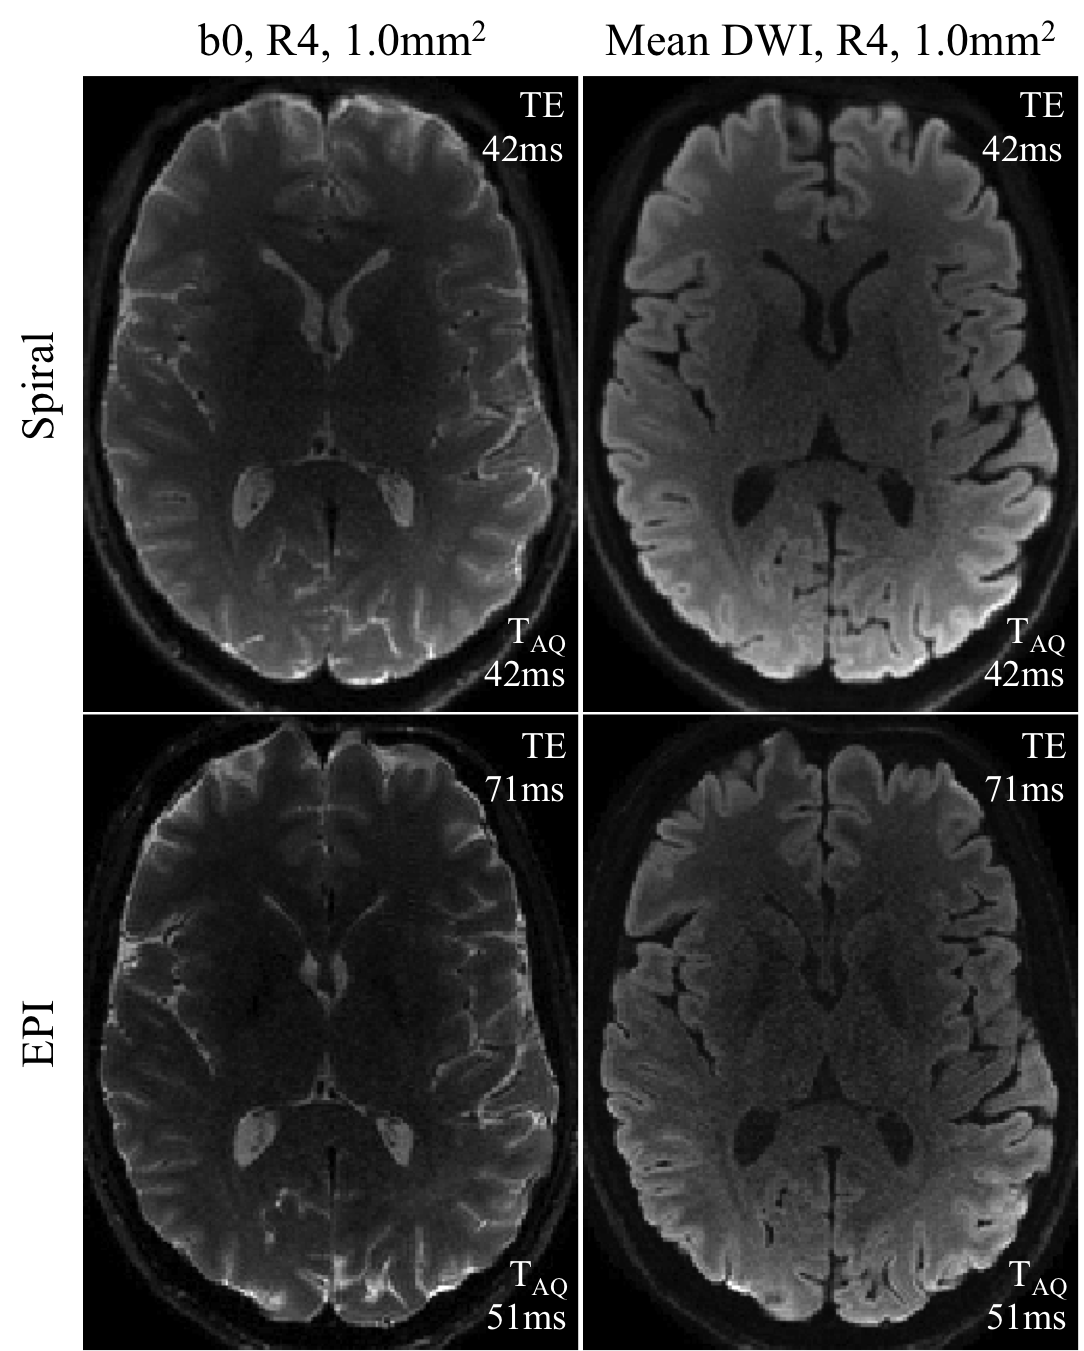
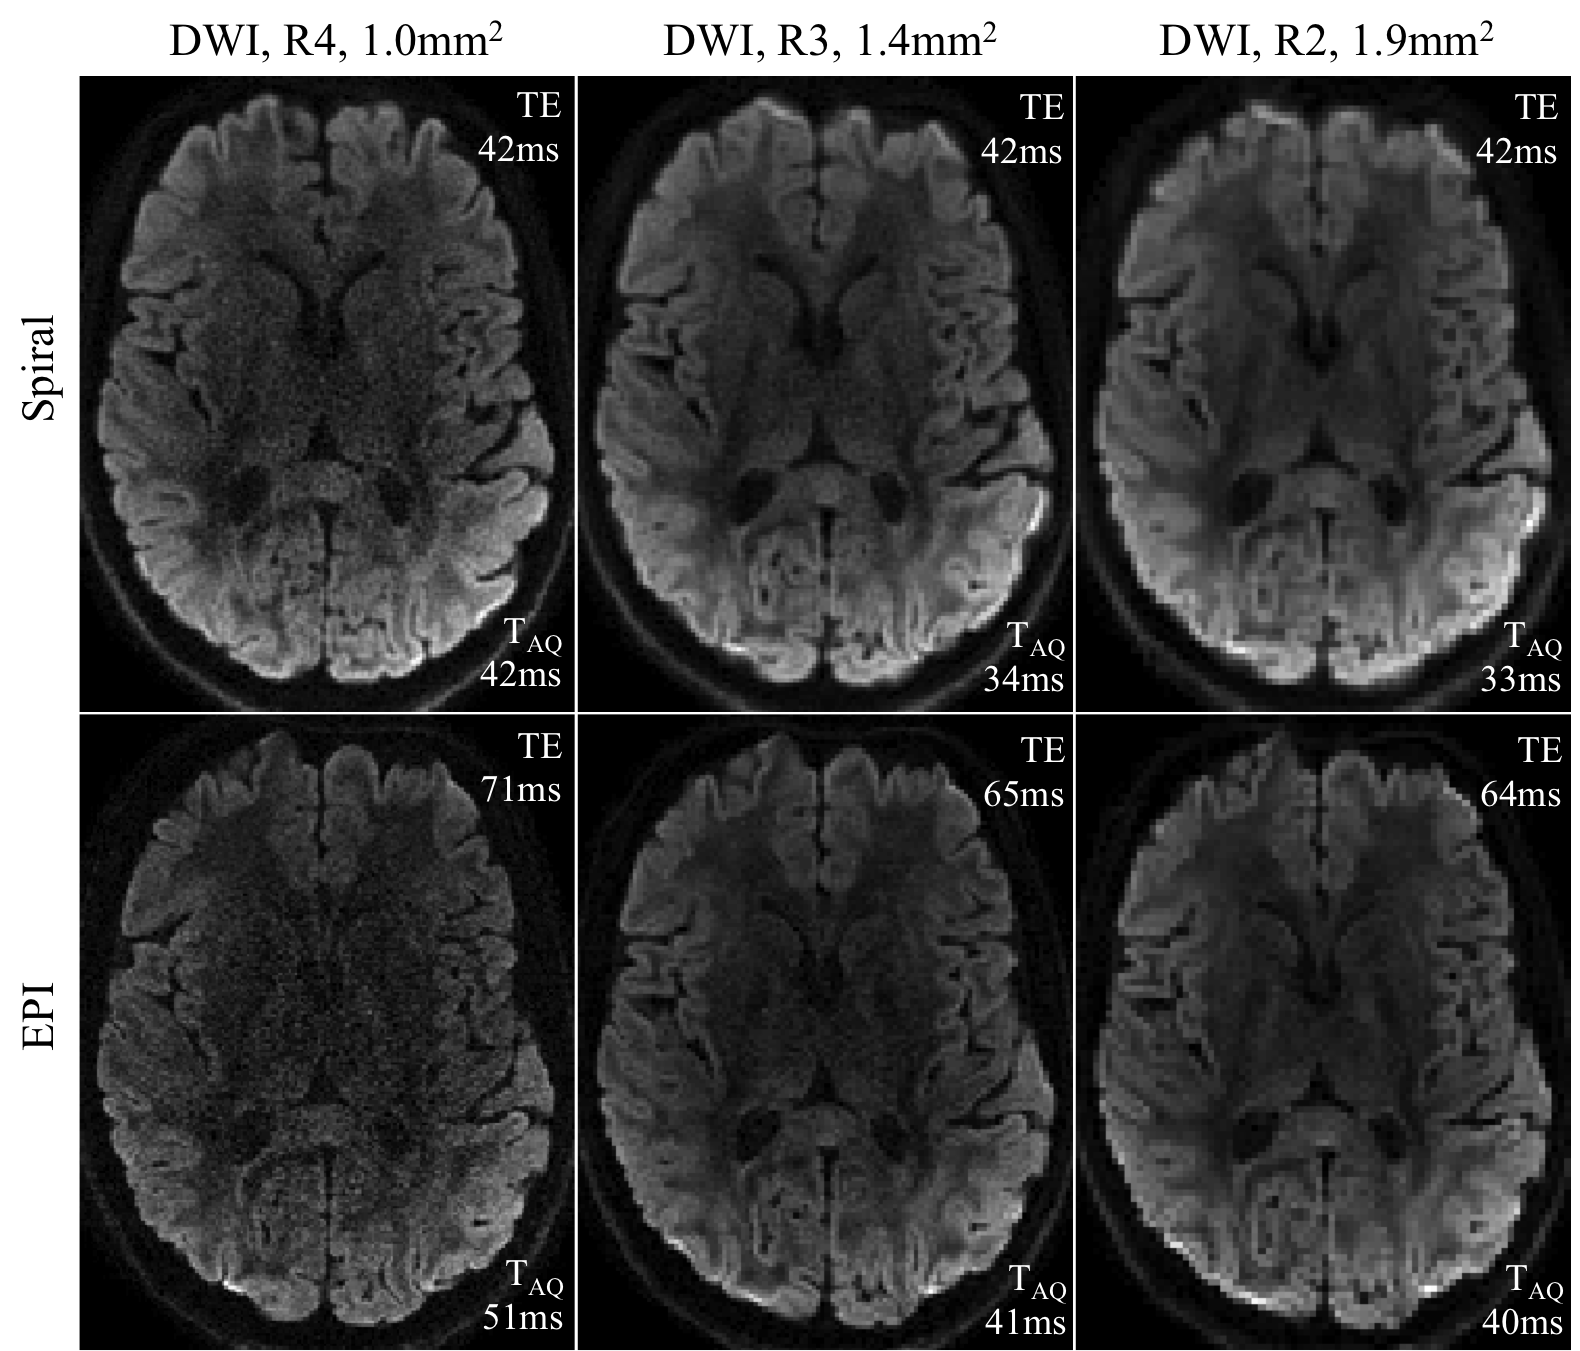
The evaluation of the expected SNR gain showed an increasing SNR gain for higher resolutions and R (Figure1). The theoretical SNR gain reached ~60% for R4/1.0mm2. Figure2 demonstrates the image quality of the b0 image and averaged DWIs over six diffusion directions for R4/1mm2. Figure3 shows three different resolution/R images. At high resolution EPI DWIs suffer particularly from low SNR. The SNR maps are shown in Figure4. Spiral b0 images manifested higher SNR than EPIs. Note that for spiral readouts TE stays the same (42ms) whereas it depends on resolution and R for EPI. In white matter, the SNR gain was 91/75/73% for R4/1mm2, R3/1.4mm2, and R2/1.9mm2, respectively. Although the SNR maps exhibited high spatial variations that are attributed mainly to the receive coil sensitivity and g-factor maps, the SNR gain was relatively homogenous throughout the brain (data not shown).DISCUSSION and CONCLUSION
We presented single-shot spiral DWIs with an in-plane resolution of 1mm2 for the first time. High-quality DWI was demonstrated with minimal residual artifacts and significant SNR gain compared to EPI DWI. The expected SNR gain of spiral- compared to EPI readouts was confirmed both theoretically and experimentally. The measured in-vivo SNR gain was higher than predicted, which may be attributed to local variations of g-factors and T2 values as well as differences between spiral and EPI in time allocation of k-space traverse. In conclusion, we demonstrated that the recent advances in field monitoring and parallel imaging enable spiral acquisition and provides improved SNR especially at higher resolutions. The improved SNR and increased resolution are crucial for clinical DWI and neuroscience research.Acknowledgements
This work was supported by Swiss National Science Foundation (grant# 31003A_166118 and 316030_164076) and CTI (project# 18845.1PFLS-LS).References
1. Wilm, B. J., Barmet, C., Gross S., Kasper L., et al. Single-Shot Spiral Imaging Enabled by an Expanded Encoding Model: Demonstration in Diffusion MRI. Magn Reson Med 77, 83-91 (2017).
2. Bojorquez, J. Z., Bricq, S., Acquitter, C., Brunotte, F., et al. What are normal relaxation times of tissue at 3 T? Magn Reson Imaging 35, 69-80 (2017).
3. Robson, M. D. and Porter D. A. Reconstruction as a source of artifact in nongated single-shot diffusion-weighted EPI. Magn Reson Imaging 23, 899-905 (2005).
4. Robson, P. M., Grant, K. A., Madhuranthakam, J. A., Lattanzi, R., et al. Comprehensive Quantification of Signal-to-Noise Ratio and g-Factor for Image-Based and k-Space-Based Parallel Imaging Recostructions. Magn Reson Med 60, 895-907 (2008).
Figures