0766
Diffusion MRI with b=1000 s/mm2 at TE < 22 ms using single-shot spiral readout and ultra-strong gradients: Implications for microstructure imaging1CUBRIC, School of Psychology, Cardiff University, Cardiff, United Kingdom
Synopsis
The development of 300 mT/m gradients has opened new opportunities for exploring much shorter echo times (TE) in human diffusion imaging. Here, to further shorten TE, we developed a robust pulse-gradient spin-echo sequence with single-shot spiral readout on this hardware. The ultra-strong gradients induced vibrations, which were addressed by hardware modifications, while challenges posed by B0-inhomogeneity, eddy currents (captured using a field camera) and gradient-nonlinearity were addressed using iterative reconstructions. With this combination, for a b-value of 1000 s/mm2, we achieved TE = 21.7 ms. In this previously unchartered domain, we demonstrated enhanced sensitivity to myelin in spin-echo diffusion MRI.
Introduction
Myelin plays a critical role in the nervous system and has important bearing on plasticity and evolution of neurodegenerative diseases. Thus, it is of immense interest to the microstructural imaging community1,2. Magnetization-prepared diffusion imaging of myelin water has been reported previously3,4. However, unprepared diffusion MRI in humans typically has little sensitivity to myelin due to the long TEs required (typically above 60 ms) and the relatively short T2 of myelin (≈ 30 ms5). Although spiral readouts are known to reduce TE significantly, they have mostly been viewed as an SNR boosting strategy in diffusion MRI6-9.
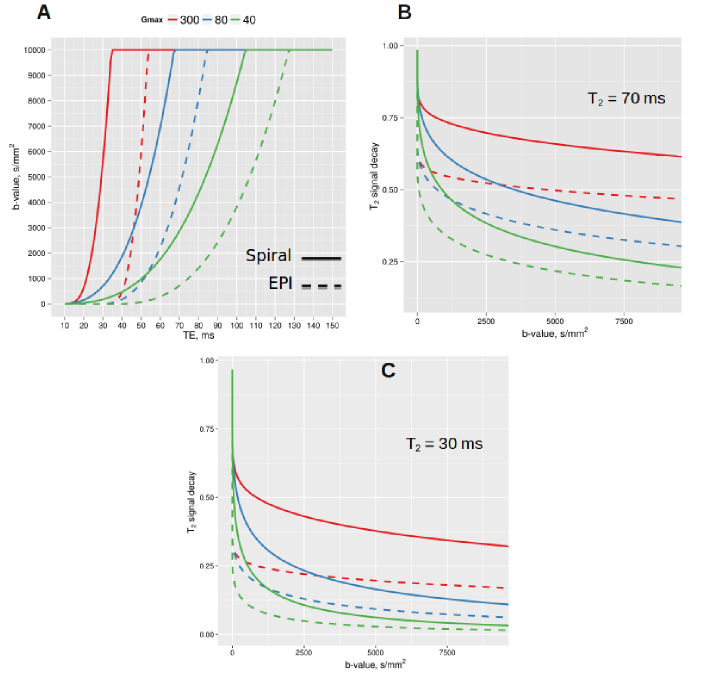
Diffusion-weighted spiral imaging (DWEISI) using 300 mT/m gradients can drastically shorten TE and is predicted to provide nearly three times more sensitivity to myelin compared to diffusion-weighted EPI using 80 mT/m gradients (Fig. 1C). This may enable direct sensitivity to myelin in diffusion scans and open new vistas in microstructure imaging10. However, there are three main challenges in implementing single-shot DWEISI with 300 mT/m gradients: A) Vibrations become pronounced at 300 mT/m; B) DWEISI is extremely vulnerable to eddy current artifacts; C) Long readout duration with single-shot DWEISI results in blurring due to B0 inhomogeneity. We next outline how we overcame these challenges.
METHODS
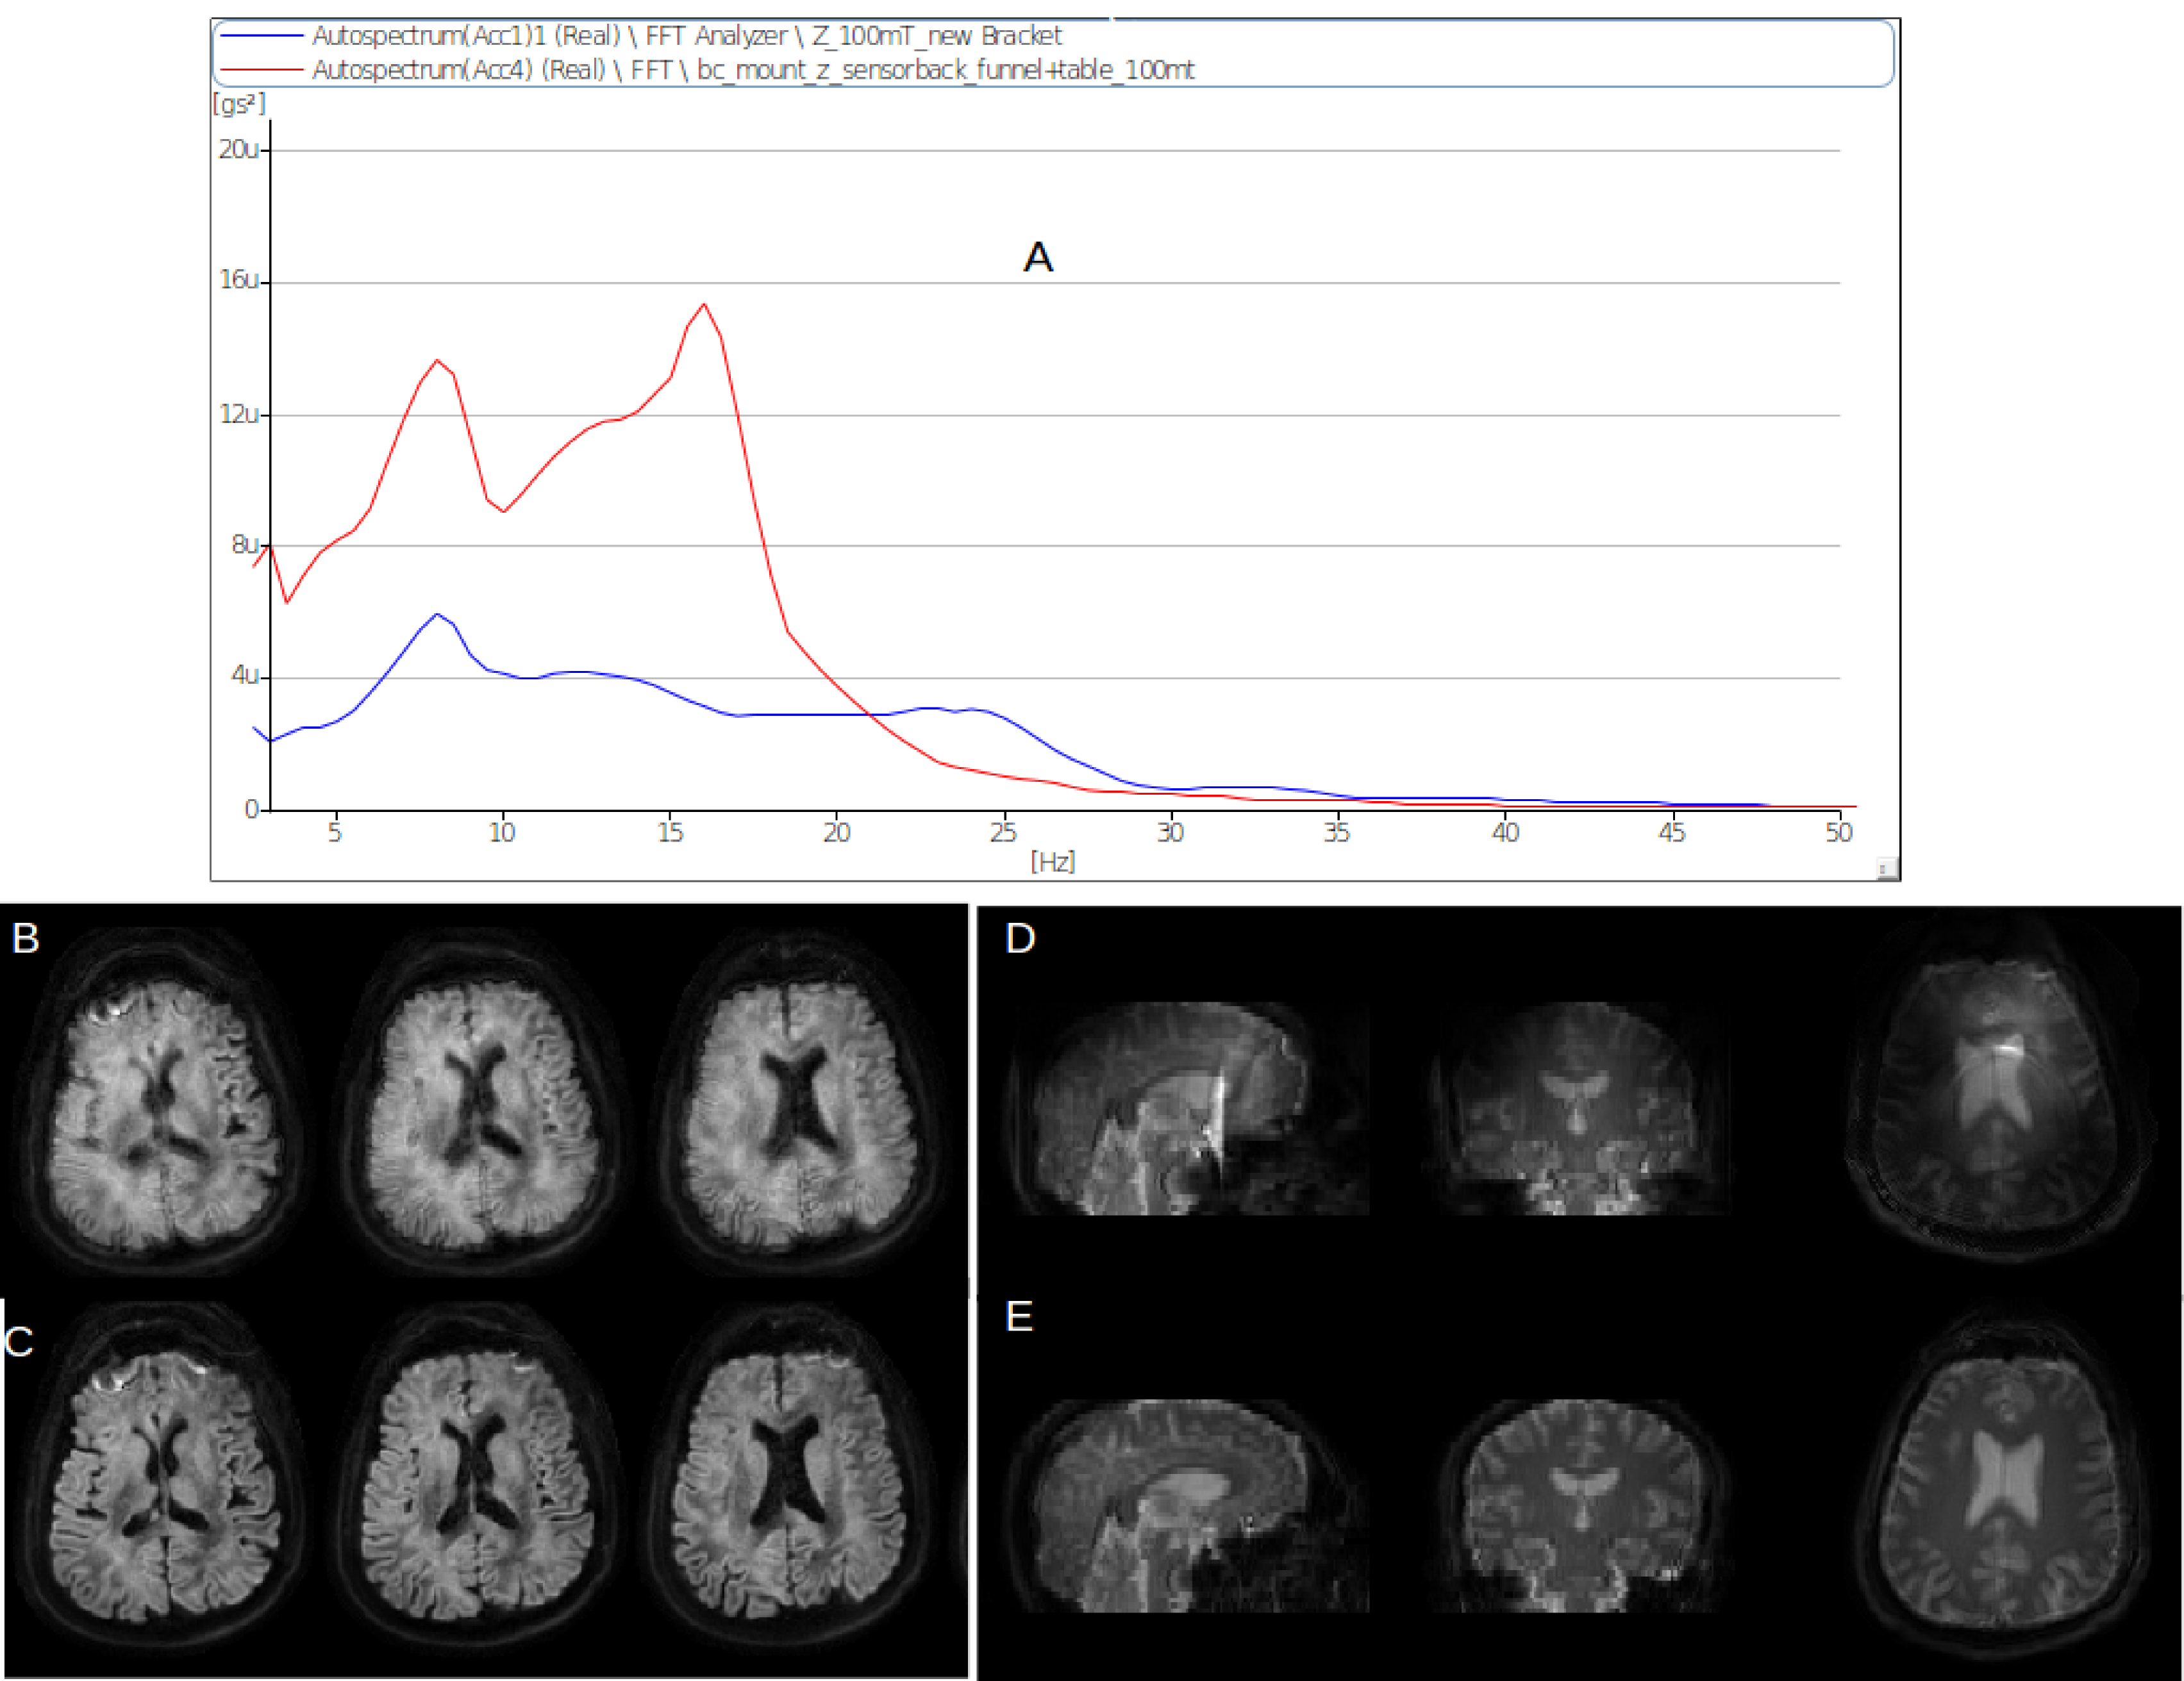
Vibration artifacts, particularly due to Z-gradient were ascertained by imaging and vibrometer measurements. A three-fold reduction in vibration was achieved by replacing the rear mounting of the body coil (see Fig. 2A). Successful DWEISI images could only be obtained after this hardware modification. Conjugate gradient-based SENSE reconstruction was implemented in MATLAB and included eddy current correction, measured with a field camera (Skope Inc.) and B0 inhomogeneity correction (obtained from a B0 mapping sequence). Additionally, since the 300 mT/m gradients have significant gradient nonlinearities11 that can lead to image distortion12 away from the iso-center, we incorporated gradient-nonlinearity correction into the reconstruction. This has distinct advantages over post-reconstruction image distortion correction13,14.
In this abstract we present results from specific DWEISI measurements done on the Siemens 3 T Connectom scanner using a 32-channel head coil to highlight aspects of data reconstruction and myelin sensitivity. All spiral acquisitions were performed at a rise time of 200 mT/m/ms using time-optimal trajectories15. Due to PNS and cardiac stimulation safety limits, diffusion-weighting gradients had a slew rate of 83 mT/m/ms. Details of individual experiments are described in the figure captions.
Results
Figs. 2B and C show the critical role played by the field camera in DWEISI. Not accounting for B0 eddy currents typically resulted in unusable images (Fig. 2B). Clean reconstructions could be obtained by incorporating the eddy current information into reconstructions (Fig. 2C). Similarly, Fig. 2D shows blurring and artifacts that would result from B0 inhomogeneity which can be corrected during reconstruction (Fig. 2E).
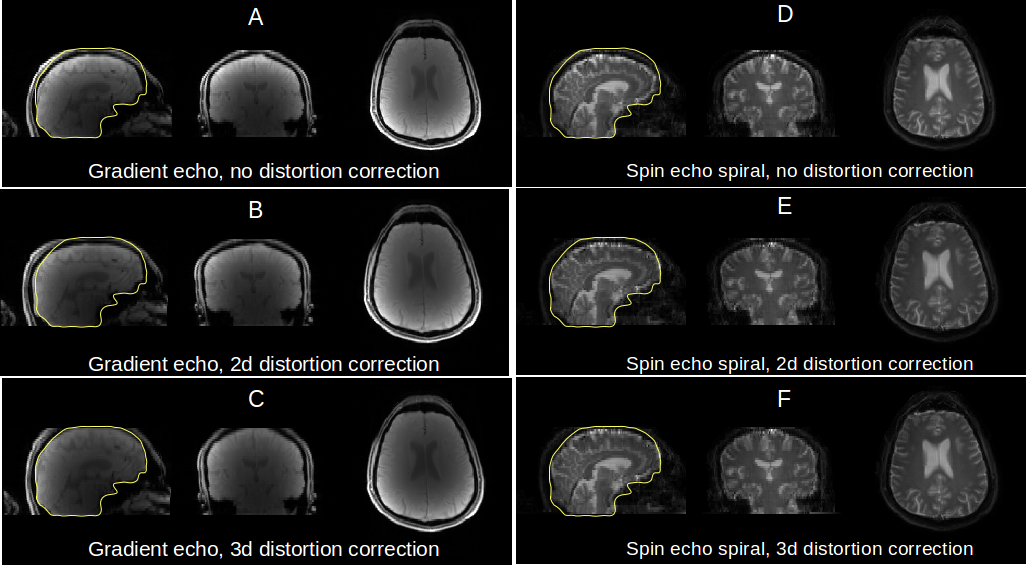
Fig. 3 demonstrates the advantage of including gradient nonlinearity into DWEISI reconstruction. The similarity in shape between post-reconstruction distortion corrected conventional gradient-echo images and gradient-nonlinearity-aware DWEISI reconstruction is shown with both 2d and 3d distortion correction.
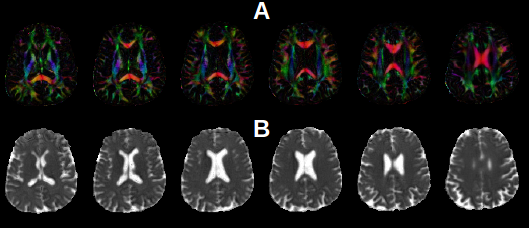
Fig. 4A, B show the colour FA and MD maps obtained with DWEISI in one of the volunteers at 1.5 mm isotropic in-plane resolution. While DWEISI was acquired with TE = 21.7 ms, similar resolution acquisition with EPI (with 2x acceleration) would require a TE of about 45 ms and would result in about 35% less SNR.
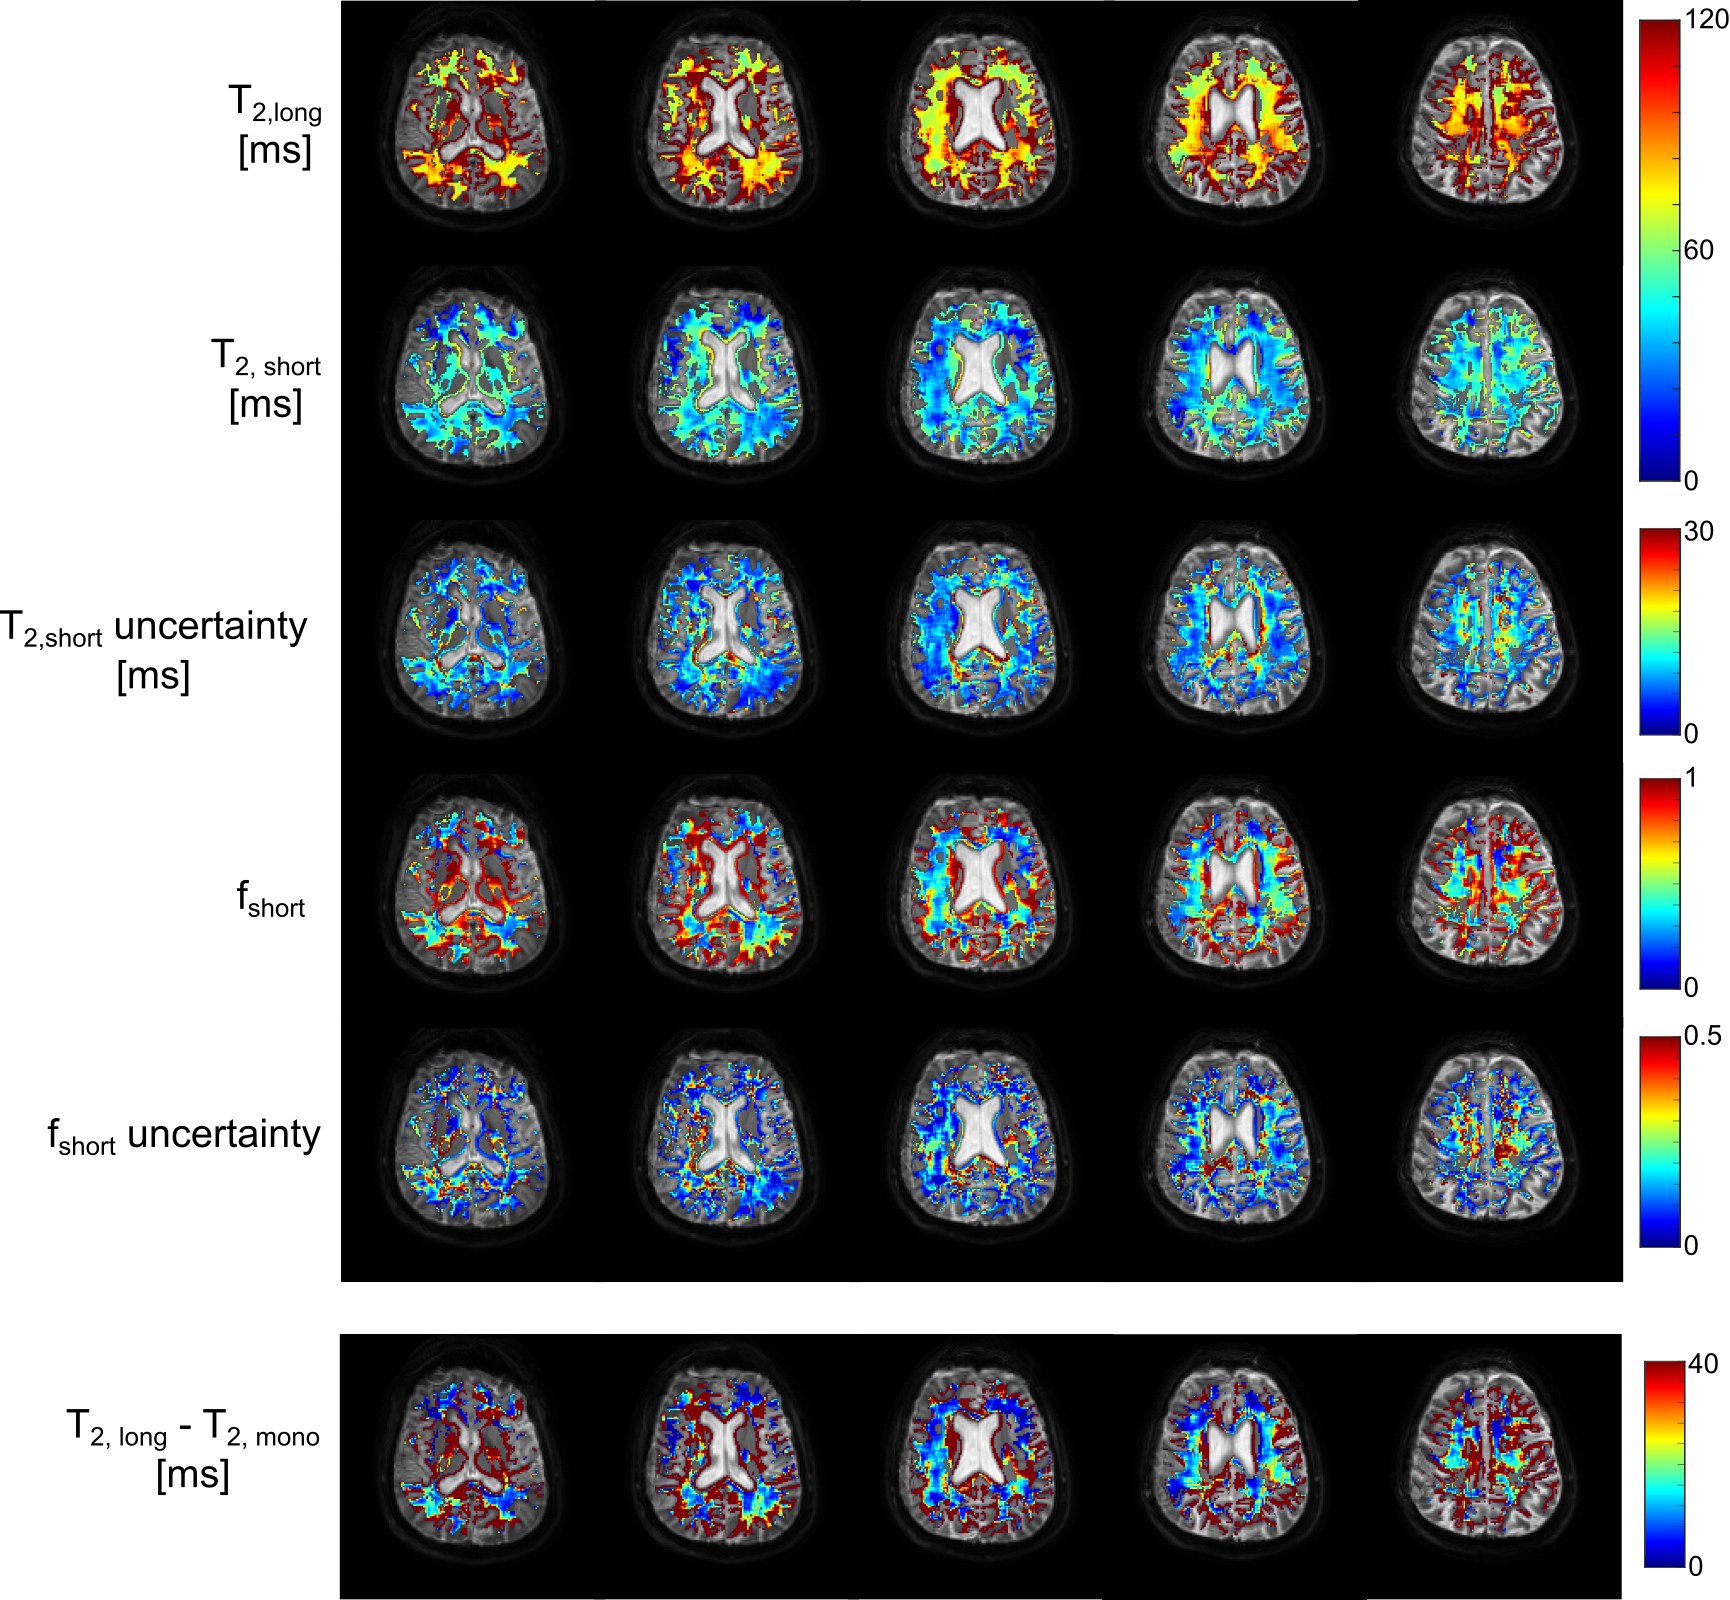
Fig. 5 illustrates the sensitivity of DWEISI to short T2 components, using 32 b=0 datasets with TE increasing from 25-180 ms in 5 ms steps. Voxel-wise fits were performed with Matlab using multistart global optimization with 25 random starts. The bi-exponential results are only shown where the Akaike Information Criterion warranted a bi-exponential fit over a mono-exponential. We also obtained 95% confidence intervals on the estimated parameters to verify that the components were well separated. Crucially, the same analysis with data from TE > 60 showed no such clear bi-exponential behaviour.
Discussion
Through hardware changes, use of field camera, and by developing a reconstruction engine which takes into account eddy currents, B0 inhomogeneity and gradient nonlinearity in a single framework, we have successfully implemented DWEISI on the 300 mT/m Connectom scanner. We have demonstrated DTI at a very short TE (21.7 ms). Data acquired at this TE, should be sensitive to myelin water which is hypothesized to be the short T2 component in the bi-exponential fits. This development opens up a new parameter space for human diffusion imaging which was hitherto inaccessible. Exploiting the enhanced sensitivity of DWEISI to myelin water can potentially make significant contributions to our understanding of the role played by myelin. In particular, multi-dimensional modeling of DWEISI data can help disentangle the contributions of different water compartments and provide new insights into disease mechanisms.Acknowledgements
Special thanks to Dr. Peter Dietz and Mr. Rainer Geer of Siemens Helthcare for vibration measurements and hardware changes that enabled this work.
This work was funded by a Wellcome Trust Investigator Award (096646/Z/11/Z), a Wellcome Trust Strategic Award (104943/Z/14/Z) and a Wellcome Trust New Investigator Award, and also by the ESPRC (grant EP/M029778/1).
References
1. Monje M. Myelin plasticity and nervous system function. Annual review of neuroscience, July 2018, 41:61-76.
2. MacKay AL and Laule C. Magnetic resonance of myelin water: An in vivo marker for myelin. Brainplasticity (Amsterdam, Netherlands), December 2016, 2:71-91.
3. Andrews TJ, Osborne MT, and Does MD. Diffusion of myelin water. Magnetic resonance in medicine, August 2006, 56:381-385.
4. Avram AV, Guidon A, and Song AW. Myelin water weighted diffusion tensor imaging. NeuroImage, October 2010, 53:132-138.
5. MacKay A, Whittall K, Adler J, Li D, Paty D, and Graeb D. In vivo visualization of myelin water in brain by magnetic resonance. Magnetic resonance in medicine, June 1994, 31:673-677.
6. Li TQ, Kim DH, and Moseley ME. High-resolution diffusion-weighted imaging with interleaved variable-density spiral acquisitions. Journal of magnetic resonance imaging : JMRI, April 2005, 21:468-475.
7. Truong TK and Guidon A. High-resolution multishot spiral diffusion tensor imaging with inherent correction of motion-induced phase errors. Magnetic resonance in medicine, February 2014, 71:790-796.
8. Holtrop JL and Sutton BP. High spatial resolution diffusion weighted imaging on clinical 3 T MRI scanners using multislab spiral acquisitions. Journal of medical imaging (Bellingham, Wash.), April 2016, 3:023501.
9. Wilm BJ, Barmet C, Gross S, Kasper L, Vannesjo SJ, Haeberlin M, Dietrich BE, Brunner DO,Schmid T, and Pruessmann KP. Single-shot spiral imaging enabled by an expanded encoding model: Demonstration in diffusion MRI. Magnetic resonance in medicine, January 2017, 77:83-91.
10. Lin M, He H, Tong Q, Ding Q, Yan X, Feiweier T, and Zhong J. Effect of myelin water exchange on DTI-derived parameters in diffusion MRI: Elucidation of TE dependence. Magnetic resonance in medicine, March 2018, 79:1650-1660.
11. Sotiropoulos SN, Jbabdi S, Xu J, Andersson JL, Moeller S, Auerbach EJ, Glasser MF, HernandezM, Sapiro G, Jenkinson M, Feinberg DA, Yacoub E, Lenglet C, Essen DCV, Ugurbil K, and BehrensTE. Advances in diffusion MRI acquisition and processing in the Human Connectome Project.NeuroImage, 2013, 80(Supplement C):125-143. Mapping the Connectome.
12. Jovicich J, Czanner S, Greve D, Haley E, van der Kouwe A, Gollub R, Kennedy D, Schmitt F,Brown G, MacFall J, Fischl B, and Dale A. Reliability in multi-site structural MRI studies: Effects of gradient non-linearity correction on phantom and human data. NeuroImage, 2006, 30(2):436-443.
13. Glasser MF, Sotiropoulos SN, Wilson JA, Coalson TS, Fischl B, Andersson JL, Xu J, Jbabdi S,Webster M, Polimeni JR, Essen DCV, and Jenkinson M. The minimal preprocessing pipelines for the Human Connectome Project. NeuroImage, 2013, 80(Supplement C):105-124. Mapping theConnectome.
14. Rudrapatna U, Parker G, Roberts J, and Jones D. Can we correct for interactions between subject motion and gradient-nonlinearity in diffusion MRI? In Proceedings of the ISMRM, 2018, page 1206.
15. Lustig M, Kim SJ, and Pauly JM. A fast method for designing time-optimal gradient waveforms for arbitrary k-space trajectories. IEEE transactions on medical imaging, June 2008, 27:866-873
Figures