0749
Brain state and CSF production define glymphatic washout in the rat brain1Translational Research Imaging Center (TRIC), University Hospital Muenster, Muenster, Germany
Synopsis
The Glymphatic System, which is essential for brain-wide waste clearance, is enhanced during sleep. Here, we investigate the effect of brain state and CSF formation using constrast enhanced MRI in a rat model. Our data support the hypothesis that sleep enhances glymphatic clearance due to better CSF intrusion into the brain parenchyma caused by higher CSF formation and smaller arteries. Higher diffusion in cortex associated with altered brain state during sleep influence CSF distribution within parenchyma.
Introduction
The Glymphatic System has been identified1 as a brain-wide paravascular pathway controlling the flux of CSF in the brain to elute soluble proteins and waste. This process can be observed by MRI2 through distribution of contrast agent. An actual controversy concerns the exact mechanism of CSF flux. Either CSF travels by bulk flow through the parenchyma3,4, or CSF distributes rapidly along the arteries5 and the exchange with the interstitium is governed by diffusion. It was previously described that clearance is intensified during sleep or anesthesia6. A number of factors may have impact on glymphatic activity, such as depth and type of anesthesia, brain state, CSF formation7, or size of arteries. To mimic different conditions related to the physiological parameters, we used different anesthetics in a rat model and acquired T2w images, apparent diffusion coefficient (ADC) maps and time of flight (TOF) angiograms.Methods
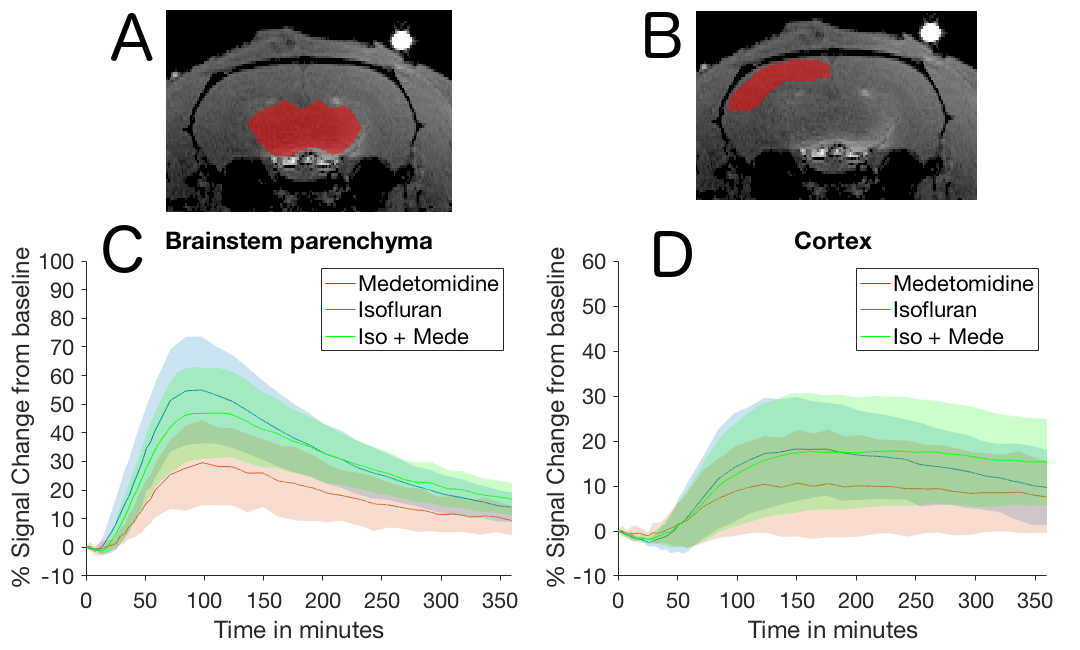
MRI at 9.4T was performed under three different anesthetic protocols: Isoflurane (ISO) to mimic a sleep-like brain state (n=8); Medetomidine (MEDE) to mimic an awake-like brain state (n=7), ISO+MEDE to mimic sleep with increased CSF production (n = 8)). A modified standard venous catheter (26G) was implanted into the cisterna magna under ISO. Subsequently, anesthesia was switched to one of the anesthetic protocols and contrast agent (Gadovist 21 mM) was administered via the catheter (50 min continuous infusion at 1.6 µl/min). At least 40 T1-weighted 3D-FLASH scans (TR/TE:15/3.8 ms, FA 15°) were acquired during 6 hours. ROI analysis was performed in brainstem and cortex (Fig. 1) and decay rates were calculated. To control the effect of respiratory depression on glymphatic clearance and diffusion, additional experiments were performed with intubated animals (ISO n=6, MEDE n=6, ISO+MEDE n=7; 53 breaths/min). We acquired ADC maps (TR/TE:4250/42.8 ms, eight b-values) to assess diffusion in cortex and aqueduct, T2-weighted images to assess size of subarachnoidal space, and TOF scans. In some animals (n=11) the brain state was simultaneously monitored by optical calcium recordings.Results
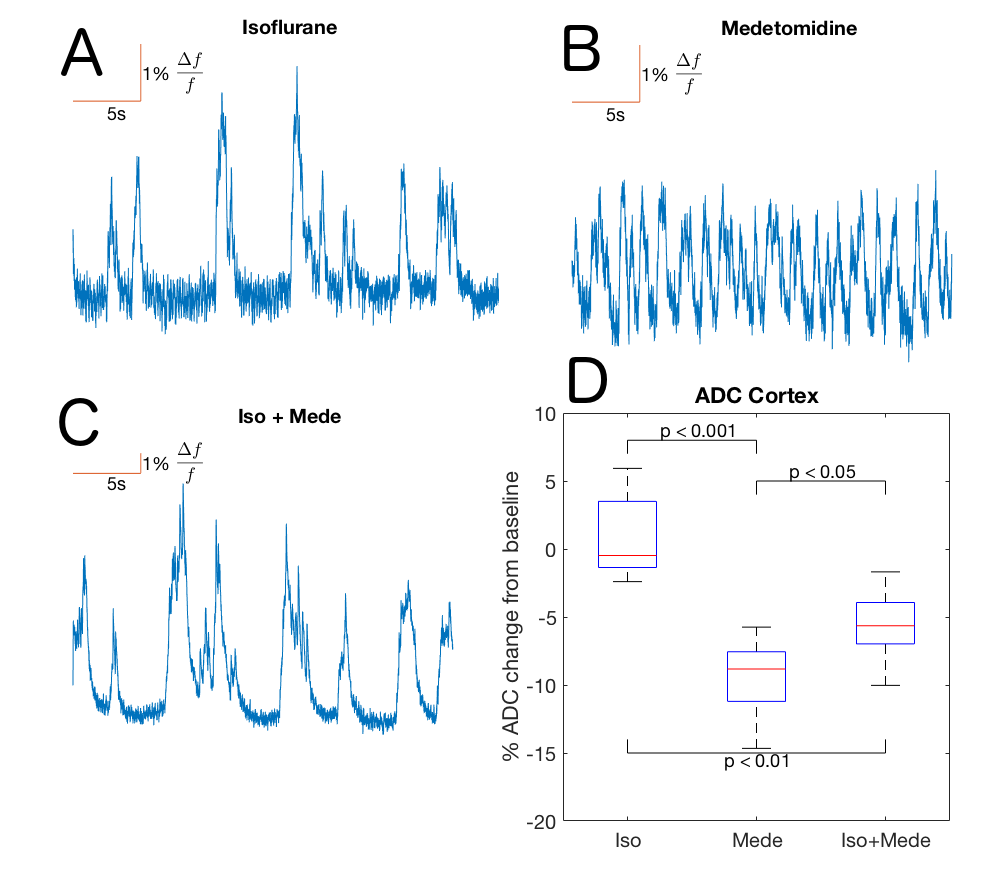
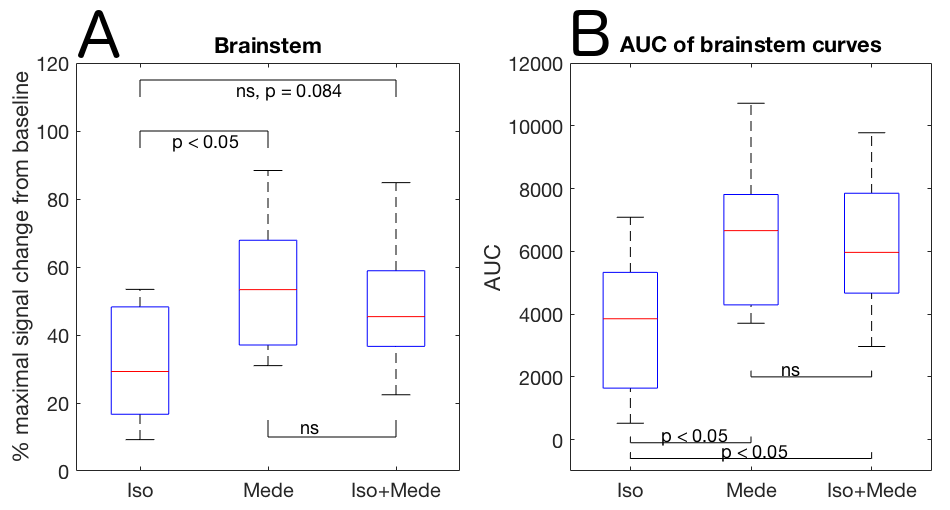
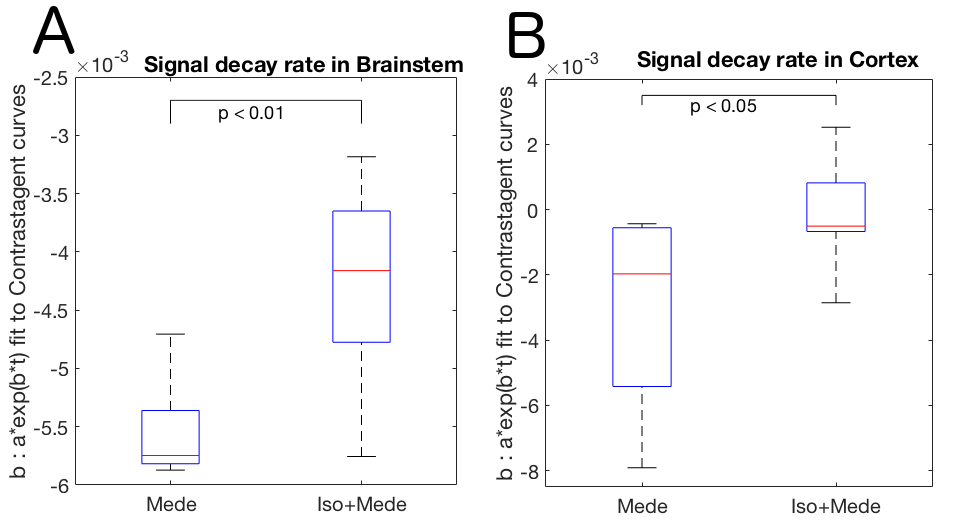
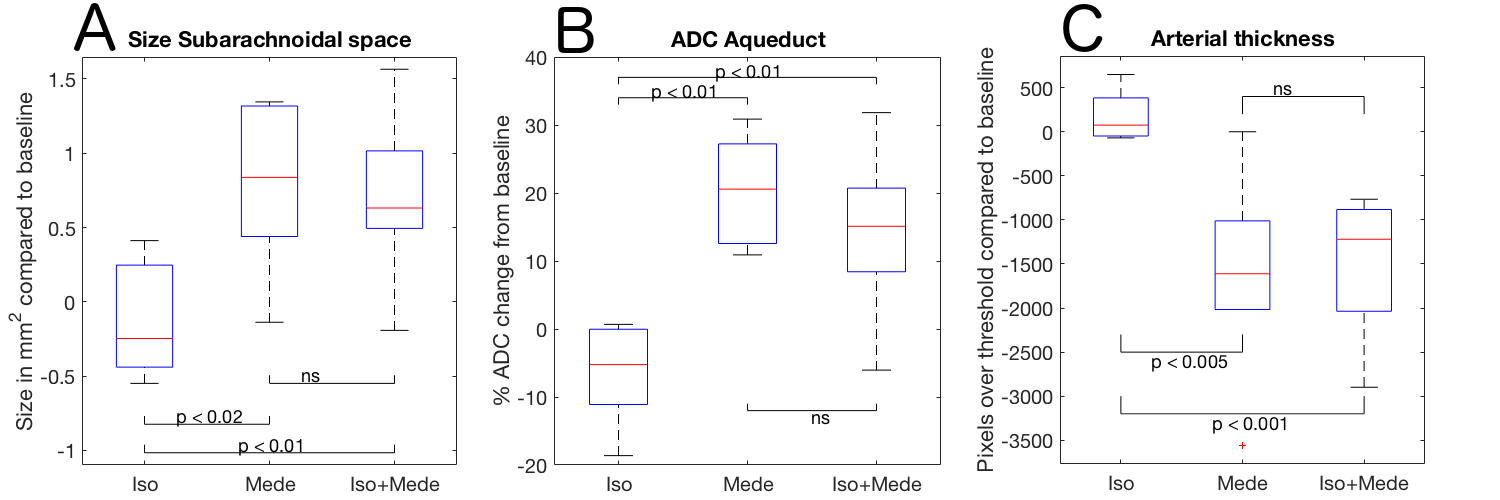
Optical calcium recordings revealed that a slow wave sleep-like brain state was induced under ISO (n=3) and under ISO+MEDE (n=5). Brain activity, resembling awake state, was observed under MEDE (n=3) (Fig. 2). Signal changes in T1-weighted scans due to contrast agent distribution indicated glymphatic activity. Higher signal increase under MEDE (55.6±20.4% maximal change from baseline) compared to ISO (31.4±17.1%) and ISO+MEDE (48.6±20.0%) was observed in brainstem (Fig. 1 and 3). Areas under the curves (AUC) were significantly larger under MEDE and ISO+MEDE compared to ISO, and signal decay rate under MEDE was higher than under MEDE+ISO (Fig. 3 and 4)8. In cortex we observed similar maximal signal enhancements and AUC but the decay rate under MEDE (-0.0029±0.0031) was larger than under ISO+MEDE (-0.00013±0.0016) (Fig. 4). ADC in cortex, an indicator for diffusion in the interstitium, did not show any significant change over time under ISO (0.79±3.22%) but decreased significantly under both ISO+MEDE (-5.59±2.66%) and MEDE (-9.47±3.19%), compared to ISO (Fig. 2). ADC under MEDE was significantly lower than under ISO+MEDE. The size of the subarachnoidal space and the ADC in the aqueduct did not significantly change over time under ISO (-6.59±7.32% ADC reduction from baseline, -0.1373±0.3837mm2 change from baseline), but increased under MEDE (20.45±8.11%, 0.7736±0.6016) or ISO+MEDE (13.88±11.94% , 0.6945±0.5474), as compared to ISO (Fig. 5). TOFs revealed significantly smaller arteries under MEDE and ISO+MEDE, as compared to ISO.Discussion
Higher signal enhancement under MEDE and ISO+MEDE, indicate better CSF intrusion into brain parenchyma compared to ISO. This is in line with a larger subarachnoidal space under MEDE and ISO+MEDE, indicating higher CSF formation confirmed by the increase of ADC in the aqueduct. Smaller arteries under these anesthetic regimens may indicate a change in size of the paravascular space. Our DWI data support the hypothesis that increased diffusion9 during sleep-like brain state results in higher interstitial penetration10 and, accordingly, in slower clearance, observed as decreased decay rate. During awake-like brain state, reduced diffusion results in lower interstitial penetration and faster clearance by more efficient perivascular pathways.Conclusion
Our data support the notion that the interstitium is cleared via fast dispersion along cerebral arteries and diffusion of CSF. The size of the arteries in combination with the rate of CSF formation determines CSF intrusion, but the interstitial clearance correlates with brain state. Increased CSF production and brain state must therefore be taken into account, to explain enhanced glymphatic clearance during sleep.Acknowledgements
This work was supported by the DFG SFB1009, Medizinerkolleg (MedK) MünsterReferences
1 Iliff JJ, Wang M, Liao Y, et al. A paravascular pathway facilitates CSF flow through the brain parenchyma and the clearance of interstitial solutes, including amyloid β. Sci Transl Med. 2012; 4(147):147ra111
2 Iliff JJ, Lee H, Yu M, et al. Brain-wide pathway for waste clearance captured by contrast-enhanced MRI. J Clin Invest. 2013; 123(3):1299-309
3 Abbott NJ, Pizzo ME, Preston JE, et al. The role of brain barriers in fluid movement in the CNS: is there a 'glymphatic' system? Acta Neuropathol. 2018; 135(3):387-407
4 Asgari M, de Zélicourt D, Kurtcuoglu V Glymphatic solute transport does not require bulk flow. Sci Rep. 2016; 6:38635
5 Hannocks MJ, Pizzo ME, Huppert J, et al. Molecular characterization of perivascular drainage pathways in the murine brain. J Cereb Blood Flow Metab. 2018; 38(4):669-686
6 Xie L, Kang H, Xu Q, et al. Sleep drives metabolite clearance from the adult brain. Science. 2013; 342(6156):373-7
7 Lundgaard I, Lu ML, Yang E Glymphatic clearance controls state-dependent changes in brain lactate concentration. J Cereb Blood Flow Metab. 2017; 37(6):2112-2124
8 Benveniste H, Lee H, Ding F, et al. Anesthesia with Dexmedetomidine and Low-dose Isoflurane Increases Solute Transport via the Glymphatic Pathway in Rat Brain When Compared with High-dose Isoflurane. Anesthesiology. 2017; 127(6):976-988
9 Abe Y, Tsurugizawa T, Le Bihan D. Water diffusion closely reveals neural activity status in rat brain loci affected by anesthesia. PLoS Biol. 2017; 15(4):e2001494
10 Jin BJ, Smith AJ, Verkman AS. Spatial model of convective solute transport in brain extracellular space does not support a "glymphatic" mechanism. J Gen Physiol. 2016; 148(6):489-501
Figures