0748
Gd-DOTA mass distribution from the Glymphatic Pathway into rat brain measured by 3D DCE-MRat 9.4TXiaodan Liu1,2,3, Sunil Koundal1, Simon Sanggaard1, Helene Benveniste1, and Hedok Lee1
1Anesthesiology, Yale School of Medicine, New Haven, CT, United States, 2Yale University, New Haven, CT, United States, 3Medical imaging center, First Affiliated Hospital of JINAN University, Guangzhou, China
Synopsis
The recently discovered the "glymphatic pathway" for brain waste clearance, comprises a brain-wide peri-vascular transit passageway for facilitating CSF-ISF ‘cross-talk’, in an AQP4 water channel driven manner. In this study, we report a method to calculate time-resolved 3D Gd-DOTA mass distribution maps to depict the glymphatic transport. We detected higher mass retention in GM compared to WM, due to the tissue volume differences. High Gd uptake in the cerebellum coincides with the high expression of AQP4 water channels in this area. These findings emphasize the importance of the anatomical glymphatic network with high Gd uptake capacity may be related
Introduction
The recently discovered pathway for brain waste clearance, termed the “glymphatic pathway”, comprises a brain-wide peri-vascular transit passageway for cerebrospinal fluid (CSF) facilitatingCSF-interstitial fluid (ISF) ‘cross-talk’, in an aquaporin-4 (AQP4) water channel driven manner. The CSF-ISF exchange process promotes waste removal from the brain parenchyma via dedicated drainage routes to communicating with authentic lymphatic vessels in the leptomeninges and cervical lymphatics [1]. We previously developed a 3D dynamic contrast enhanced (DCE) MRI protocol in combination with intrathecal administration of low molecular weight gadolinium (Gd) contrast agents to capture glymphatic ‘transport’ in the rodent brain. Several investigators have shown the utility of Gd tracers as surrogate waste markers for evaluating brain-wide glymphatic transportin rodents, primates, dogs, and humans [2-5]. However, previous studies have employed semi-quantitative techniques which prohibit a true estimate of the actual Gd mass contribution of each voxel relative to the total Gd mass retained in the brain. Here we report a novel methodology to derive voxel-wise dynamic mass distribution maps depicting glymphatic transport.Method
Prior to imaging a small catheter attached to a glass cannula was surgically implanted into the cisterna magna for Gd-DOTA administration. All imaging acquisitions were performed on a Bruker 9.4T/16 MRI equipped with a volume transmit and surface receive only coils interfaced with Paravision 6. 13 Sprague Dawley rats (10.4±1.5 months old female) were scanned while anaesthetized with dexmedetomidine supplemented with isoflurane in supine position [6]. A 3D proton density weighted (PDW) was acquired (TR/TE/FA/Ave=50ms/4ms/7°/4 0.26x0.26x0.26mm) for the spatial normalization and tissue segmentation into grey (GM) and white (WM) matter. Gd-DOTA concentration maps were constructed as described previously using VFA-SPGR sequence(TR/TE/FA=15ms/4ms/5° 0.30x0.30x0.30mm)for the pre-contrast T1 and the successive acquisition of single flip angle SPGR for the Gd concentration calculations for 140 min post administration of Gd-DOTA[7]. Each Gd concentration map was spatially normalized to a common stereotactic space using SPM12 with custom tissue probability maps and total Gd-DOTA mass retention was calculated in GM and WM as a function of time. Gd-DOTA mass distribution maps, defined by mass retention in each voxel divided by whole brain Gd-DOTA mass(in %), was calculated at each time point.Results
Mean and SD of GM and WM volumes were 1090±41 mm3and 583±35 mm3, respectively. Total mass retention of Gd-DOTAwithin each compartment was plotted as a function of time as shown in Fig.1a. Consistent with previous studies [6,7], rapid uptake into brain parenchyma peaks~60 min post-administration followed by the gradual decay in both tissue compartments. On average GM and WM contributes 61±3% and 39±3% to the whole brain mass retention, respectively. After normalizing for the GM and WM volumes, the differences between the compartments were reduced and the mass retention within WM per unit volume was marginally higher than GM as shown in Fig. 1b. Gd-DOTA mass distribution maps are shown in Fig.2, demonstrating that the hypothalamus, thalamus, brainstem, and cerebellum are brain regions characterized by elevated mass distribution.Conclusions
In this study, we report a method to calculate time-resolved 3D Gd-DOTA mass distribution maps reflective of glymphatic transport which was not previously feasible with semi-quantitative MRI or optical imaging methods used for glymphatic studies. Whole brain mass retention was investigated specifically in GM and WM compartments separately and yielded higher mass retention in GM compared to WM, however normalizing the values by tissue volumes diminished the differences. 3D distribution maps yielded high Gd uptake in the cerebellum which coincides with the high expression of aquaporin 4 water channels in this brain region [8]. These findings emphasize the importance of anatomical glymphatic network represented by brain tissue with high Gd uptake capacity which may be related with the distribution and functionality of AQP4.Acknowledgements
The present work was supported by National Institutes of Health RF-AG053991, RF-AG057705, R01-NS100366, and Foundation Leducq Transatlantic Network of Excellence (16/CVD/05).References
1. Iliff JJet.al, Sci Transl Med. 2012 Aug 15;4(147) 2. Jiang Q et.al,J Cereb Blood Flow Metab. 2017 Apr;37(4) 3. Goulay Ret.al, Stroke. 2017 Aug;48(8):2301-2305 4. Dobson Het.al, Clin Sci (Lond). 2017 Nov 13;131(22):2745-2752 5. Ringstad G et.al, Brain. 2017 Oct 1;140(10):2691-2705 6. Benveniste H et.al, Anesthesiology. 2017 Dec;127(6):976-988 7. Lee H et.al, Magn Reson Med. 2018 Mar;79(3):1568-1578 8. Hubbard JA et.al, ASN Neuro. 2015 Oct 21;7(5).Figures
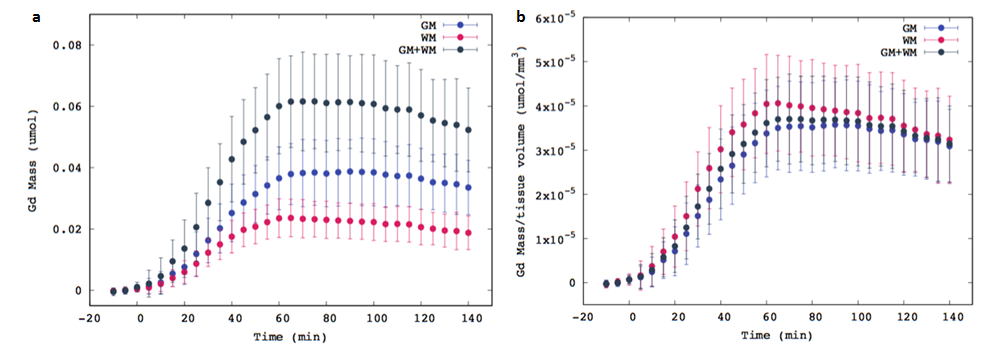
Figure.1 (a) Total Gd-DOTA mass in the whole brain (GM+WM), GM, and WM as a function of
time. (b) Total Gd-DOTA mass normalized by the whole brain volume (GM+WM),
GM volume and WM volume.
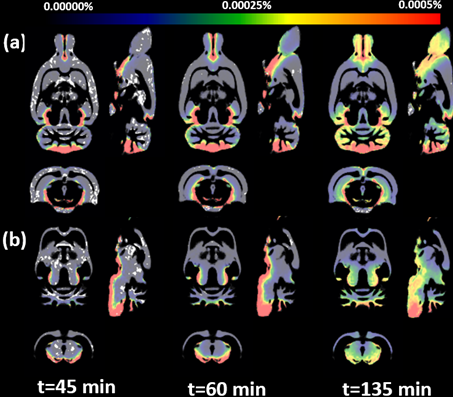
Figure.2 Population averaged (N=13) Gd-DOTA mass distribution maps at three time points from the onset of infusion in (a) GM and (b) WM.