0745
Characterization of Lenticulostriate Arteries using High-resolution 3D Black Blood MRI and Subcortical CBF using 3D pCASL as a Biomarker in Vascular Cognitive Impairment and Dementia1Stevens Institute of Neuroimaging and Informatics, University of Southern California, Los Angeles, CA, United States, 2Neurology, University of Southern California, Los Angeles, CA, United States
Synopsis
Lenticulostriate arteries (LSAs) with small diameters of 280-510 µm take origin directly from the high flow middle cerebral artery (MCA), making them especially susceptible to damage by small vessel disease (SVD). In this study, we characterized the morphology of LSAs using High-resolution 3D Black Blood MRI and measured CBF in the MCA perforator territory (MCAperf) using 3D pCASL in a cohort of elderly Latino subjects. Our results show that the product of LSA delineation rating and MCAperf CBF are positively correlated with cognitive functions, and are reduced in subjects with mild cognitive impairment and hyperlipidemia.
Introduction
Small vessel disease (SVD) is considered a systemic condition of aging resulting from dysfunction of arteriolar perfusion, which is exacerbated by vascular risk factors1. Early cerebral microvascular changes and the resultant effects on tissue perfusion are difficult to evaluate because cerebral small vessels are largely inaccessible to existing clinical in vivo imaging technologies. We recently proposed a “black-blood” MRI technique to visualize lenticulostriate arteries (LSAs) with sub-millimeter spatial resolution using 3D turbo spin echo with variable flip angles (T1w-VFA-TSE)2. The LSAs are known to be involved in silent strokes, which contribute to progressive cognitive impairment in elderly persons3. We present an imaging-based evaluation of the LSAs in conjunction with the perfusion in the middle cerebral artery perforator (MCA perf) territory, and evaluated its associations with cognitive function in a cohort of elderly Latino subjects.Methods
52 volunteers (13 male, 69±7 years) from the Los Angeles Latino Eye Study (LALES) cohort were scanned on a Siemens 3T Prisma scanner using a 20-channel head coil. The T1w-VFA-TSE sequence was optimized using extended phase graph simulation for maximizing LSA contrast2, and the parameters were: TR/TE=1000/12ms, turbo factor=44, matrix size=756x896, resolution=0.51x0.51x0.64mm3 interpolated to 0.3x0.3x0.5mm3, 60 sagittal slices, GRAPPA factor = 2, scan time=8:39min. To evaluate cerebral blood flow (CBF), 3D GRASE pseudo-continuous arterial spin labeling (pCASL) was acquired with TR/TE=4300/36.76ms, label time=1.5s, post label delay=2000ms, slices=48 , resolution=2.5mm3 isotropic, label/control pairs=8 & 1 M0 image, scan time=4:40min. Quantitative CBF maps were calculated, and the LSA/MCA perforator territory4 region of interest (MCAperf) was extracted using our in-house Matlab scripts5.
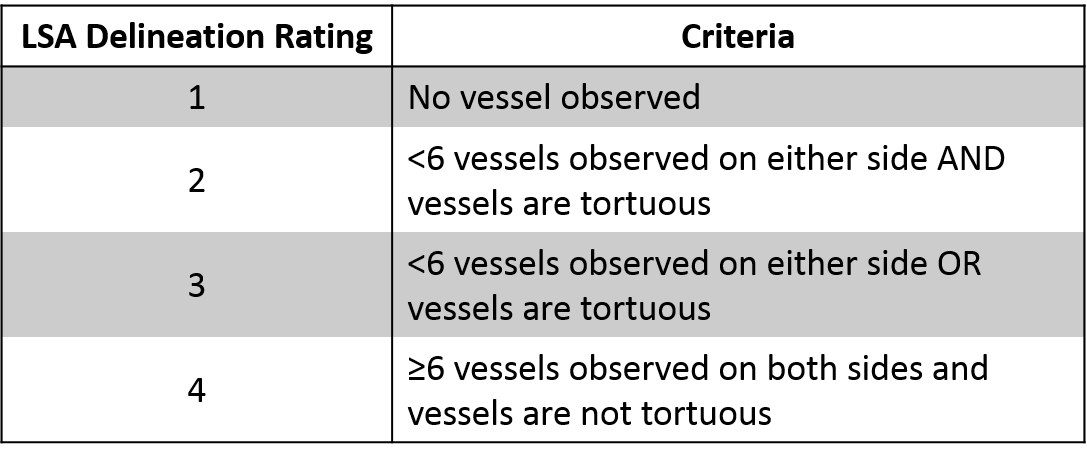
38 subjects were interviewed for history of diabetes, hyperlipidemia, and hypertension, evaluated for Global Clinical Dementia Rating (Global CDR), and given the NIH Toolbox Flanker Inhibitory Control and Attention Test (Flanker), Dimensional Change Card Sort Test (DCCS), and Picture Sequence Memory Test (PSMT). 23 subjects additionally completed the NIH Toolbox 9-Hole Pegboard Dexterity Test (Pegboard). To evaluate the LSA quality in the T1w-VFA-TSE, a 4-point LSA delineation (LSAD) scale was developed and evaluated by two independent raters (Table 1). Cohen’s kappa determined interrater agreement. LSAD and MCAperf CBF were correlated pairwise with Pearson correlation. The interaction term between the mean LSAD rating and MCAperf CBF (LSAD*MCAperfCBF) was then used in a multilevel mixed-effects generalized model (MEGLM) to predict performance on NIH Toolbox tests, adjusted for age, gender, and global CBF. A two-sided Wilcoxon rank-sum test determined if the median LSAD*MCAperfCBF was significantly different between categories for patient vascular risk factors and Global CDR. A p-value of 0.05 was considered significant.
Results and Discussion
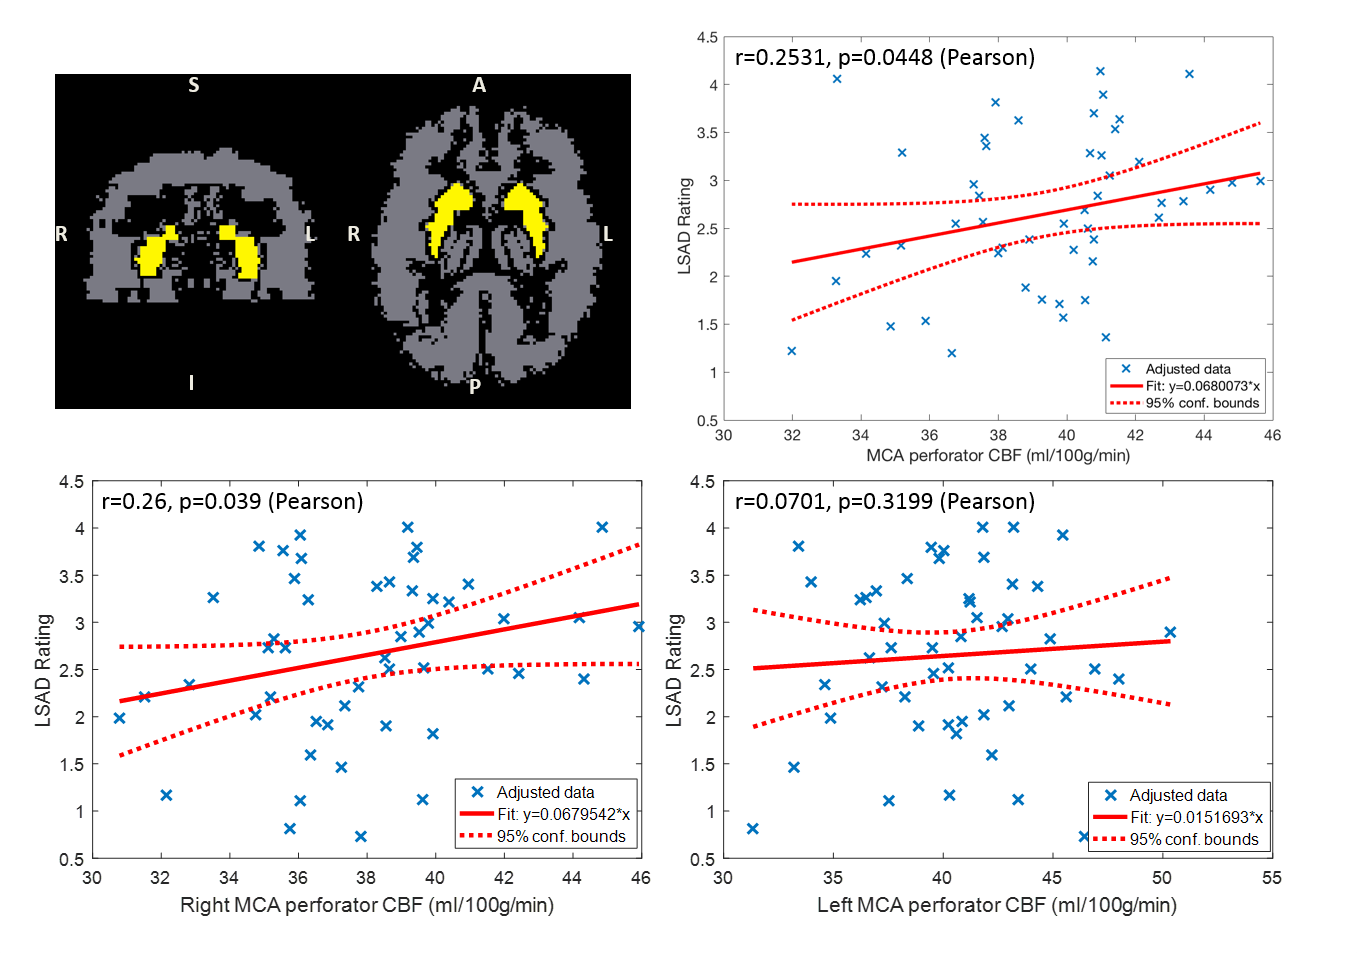
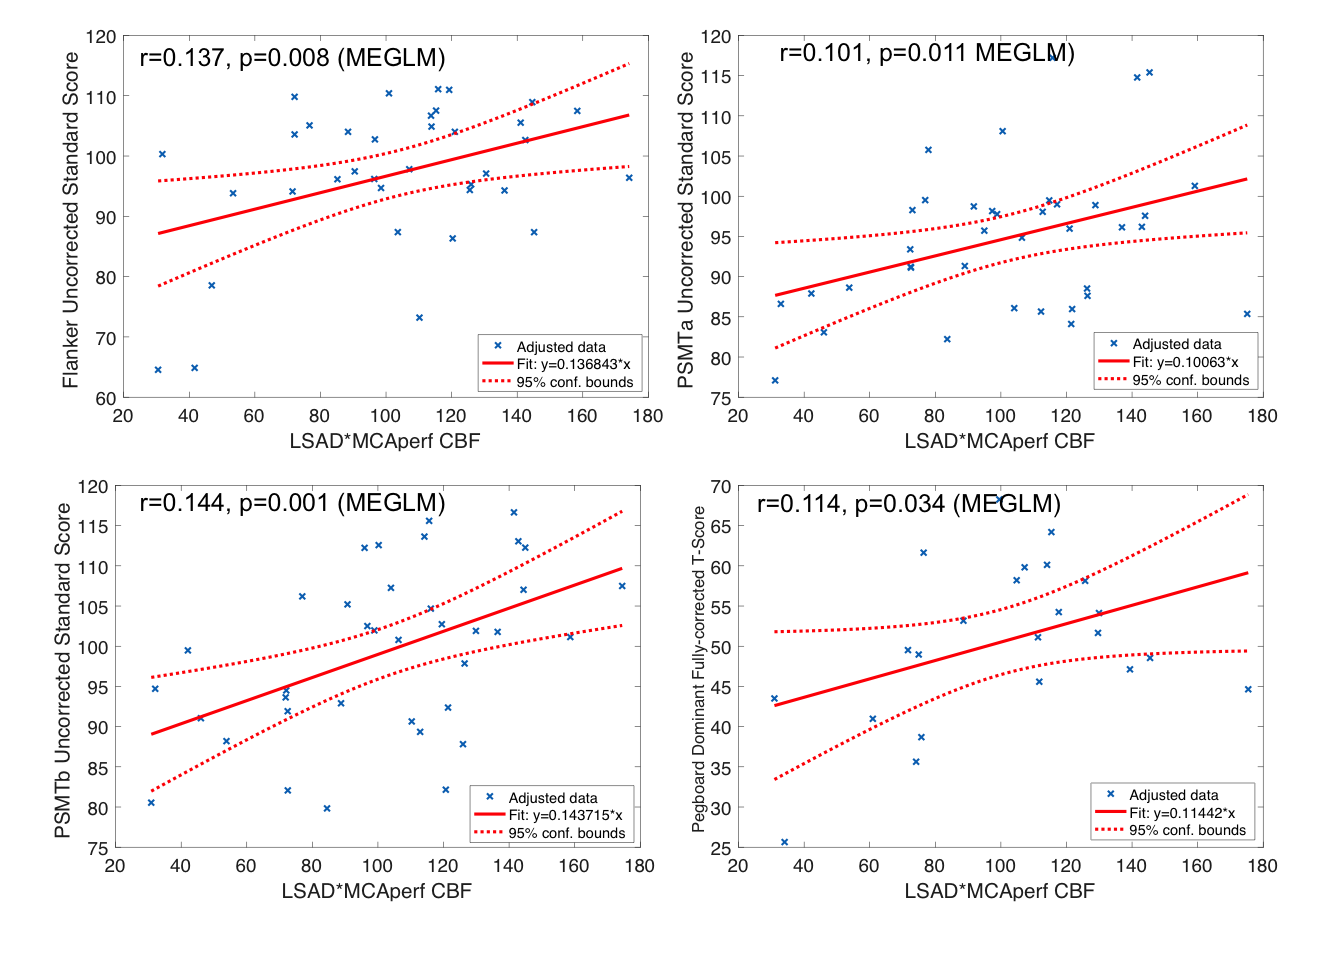
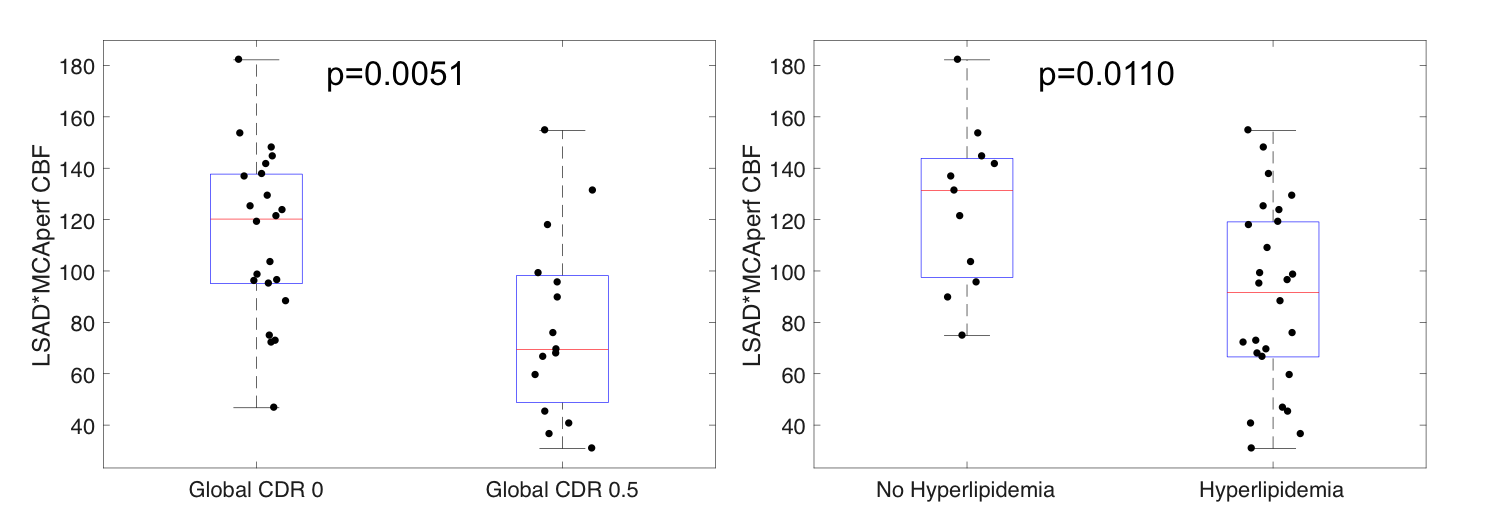
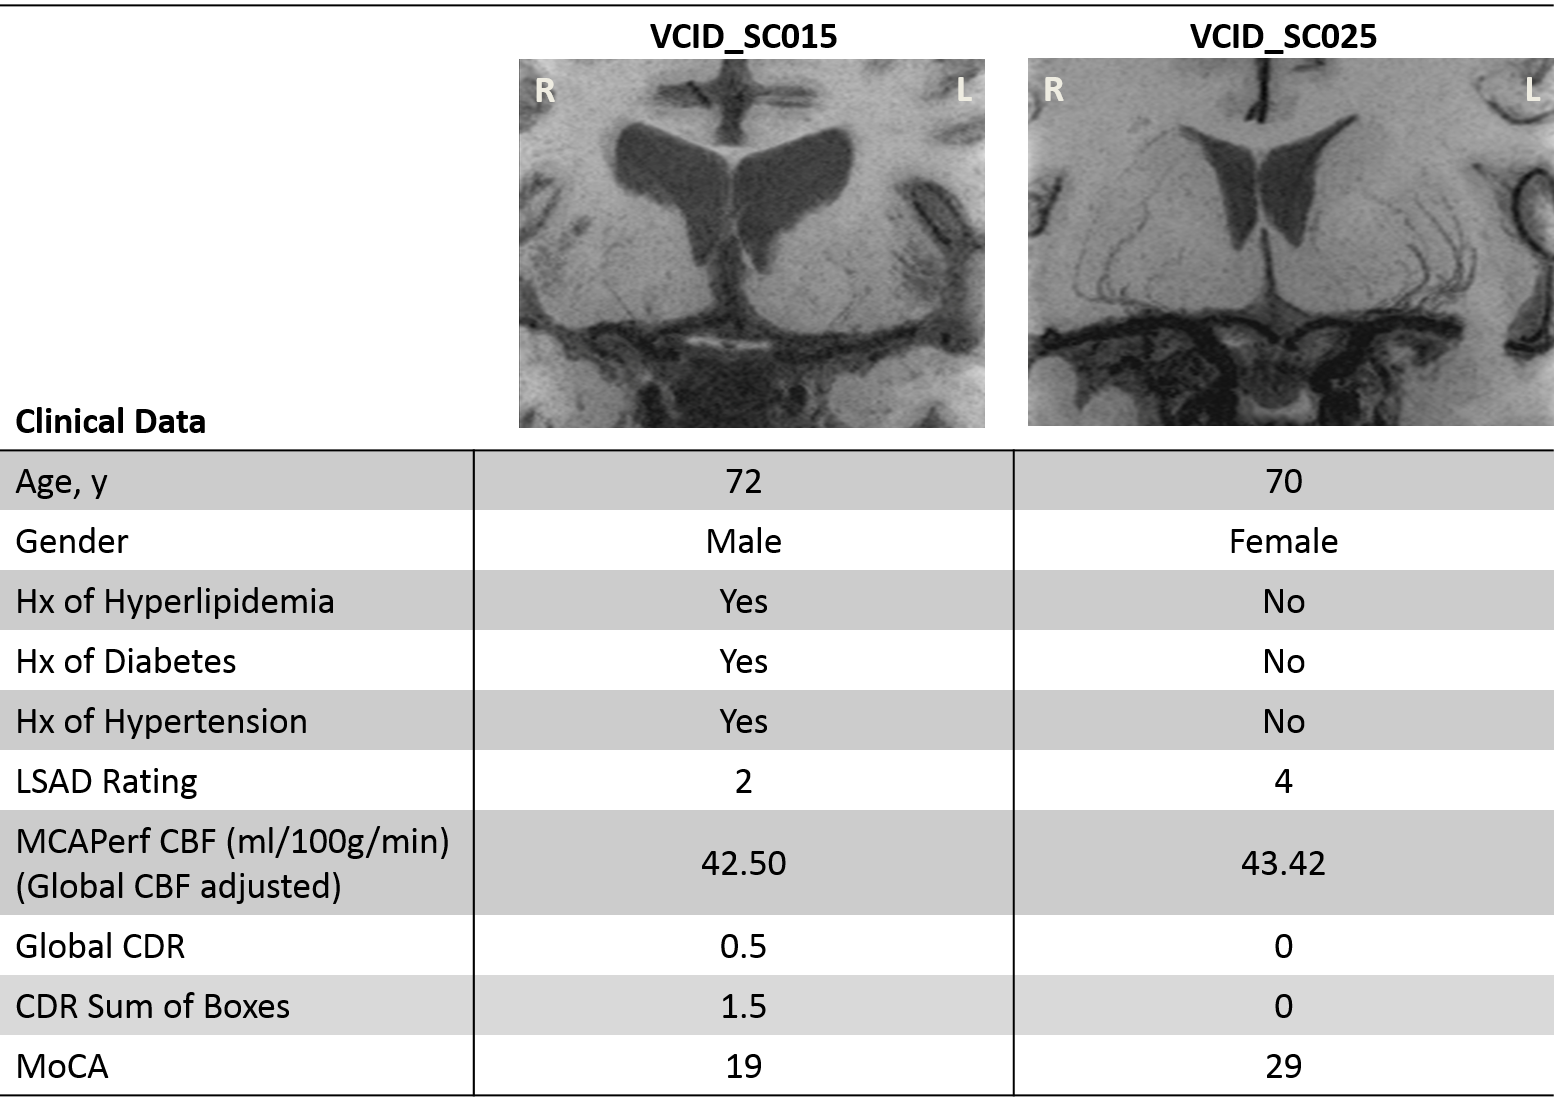
The Cohen’s kappa was 0.7463, indicating 82% interrater agreement for LSAD. Figure 1 shows the relation between MCAperf CBF and LSAD. There was a trend of significant correlation between right MCAperf CBF and LSAD (p=0.039). Observationally, more LSAs could typically be delineated in the left hemisphere than right hemisphere. LSAD*MCAPerfCBF was significantly positively correlated with the uncorrected standard scores for Flanker (p=0.008), PSMTa (p=0.011), and PSMTb (p=0.001) (Figure 2). The pegboard fully-corrected T-score was also significantly positively correlated with LSAD*MCAPerfCBF (p=0.034). In all the NIH Toolbox tests, higher scores indicate higher ability level. Figure 3 shows boxplots of LSAD*MCAPerfCBF for Global CDR of 0 (normal) vs. 0.5 (very mild dementia) as well as history of hyperlipidemia. Wilcoxon rank-sum test indicated the rejection of the equal medians hypothesis for Global CDR (p=0.005) and history of hyperlipidemia (p=0.001), with higher median LSAD for normal subjects. History of diabetes (p=0.178) and hypertension (p=0.198) had no significant differences in LSAD or LSAD*MCAPerfCBF. Figure 4 shows an example of 2 subjects’ LSAs and their clinical data. With poorer vessel quality, MCAperf CBF and vascular risk factors, cognitive function appears to decline.Conclusion
High resolution black-blood T1w-VFA-TSE can be used in conjunction with pCASL to characterize the status of LSAs and subcortical perfusion in patients with vascular risk factors. When LSAD rating and MCAperf CBF are evaluated together, they may serve as a potential imaging-based marker to identify early small vessel changes related to vascular cognitive impairment and dementia.Acknowledgements
This work was supported by National Institute of Health (NIH) grant UH2-NS100614.References
1. Thompson CS, Hakim AM. Living beyond our physiological means. Stroke. 2009;40:e322-e330
2. Ma SJ, Yan L, Jann K, Wang DJJ. High resolution black-blood T1-weighted turbo spin echo with variable flip angles for visualization of small perforating arteries at 3 and 7 tesla. Proc. Intl. Soc. Mag. Reson. Med. 2018;26:3173
3. Vermeer SE, Longstreth WT, Koudstaal PJ. Silent brain infarcts: A systematic review. The Lancet Neurology. 2007;6:611-619
4. Tatu L, Moulin T, Bogousslavsky J, Duvernoy H. Arterial territories of the human brain. Cerebral hemispheres. 1998;50:1699-1708
5. Wang DJJ, Alger JR, Qiao JX, Gunther M, Pope WB, Saver JL, et al. Multi-delay multi-parametric arterial spin-labeled perfusion mri in acute ischemic stroke — comparison with dynamic susceptibility contrast enhanced perfusion imaging. NeuroImage: Clinical. 2013;3:1-7
Figures