0736
On the nodal degree configuration of multimodal brain connectomics in severe asymptomatic carotid stenosis1Department of Radiology, Zhongnan Hospital of Wuhan University, Wuhan, China, 2Department of Nneurology, Zhongnan Hospital of Wuhan University, Wuhan, China
Synopsis
Patients with severe asymptomatic carotid stenosis (SACS) are at high risk of cognitive impairment and future strokes. The basis of remote brain consequences is less well known. We investigated nodal configuration (centrality, hubs, efficiency, resilience, and wiring cost) of multimodal MRI brain connectomics in twenty-four patients with SACS and 24 comorbidities-matched controls. Our results suggest that patients with SACS is predominantly characterized by hub pathology and maladaptive pattern of network efficiency and wiring cost, following primary sensorimotor-transmodal cortical gradient. These results will contribute to a better understanding of the cognitive impairment and future cerebrovascular events in these patients with SACS.
INTRODUCTION
Severe asymptomatic carotid stenosis (SACS) refers to severe (70-99%) stenosis of the internal carotid artery but without previous stroke or transient ischemic attack (TIA). SACS is frequently associated with cognitive impairment (vascular cognitive impairment) and gait disturbance, 1 and an independent risk of future ischemic strokes. 2 Although SACS represents a clinically significant condition, 3 the remote brain consequences of the “silent” stenosis are less well known. Therefore in this study we have two aims, the first is to inquiry the topological configurations of multimodal connectomics that correlated with cognitive impairment in the patients with SACS. The second is sought to explore the vulnerable foci and predict the cerebrovascular risks. We utilized a unique MRI dataset to build multimodal imaging derived connectomics (networks) and investigated their nodal configuration, network resilience, and wiring cost. We calculated lesion loads of hypoperfusion and white matter hyperintensity (WMH) and drew a meta-analytical coactivation map of stroke from previous publications. We hypothesized that SACS will lead to burdens on nodes and network operation, followed by changes in nodal configurations and ultimately the cortical hierarchy.
MATERIALS AND METHODS
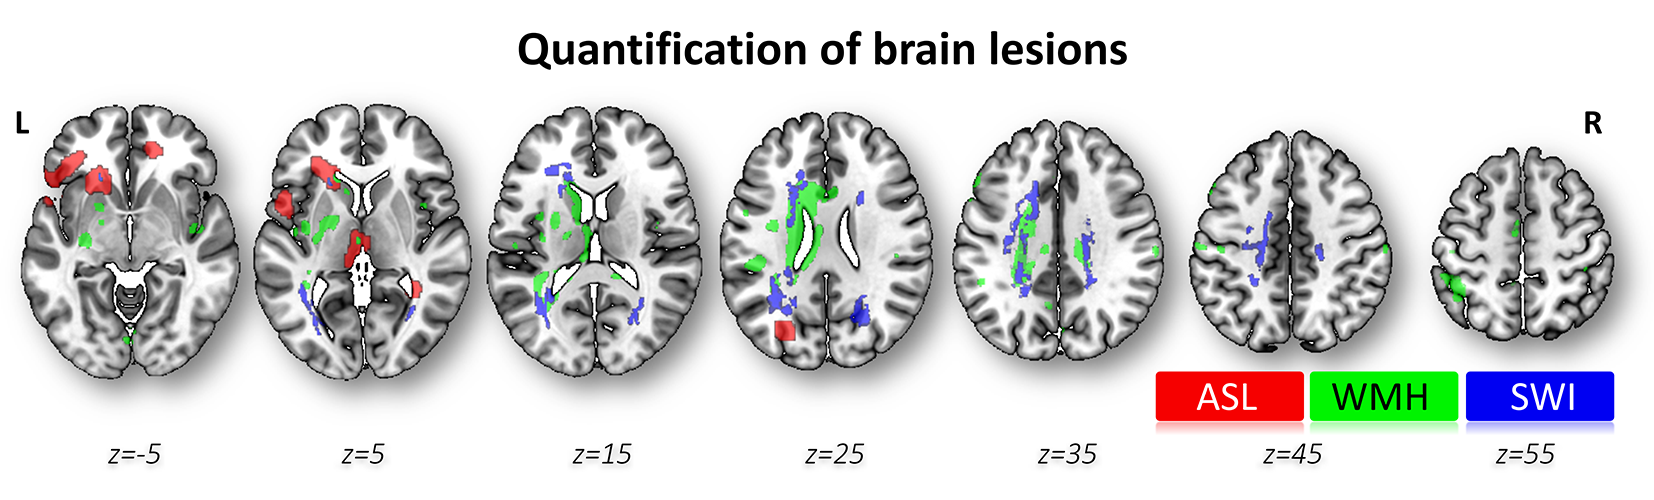
Twenty-four SACS patients and 24 comorbidity- and demographically-matched healthy controls (HCs) were recruited. MRI was performed with a 3.0-T MR system (Siemens, Germany) including T1 anatomical, resting-state BOLD, 64 directions diffusion tensor, susceptibility-weighted imaging (SWI), fluid-attenuated inversion recovery (FLAIR) and pulsed arterial spin labeling (PASL) sequences covered the whole brain. Multimodal MRI data were preprocessed and connectomics were constructed using the 90 regions as nodes and correlation coefficients (connectivity) as edges. Normalized measures (i.e., degree centrality, global and local efficiency) were obtained by comparison with 1000 constrained null (i.e., random) networks. Meta-analytic map of stroke and MRI brain imaging in humans were conducted (coordinates in the MNI space, a total of 108 publications) in Neurosynth (www.neurosynth.org).4 Cerebral microhemorrhages and WMHs were calculated using the SWI, FLAIR and T1-weighted images.RESULTS
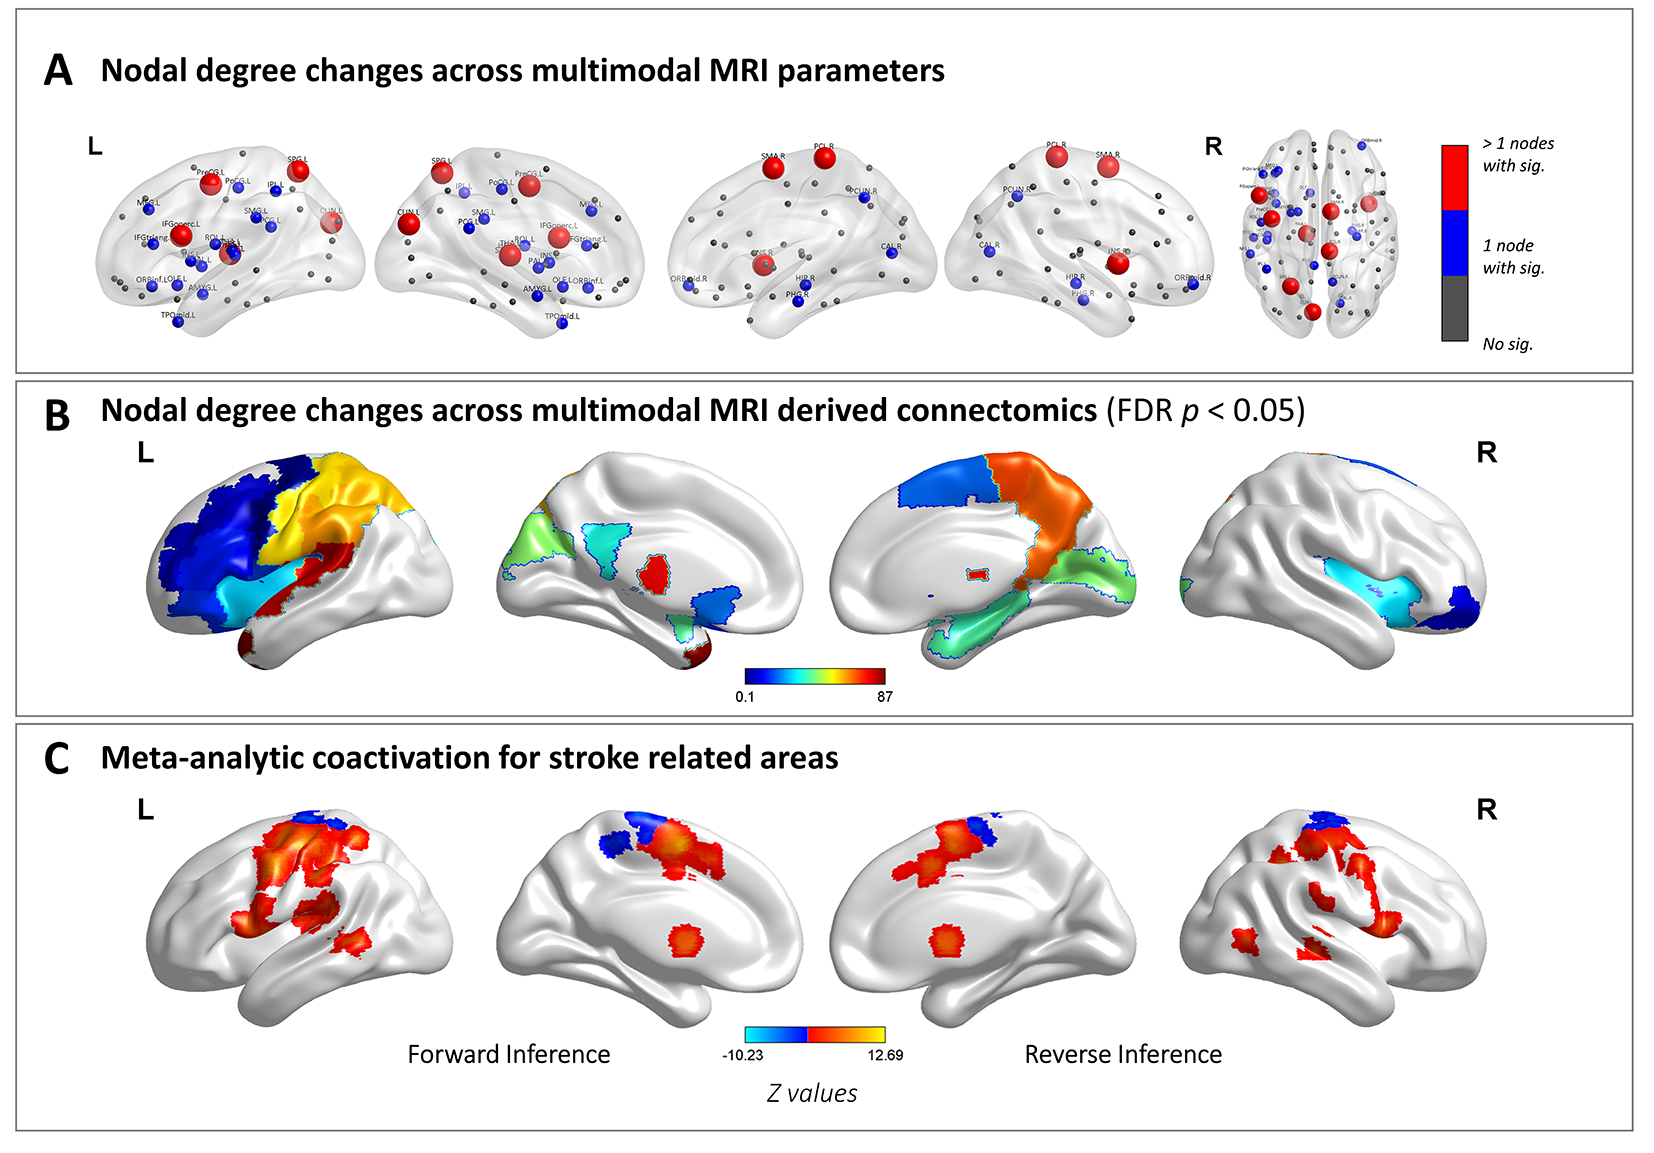
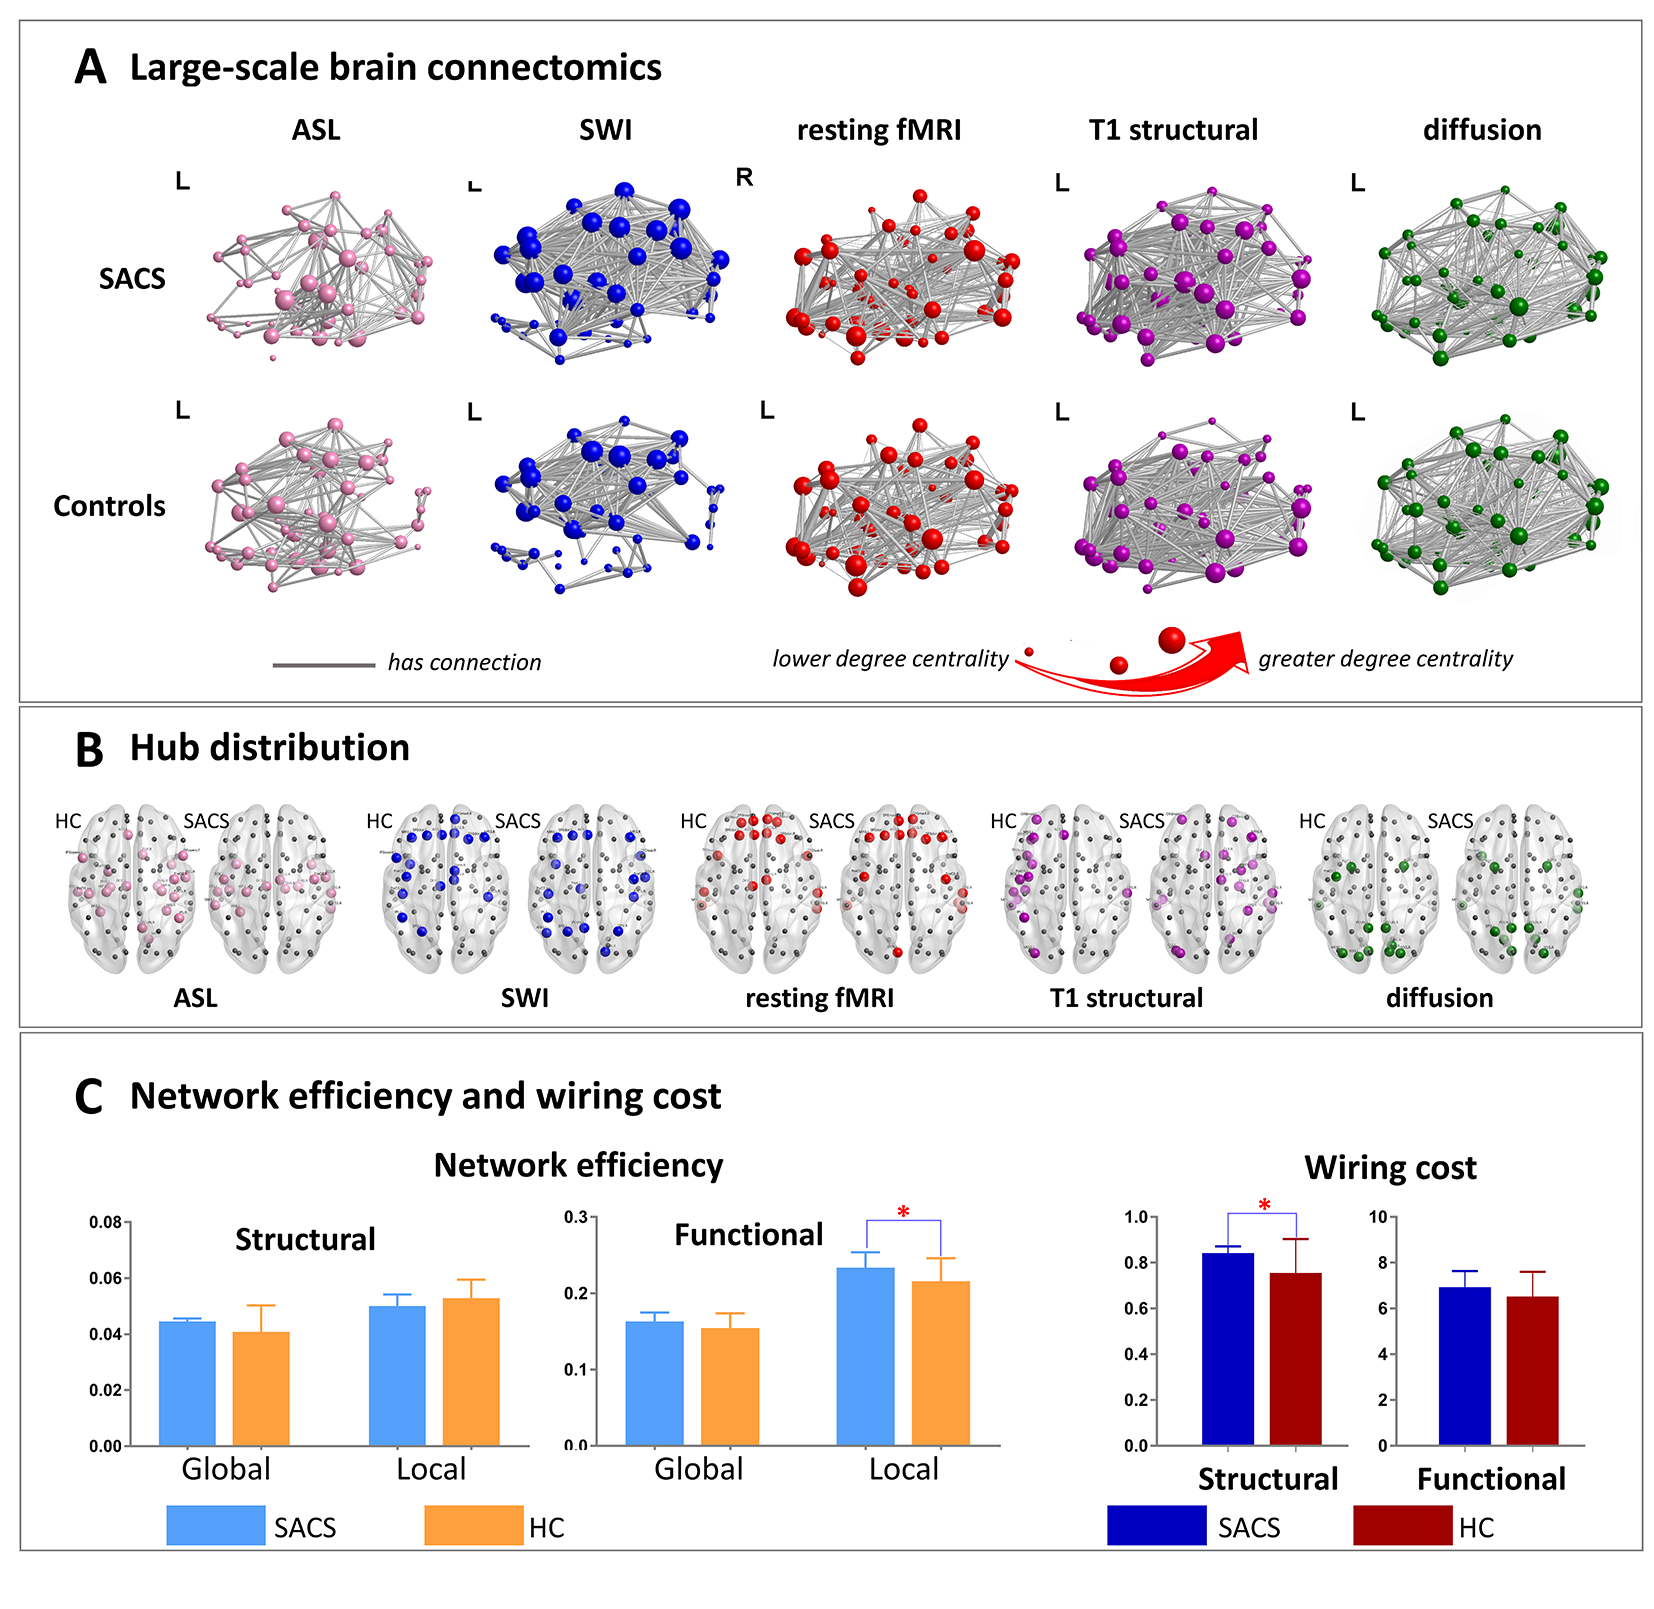
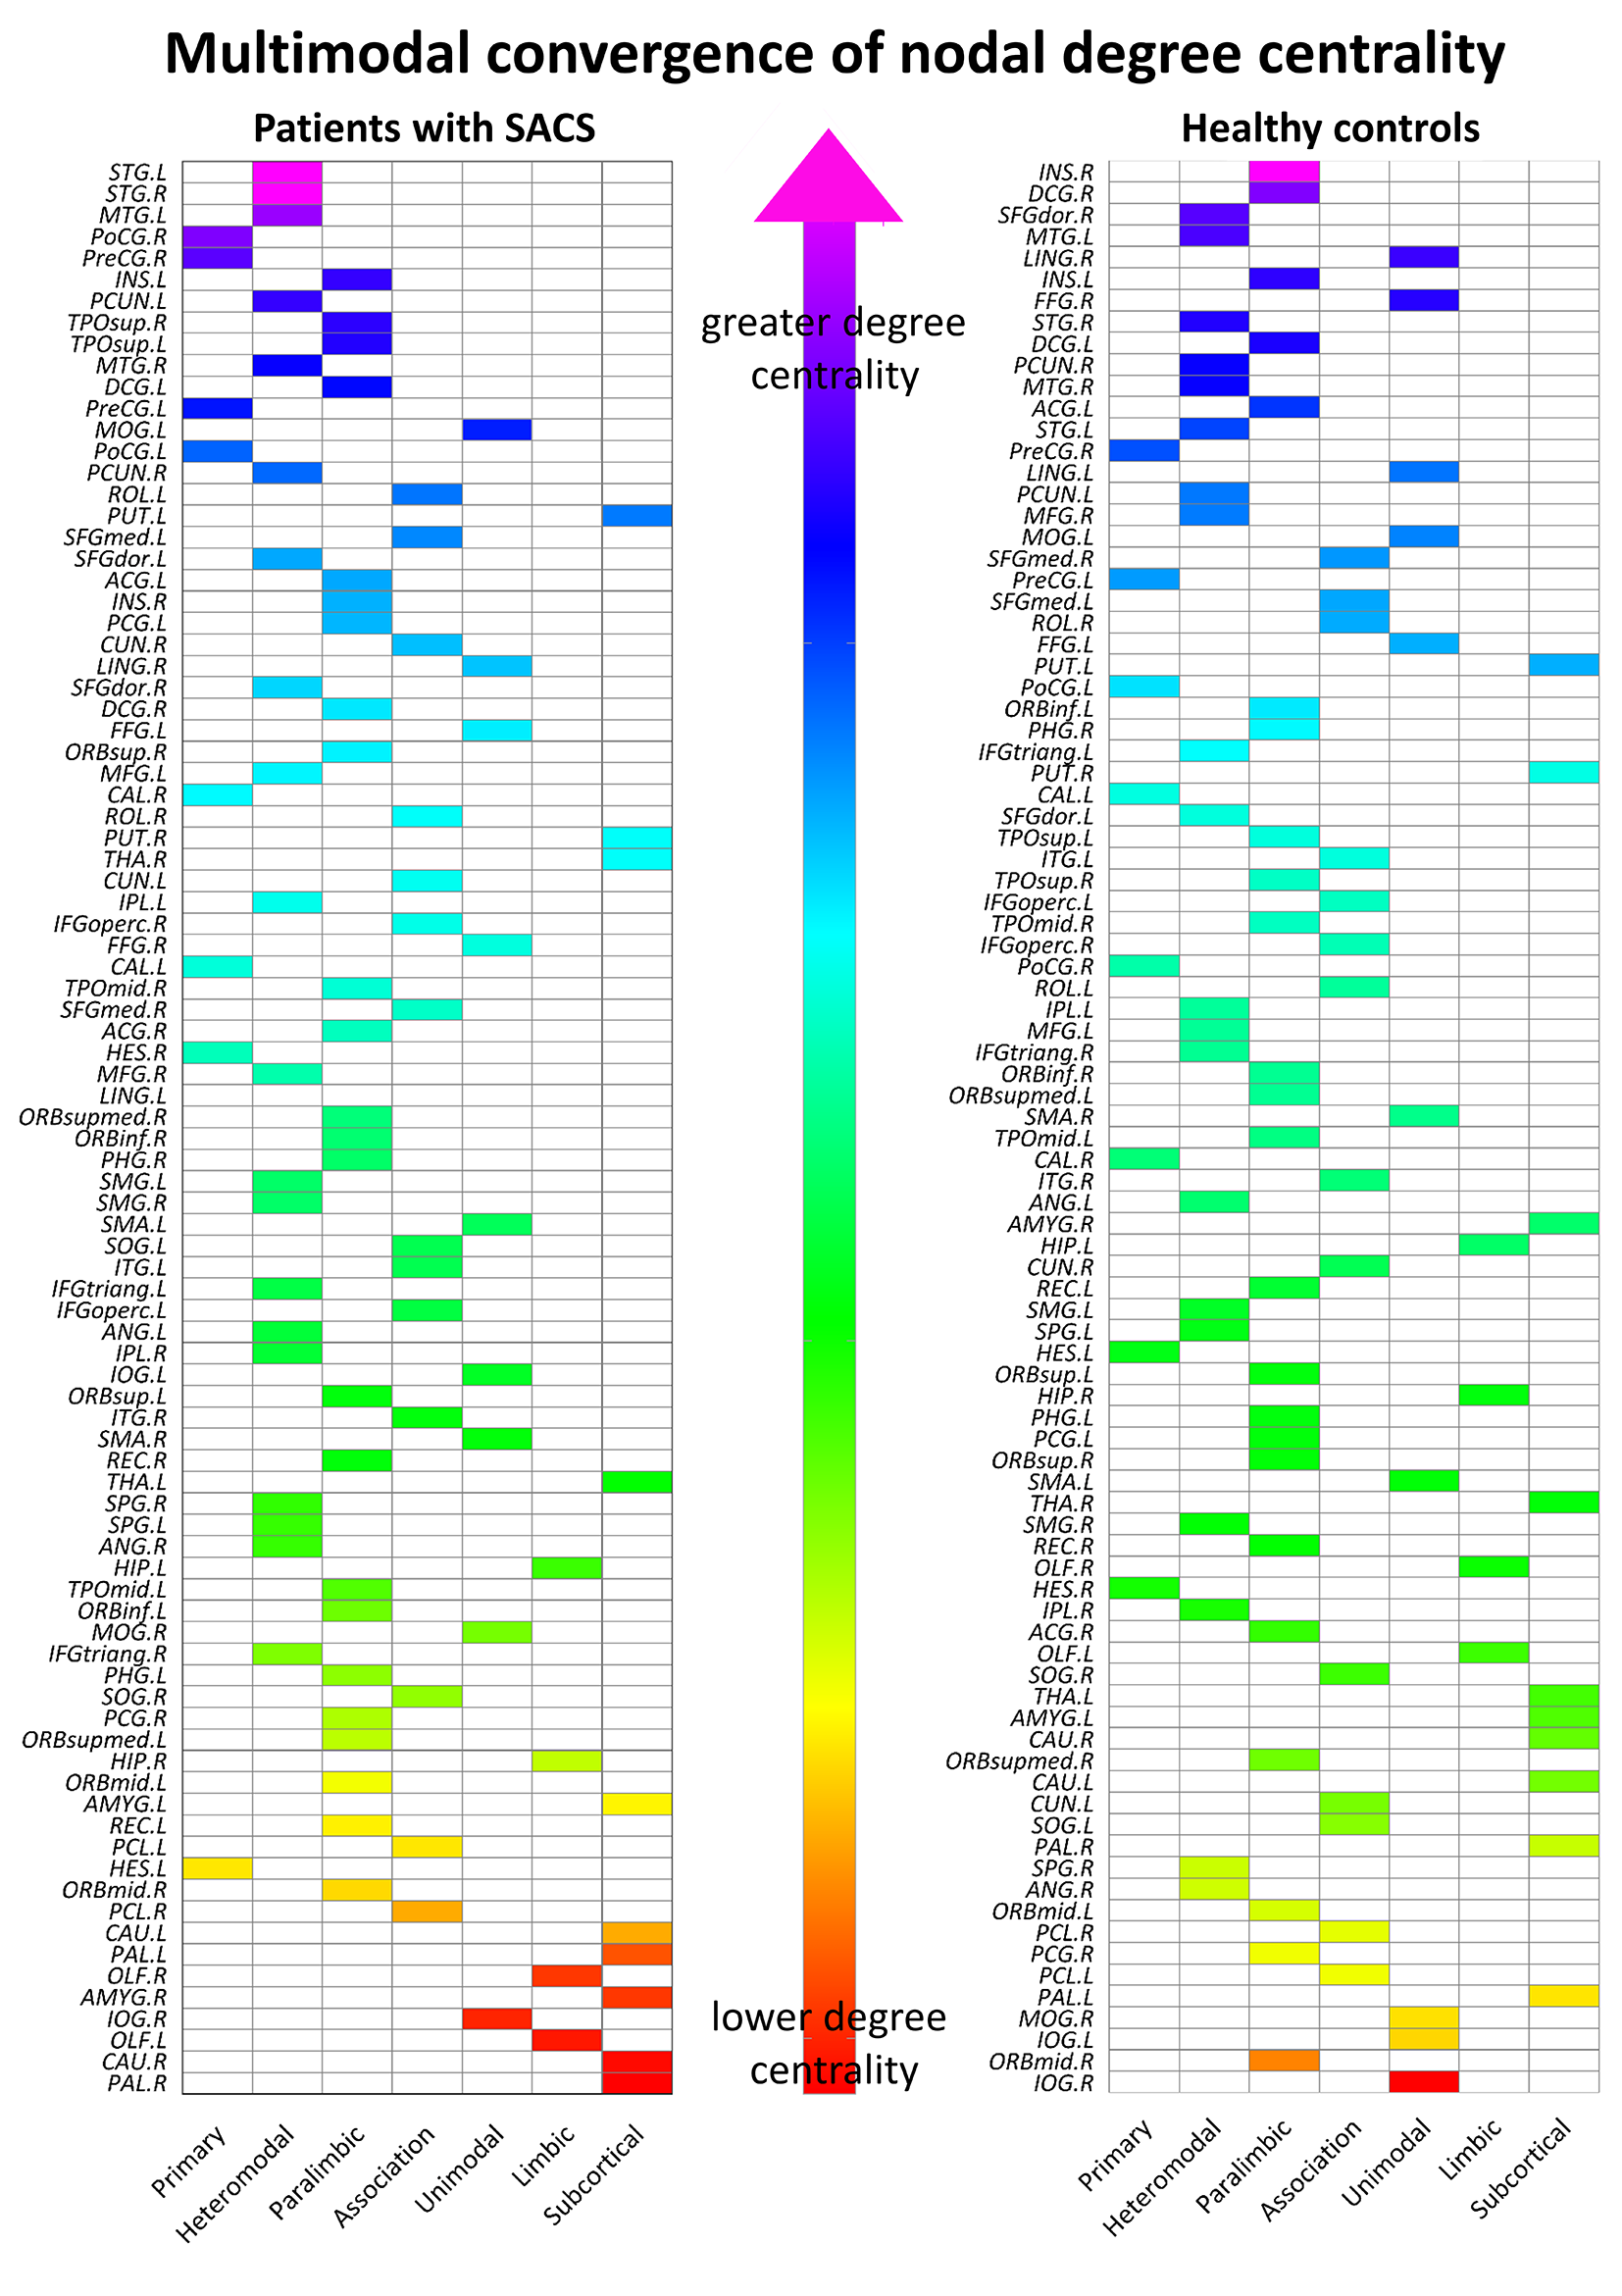
Patients with SACS showed significant converging decreases in nodal degree, mainly across sensorimotor, posterior cingulate/parietal, thalamic, and insular regions (p < 0.05, FDR corrected), and many of these are also located in the hub topography (Figure 1 & 2B), and better matched with the stroke meta-analytical map (Figure 2A). Subsequent multimodal degree rank identified a shift in hub distribution from association to the sensorimotor cortex in the patients with SACS (Figure 2B & 3). In addition, a significantly higher efficiency of functional networks and a higher wiring cost of structural networks were found in the patients with SACS (p < 0.05) (Figure 2C). The brain lesions of SACS patients were mainly located around the periventricular region (Figure 4). Lastly, structural wiring cost was significantly negatively correlated with WMH lesion size (Spearman r = -0.47, 95% CI -0.77 to -0.01, p = 0.04) and MMSE (Spearman r = -0.55, 95% CI -0.81 to -0.11, p = 0.02), and positively correlated with delayed recall (Spearman r = 0.49, 95% CI 0.04 to 0.78, p = 0.03).DISCUSSION
Our study extends upon investigations of network architecture through multimodal MRI integration. Decreased nodal degree centrality are generally consistent with previous reports on human brain imaging3, 5-9 10, rodents6, 7, 11, and with the meta-analytical map of stroke. Notably, most of the regions as found here, belong to the hub regions. 12-14 These topographies are assigned to the somatomotor, dorsal attention, frontoparietal, and salience systems that are thought to subserve fine motor, attention, executive, memory, and visceral processes. We next analyzed the hub behaviors. The multimodal convergence suggests that these hubs tended to increase in number in the primary cortices (especially sensorimotor and auditory regions). These changes suggest the remodeling of the individual nodes and their topological configurations in patients with chronic ischemic brain changes. These suggest a hub pathology in SACS. And the pathological pattern is different from that of normal aging and neurodegenerative diseases. Our results of nodal degree and hub analyses, brain lesion and meta-analytical maps, are in good agreement with this. Moreover, the increases in local efficiency and wiring cost suggest that these changes are not optimal and not conducive to long-term brain operation. Therefore, this evidence may suggest that these involved topographies are the key areas susceptible to cognitive impairment and subsequent cerebrovascular events.CONCLUSIONS
This observation suggests that patients with SACS is predominantly characterized by hub pathology and maladaptive pattern of network efficiency and wiring cost, following primary sensorimotor-transmodal cortical gradient. These results will contribute to a better understanding of the cognitive impairment and future cerebrovascular events in these patients with SACS, from multimodal information and network perspective.Acknowledgements
We thank all members of the Departments of Radiology and Neurology at Zhongnan Hospital of Wuhan University for conducting this study as well as all participants for their good collaboration.The author(s) disclosed receipt of the following financial support for the research, authorship, and/or publication of this article: This study has been supported by the National Natural Science Foundation of China (under Grant Nos. 81771819, 81571734, 81571752, and 81771914), National key research and development plan of China (Projects 2017YFC0108803 and 2016YFC0100300), Zhongnan Hospital of Wuhan University Science, Technology and Innovation Seed Fund (Projects cxpy2017048 and cxpy20160057), and the Fundamental Research Funds for the Central Universities (Projects 2042017kf0284 and 2016060605100525).References
1. Dichgans M, Leys D. Vascular cognitive impairment. Circ Res. 2017;120(3):573-591.
2. Spence JD. Asymptomatic carotid stenosis. Circulation. 2013;127(6):739-742.
3. Ortega G, Alvarez B, Quintana M, Yugueros X, Alvarez-Sabin J, Matas M. Asymptomatic carotid stenosis and cognitive improvement using transcervical stenting with protective flow reversal technique. Eur J Vasc Endovasc. 2014;47(6):585-592.
4. Yarkoni T, Poldrack RA, Nichols TE, Van Essen DC, Wager TD. Large-scale automated synthesis of human functional neuroimaging data. Nat Methods. 2011;8(8):665-670.
5. Chang T, Huang K, Ho M, et al. Graph theoretical analysis of functional networks and its relationship to cognitive decline in patients with carotid stenosis. Journal of Cerebral Blood Flow & Metabolism. 2016;36(4):808-818.
6. Panczykowski DM, Monaco III EA, Friedlander RM. Connectivity Features for Identifying Cognitive Impairment in Presymptomatic Carotid Stenosis. Neurosurgery. 2014;74(4):N9-N11.
7. Lin C, Tu P, Chern C, et al. Connectivity features for identifying cognitive impairment in presymptomatic carotid stenosis. Plos One. 2014;9(1):e85441.
8. Ter Telgte A, van Leijsen E, Wiegertjes K, Klijn C, Tuladhar AM, de Leeuw FE. Cerebral small vessel disease: from a focal to a global perspective. Nat Rev Neurol. 2018.
9. Sun Q, Xia Z, Qu C, et al. Carotid artery stenting ameliorates the cognitive impairment in patients with leukoaraiosis, the ischemic change of cerebral white matter. The Tohoku journal of experimental medicine. 2014;233(4):257-264.
10. Wang T, Xiao F, Wu G, et al. Impairments in Brain Perfusion, Metabolites, Functional Connectivity, and Cognition in Severe Asymptomatic Carotid Stenosis Patients: An Integrated MRI Study. Neural Plast. 2017;2017.
11. Cheng H, Lin C, Soong B, et al. Impairments in cognitive function and brain connectivity in severe asymptomatic carotid stenosis. Stroke. 2012;43(10):2567-2573.
12. van den Heuvel MI, Turk E, Manning JH, et al. Hubs in the human fetal brain network. Dev Cogn Neuros-Neth. 2018;30:108-115.
13. Crossley NA, Mechelli A, Scott J, et al. The hubs of the human connectome are generally implicated in the anatomy of brain disorders. Brain. 2014;137(Pt 8):2382-2395.
14. van den Heuvel MP, Sporns O. Rich-club organization of the human connectome. J Neurosci. 2011;31(44):15775-15786.
Figures