0729
Simulation of MRI gradient-induced cardiac stimulation: Are the current safety regulations too conservative?1Computer Assisted Clinical Medicine, Medical Faculty Mannheim, Heidelberg University, Mannheim, Germany, 2A. A. Martinos Center for Biomedical Imaging, Department of Radiology, Massachusetts General Hospital, Charlestown, MA, United States, 3Harvard Medical School, Boston, MA, United States, 4Harvard-MIT Division of Health Sciences and Technology, Cambridge, MA, United States
Synopsis
Current MR safety standards significantly limit the use of some MRI gradient systems to prevent cardiac stimulation, even though there is suspicion that these limits are too restrictive. This work combines a recently developed simulation framework for Peripheral Nerve Stimulation (PNS) with electrical models of excitable cardiac tissue (ventricular muscle and Purkinje fibers) to investigate the relationship between PNS and cardiac stimulation thresholds. Considering the lack of experimental data on gradient-induced cardiac stimulation in humans, the presented simulation approach could provide valuable new insights on the mechanisms behind cardiac magnetostimulation and might eventually help to determine appropriate safety limits.
Target audience
Those interested in MR safety, gradient designers.Purpose
The IEC 60601-2-33 safety standard limits MRI gradient switching speed (dB/dt) to prevent Peripheral Nerve Stimulation (PNS) and cardiac stimulation1. For high-performance gradient systems with large Gmax, such as the MGH Connectome scanner (Gmax=300 mT/m), the cardiac safety limit can be more restrictive than the PNS limit2. The IEC cardiac safety limits were set based on the work of Reilly3, who assumed that the electric field (E-field) rheobase of cardiac fibers is the same as that of large myelinated nerve fibers (Erheo=6 V/m). However, there is evidence that this overly conservative. For example, Irnich suggested using a value of Erheo=60 V/m for cardiac fibers based on a compilation of 17 animal and human studies4, which would increase the safety limit by an order of magnitude. In this work, we combine a recently developed framework for accurate simulation of PNS5,6 with electrical models of 1) ventricular muscle fibers (cardiac muscle cells can both contract and conduct action potentials (AP)), and 2) Purkinje fibers which propagate the depolarization wave from the base to the left (LV) and right ventricles (RV). We use this modeling to shed light onto the relationship between PNS and cardiac thresholds as well as the mechanisms behind cardiac magnetostimulation by extracellular fields.Methods
Cardiac fiber models: We add manually drawn fiber pathways that are representative of the ventricular muscle fibers and the Purkinje fibers in the normal heart (Fig. 1) to a detailed electromagnetic/nerve female body model. We model two Purkinje fiber branches that innervate the LV and RV. For the ventricular muscle fibers, we reproduce the well-known helicoidal structure by modeling ten clockwise (endocardium) and ten counterclockwise (epicardium) fiber paths.
Stimulation threshold simulation: We simulate the stimulation thresholds induced by a commercial whole-body gradient system (Siemens Sonata, three axes modeled) in our female body model following a simulation workflow described previously5. Briefly, we 1) compute the E-field induced in the body using a hexahedral magneto-quasistatic FEM solver (Sim4Life, Zurich MedTech, Switzerland), 2) project the E-field onto the nerve/cardiac fibers, and 3) compute the electrical response of the fibers to this stimulus. We model cardiac muscle fibers using the Luo-Rudy model of ventricular cells with gap-junctional coupling7,8. For the Purkinje fibers, we use the McAllister-Noble-Tsien model9 in combination with the cable equation10. Peripheral nerves are modeled using the McIntyre-Richardson-Grill model11 (Fig. 2). We compute PNS and cardiac stimulation thresholds by increasing the gradient waveform amplitude at a given frequency and for a given gradient axis until an AP is observed (“titration”). We repeat this process for frequencies in the (50–2500) Hz range.
Results
Figure 3 shows the E-field produced by the Z-gradient in the female body model at a slew rate of 100 T/m/s. The heart zoom insert shows that the peak E-field induced on the myocardial surface is much smaller (1 V/m) than in the periphery (13 V/m peak E-field in the whole torso). Thus, the heart is electrically shielded by the rest of the body. Moreover, Fig. 3 shows that the E-field distribution on the myocardium is highly non-uniform, with a 2-fold E-field magnitude variation from apex to base.
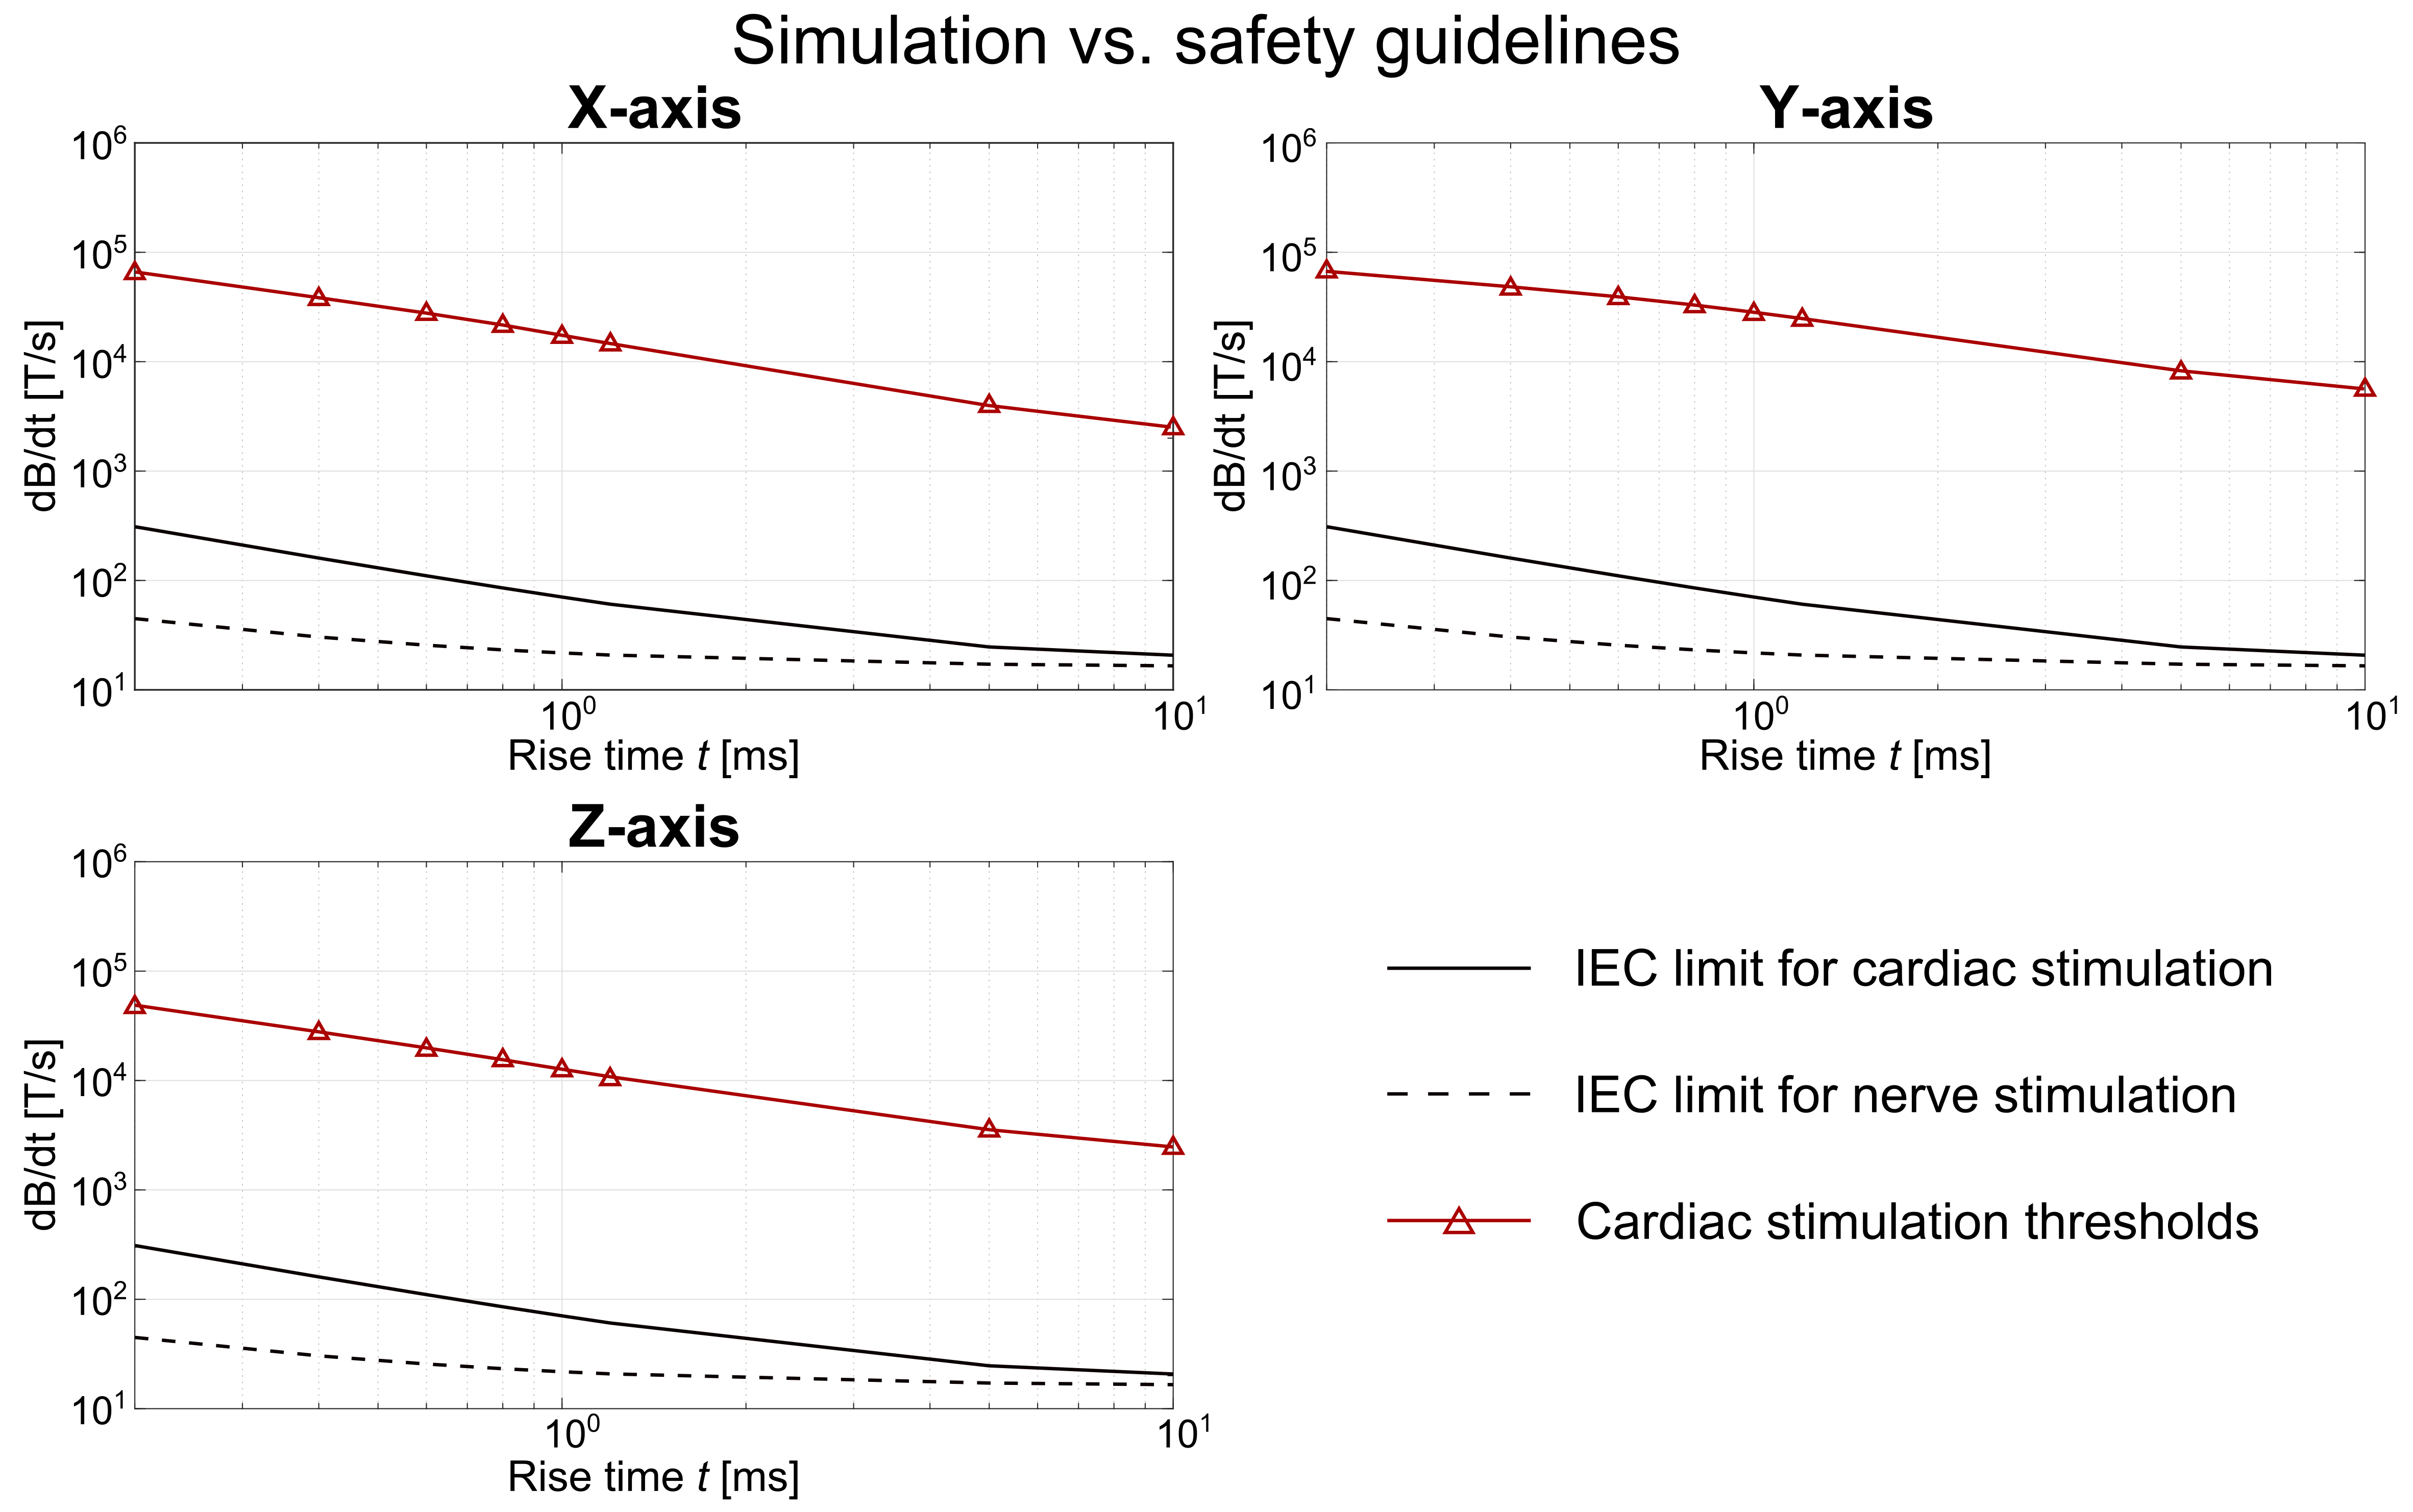
Figure 4 shows the cardiac and PNS thresholds for the three gradient axes. In our simulations, the practical cardiac threshold is set by the ventricular muscle fibers (the Purkinje fibers are harder to stimulate). For a rise time of t=1 ms, the cardiac thresholds are 540-fold, 2740-fold and 610-fold greater than the PNS thresholds for the X-, Y-, and Z-axis, respectively. Figure 5 shows the same results translated to dB/dt units, in comparison to the IEC safety limits.
Discussion
Lack of experimental data on gradient-induced cardiac stimulation makes it difficult to validate the simulation results. However, measurements from cardiac pacemaker studies might be used to this purpose. Moreover, including an automatic definition of realistic ventricular and Purkinje fiber paths12,13 might extend the number of cardiac muscle fibers evaluated.
Despite these current limitations, the preliminary simulations reproduced important theoretical predictions such as the expected large margin between the cardiac thresholds and PNS thresholds4,14 which decreases for long rise times3. The simulated cardiac thresholds are significantly higher (by at least two orders of magnitude) than the IEC safety limits for all investigated frequencies. While preliminary, our findings suggest that simulation tools might play an important role in determining appropriate safety regulations in the future.
Acknowledgements
No acknowledgement found.References
[1] International Electrochemical Commission (IEC), “International standard IEC 60601-2-33 medical electrical equipment. Particular requirements for the safety of magnetic resonance equipment for medical diagnosis”. Technical Report 2010.
[2] Setsompop K et al., “Pushing the limits of in vivo diffusion MRI for the Human Connectome Project”. NeuroImage 80:220-233, 2013.
[3] Reilly J P, “Principles of nerve and heart excitation by time-varying magnetic fields”. Ann. N. Y. Acad. Sci., pages 96–117, 1992.
[4] Irnich W, “Electrostimulation by time-varying magnetic fields”. MAGMA 2:43–49, 1994.
[5] Davids M et al., “Predicting magnetostimulation thresholds in the peripheral nervous system using realistic body models”. Sci. Rep. 7:5316, 2017.
[6] Davids M et al., “Prediction of peripheral nerve stimulation thresholds of MRI gradient coils using coupled electromagnetic and neurodynamic simulations”. Magn. Reson. Med. DOI: 10.1002/mrm.27382, 2018 (in press).
[7] Luo C and Rudy Y, “A Model of the ventricular cardiac action potential: Depolarization, repolarization, and their interaction”. Circ. Res. 68(6):1501-1526, 1991.
[8] Rudy Y and Quan W, “Propagation delays across cardiac gap junctions and their reflection in extracellular potentials: A simulation study”. J. Cardiovasc. Electrophysiol. 2:299-315, 1991.
[9] McAllister R E et al., “Reconstruction of the electrical activity of cardiac Purkinje fibres”. J. Physiol. 251:1-59, 1975.
[10] Sharp G H and Joyner R W, “Simulated propagation of cardiac action potentials”. Biophys. J. 31:403-424, 1980.
[11] McIntyre et al., “Modeling the excitability of mammalian nerve fibers: Influence of afterpotentials on the recovery cycle”. J. Neurophysiol. 87(2):995-1006, 2002.
[12] Merchant S S et al., “Parametric Modeling of the Mouse Left Ventricular Myocardial Fiber Structure”. Ann. Biomed. Eng. 44(9):2661-2673, 2016.
[13] Takashi I et al., “A Procedural Method for Modeling the Purkinje Fibers of the Heart”. J. Physiol. Sci. 58(7):481–486, 2008.
[14] Irnich W and Schmitt F, “Magnetostimulation in MRI”. Magn. Reson. Med. 33:619–623, 1995.
Figures